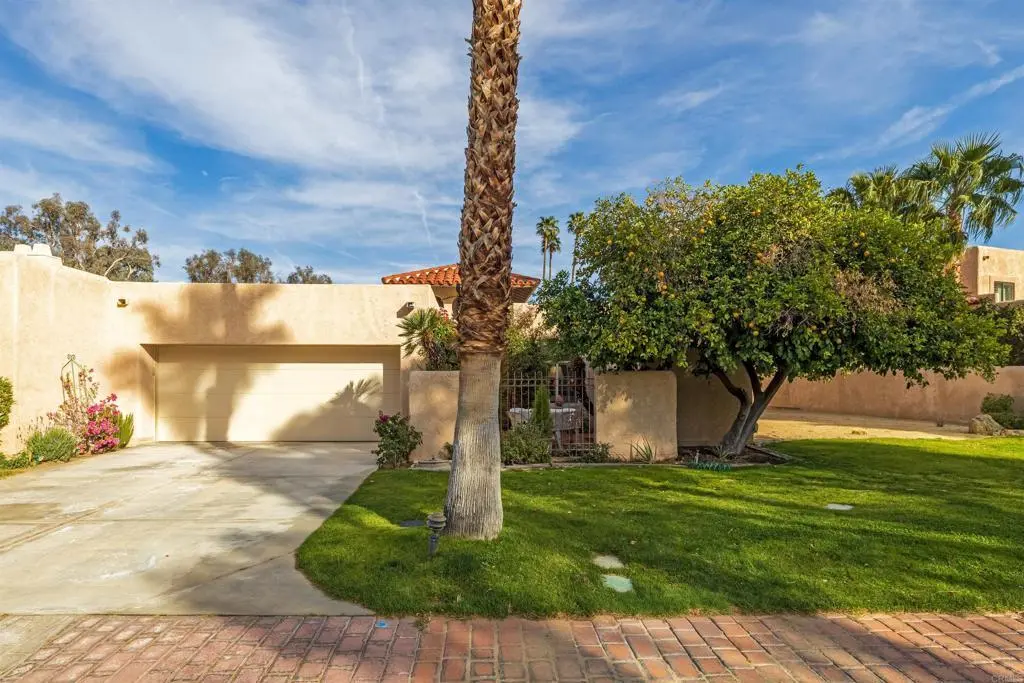
202 Pointing Rock Dr #6 · Borrego Springs, CA
Flood risk 1/10 · Minimal
- FEMA flood zone
- AO
- Chance of flooding over 30 yrs
- 0.0%
- Est. flood insurance / yr
- $848 – $2,087
Fire risk 4/10 · Minor
- Est. fire insurance / yr
- $659 – $1,223
Heat risk 9/10 · Severe
- Hot days now (above 112°F)
- 10 days/yr
- Hot days in 30 yrs
- 28 days/yr
Wind risk 1/10 · Minimal
- Chance of severe wind over 30 yrs
- —
Air-quality risk 3/10 · Minor
- Unhealthy air days now
- 3 days/yr
- Unhealthy air days in 30 yrs
- 4 days/yr
Risk factors via First Street. Map © Google.
Why this score? — see what drove the C grade
The composite is a weighted blend of 9 inputs, each scored 0–100. Each bar is that input's sub-score; the figure is the points it added to the 100-point composite (weight × sub-score).
- Cash flow +23.6/30.0
- 1% rule +9.0/10.0
- ARV discount +8.8/15.0
- DSCR +7.6/10.0
- Livability +2.9/5.0
- Schools +2.6/10.0
- Rent growth +2.5/5.0
- Condition / age +2.5/5.0
- Appreciation +0.0/10.0
$289,900
🖨 Deal sheet (PDF) 📄 Offer letter ✓ Due diligence
Listing remarks MLS
Beautiful Vista Villas with 2 bedrooms, den/optional bedroom with closet, and 2 baths. Kitchen offers custom cabinetry and granite counter tops. Windows and sliders have been updated throughout and patios are tiled and great for entertaining. Master bedroom has a sitting area and bath has dual vanities, soaking tub, separate shower, and large walk in closet. 2 car attached garage with separate laundry room. Complex amenities include pool, spa, tennis, and pickle ball.
Key facts
- Custom cabinetry
- Dual vanities
- Updated windows
Tags
Neighborhood map
What this means for you Summary
Snapshot
- This is a 2-bed/2.0-bath condo listed at $290k.
Deal economics
- At list price, monthly cash flow is $423 ($5k/yr) — positive.
- The deal already cash-flows at list — no discount required.
- Meets the 1% rule at list price ($4k rent vs $290k).
- Recommended offer: $255k (12.0% below list) — sets the bar for market timing.
- Cap rate 8.6% vs local median 6.0% in Borrego Springs — top-decile yield for the area; either an underpriced asset or a hidden risk that comps aren't pricing in. Stress-test before assuming the spread holds.
Location & tenants
- Location reads 58/100 on livability (#712 in CA) — a working-class tenant base; expect higher turnover. Strengths: crime A+, employment A+, housing A+; Watch: amenities F, commute F, cost of living F.
- Borrego Springs Unified (rural): math 20% / reading 35% proficiency, ranked #1,120 of 1,400 in CA (top 80%) — low school quality limits family demand, transient renter base, plan for 1-2y turnover; 72% free/reduced lunch — lower-income household profile, screen leases tightly.
- Zoned schools: Borrego Springs Elementary (math 24% / reading 24%, grade F, #973 of 1,571 statewide, top 73%, 154 students, 84% FRL); Borrego Springs Middle (math 12% / reading 32%, grade F, #388 of 498 statewide, top 80%, 80 students, 92% FRL); Borrego Springs High (math 30% / reading 50%, grade F, #520 of 1,170 statewide, top 45%, 124 students, 87% FRL) — zoned schools average 88% FRL vs 72% district-wide (16 pts higher); higher-poverty schools than district average — tighter screening recommended.
- Market conditions: 172 active listings in the ZIP; 2 comparable units currently listed for rent nearby; 11,759 units permitted in San Diego County in 2024 (7,244 in 5+ unit buildings).
Forward outlook
- Local home prices are declining (-3.0%/yr); year-one equity from $2k of loan paydown is wiped out by about $9k of value loss. Plan a longer hold.
- San Diego County population projected at +20% by 2050 — long-run rental-demand tailwind backs the buy-and-hold thesis.
Negotiation context
- It's been on market 223 days — a 12% lower offer ($255k) is reasonable based on typical stale-listing flexibility.
- 8 sale attempts since 20y ago; this cycle's ask has dropped $20k (6%) from the opening price — seller is motivated, your offer sets the floor, not the list.
Risks & watch-outs
- Watch-outs: flood insurance adds $122/mo.
- Climate carrying-cost: in FEMA flood zone AO (mandatory federal flood insurance); extreme-heat days projected 10→28/yr by 2055 (HVAC capex compounding) — expect insurance premiums to compound above CPI over the hold.
Questions for the listing agent
- It's been on market 223 days. Have you received any prior offers? Is the seller open to a 12% concession, seller financing, or rate buy-down credit?
- Built in 1979 — when were the roof, HVAC, electrical panel, plumbing, and water heater last replaced?
- What's the actual annual flood-insurance premium (NFIP or private), and is the property in a SFHA with mandatory coverage?
- What does the HOA fee cover, when was the last increase, and are there any pending special assessments or reserve-fund shortfalls?
- Any open or pending special assessments — roof, HVAC, plumbing, elevator, façade? What's the per-unit balance and payoff schedule, and is the seller paying it off at close or rolling it to the buyer?
- Why hasn't it sold? Are there any deal-killer items the seller is aware of (foundation, flood, title, zoning, code violations)?
- Is there a deadline driving the sale (1031 exchange, divorce, estate, relocation)? That informs how much negotiation room exists.
- Schools are F-rated, which usually means shorter tenancies and higher turnover. Who's the typical renter profile here, and what's been the actual vacancy rate?
- What's the average days-on-market for RENTAL listings here right now (not sales)? A rising rental-DOM trend means longer vacancies and softer asking-rent achievability than the comps imply.
- What's the recent tenant-quality profile in this submarket — average credit score on applications, eviction rate, late-payment / NSF rate, and stable-employment percentage? A property-management company in the area should have these aggregated.
- How much new apartment / multifamily construction is in the pipeline within 1–3 miles? Heavy new supply (>2% of stock underway) typically softens rents 12–24 months out; light construction supports rent growth.
Investment metrics
- 1% rule
- 1.40% ✓
- Cap rate
- 8.55%
- Cash-on-cash
- 8.06%
- DSCR
- 1.36
- GRM
- 5.9
CMA / ARV
- ARV (median comp)
- $298,266
- List price
- $289,900
- Delta
- -2.80%
- Verdict
- FAIR
- Comps
- 10 within 1.0 mi
Projected returns pro-forma
-3.0% appreciation · 3.0% rent growth · sell at horizon
- IRR
- -6.5%
- Equity multiple
- 0.76×
- Total profit
- $-19,486
- Equity at exit
- $43,225
- IRR
- 3.4%
- Equity multiple
- 1.25×
- Total profit
- $19,940
- Equity at exit
- $25,065
Cash invested: $81,172 (down + closing). Projections, not guarantees.
Landlord ↔ Tenant lean methodology
- Overall (STATE)
- 18 Strongly Tenant-Friendly
- State California
- 18 Strongly Tenant-Friendly · D+13
- County
- — inherits STATE
- City
- — inherits STATE
ZIP-level market 92004
- Home prices YoY
- -18.4%
- Active inventory
- 172
- Price-to-rent
- 5.9×
Monthly cashflow live
- Estimated rent
- $4,066 medium interval (Pro) →
- Mortgage (P&I)
- −$1,520
- Tax from tax record
- −$268 /mo · $3,216/yr
- Insurance
- −$121
- Flood insurance flood zone
- −$122 /mo · $1,468/yr
- HOA
- −$758
- Vacancy / Maint / Mgmt
- −$854
- Net cashflow
- $423
Break-even live
Sensitivity live
| Price | -10% $587 | -5% $505 | +0% $423 | +5% $341 | +10% $259 |
|---|---|---|---|---|---|
| Rent | -10% $102 | -5% $262 | +0% $423 | +5% $584 | +10% $744 |
| Rate | -1.0pp $569 | -0.5pp $497 | base $423 | +0.5pp $348 | +1.0pp $272 |
UW: 25.0% down · 7.5% · 30yr · 1.5% tax · 5.0% vac · 8.0% maint · 8.0% mgmt
Financing live
Cash to close
- Down payment
- $72,475
- Closing costs
- $8,697
- Reserves months
- —
- Total cash needed
- —
Loan-product check · same deal, 3 products live
Conventional
25% down · 7.5% · 30yr
- Down + closing
- —
- Monthly P&I
- —
- Monthly cashflow
- —
- DSCR
- —
- Eligible?
- —
Personal DTI + credit; lowest rate.
DSCR
20% down · 8.5% · 30yr
- Down + closing
- —
- Monthly P&I
- —
- Monthly cashflow
- —
- DSCR
- —
- Eligible?
- —
No personal income docs; deal must DSCR.
Hard money
10% down · 12.0% · 12mo
- Down + closing
- —
- Monthly P&I
- —
- Monthly cashflow
- —
- DSCR
- —
- Eligible?
- —
Short-term bridge; refi at stabilization.
Rent comps 2 comps
| Address | Beds | Baths | Sqft | Rent | $/sqft | DOM | Units | Dist |
|---|---|---|---|---|---|---|---|---|
| 1586 De Anza Dr Borrego Springs, CA | 2.0 | 2.0 | 2236 | $5,000 | $2.24 | 0d | 1 | 0.52mi |
| 344 Velite Dr Borrego Springs, CA | 3.0 | 2.0 | 2005 | $2,500 | $1.25 | 0d | 1 | 0.91mi |
HOA detail condo
- Monthly dues
- $758 · $9,096/yr
- Likely covers
- pool
- Assessments
- None detected in remarks — confirm with the listing agent.
Listing history 37 events
-
2026-06-21days on market $289,900 Active 223 DOM
-
2026-06-19days on market $289,900 Active 221 DOM
-
2026-06-18days on market $289,900 Active 220 DOM
-
2026-06-17days on market $289,900 Active 219 DOM
-
2026-06-16days on market $289,900 Active 218 DOM
-
2026-06-15days on market $289,900 Active 217 DOM
-
2026-06-14days on market $289,900 Active 215 DOM
-
2026-06-12days on market $289,900 Active 214 DOM
-
2026-06-09days on market $289,900 Active 211 DOM
-
2026-06-08days on market $289,900 Active 210 DOM
-
2026-06-07days on market $289,900 Active 209 DOM
-
2026-06-07days on market $289,900 Active 208 DOM
-
2026-06-04days on market $289,900 Active 205 DOM
-
2026-06-02days on market $289,900 Active 204 DOM
-
2026-06-01days on market $289,900 Active 203 DOM
-
2026-05-31days on market $289,900 Active 202 DOM
-
2026-05-31days on market $289,900 Active 201 DOM
-
2026-05-07price $289,900 472-char remark
Show marketing remark (472 chars)
Beautiful Vista Villas with 2 bedrooms, den/optional bedroom with closet, and 2 baths. Kitchen offers custom cabinetry and granite counter tops. Windows and sliders have been updated throughout and patios are tiled and great for entertaining. Master bedroom has a sitting area and bath has dual vanities, soaking tub, separate shower, and large walk in closet. 2 car attached garage with separate laundry room. Complex amenities include pool, spa, tennis, and pickle ball.
-
2026-03-21price $299,900 472-char remark
Show marketing remark (472 chars)
Beautiful Vista Villas with 2 bedrooms, den/optional bedroom with closet, and 2 baths. Kitchen offers custom cabinetry and granite counter tops. Windows and sliders have been updated throughout and patios are tiled and great for entertaining. Master bedroom has a sitting area and bath has dual vanities, soaking tub, separate shower, and large walk in closet. 2 car attached garage with separate laundry room. Complex amenities include pool, spa, tennis, and pickle ball.
-
2025-11-10$310,000 Active 472-char remark
Show marketing remark (472 chars)
Beautiful Vista Villas with 2 bedrooms, den/optional bedroom with closet, and 2 baths. Kitchen offers custom cabinetry and granite counter tops. Windows and sliders have been updated throughout and patios are tiled and great for entertaining. Master bedroom has a sitting area and bath has dual vanities, soaking tub, separate shower, and large walk in closet. 2 car attached garage with separate laundry room. Complex amenities include pool, spa, tennis, and pickle ball.
-
2025-08-04historical
-
2025-02-19$329,000 Active
-
2018-04-01historical
-
2018-03-31historical
-
2017-12-07$255,000 Active
-
2017-12-07$255,000
-
2017-06-02historical
-
2017-06-01historical
-
2017-03-11$255,000 Active
-
2017-03-10$255,000
-
2007-03-23soldstatus $308,000
-
2007-02-15historical
-
2007-02-15historical
-
2006-11-27$329,000
-
2006-11-27$329,000
-
2004-04-27soldstatus $265,000
-
1988-06-29soldstatus $230,500
ⓘ Source: listings_history table (triggers on properties + properties_extension) + one-shot
backfill from property_details.listing_events for pre-trigger history.
Tax reassessment forecast CA · Resets to sale price
- Current annual tax
- $3,216 · $268/mo
- Projected year-2 tax
- $3,216 · $268/mo
- Expected delta
- $0/yr ($0/mo · 0.0%)
ⓘ Screening estimate from a state-policy table — verify with the county assessor before closing.
Climate risk First Street
- Flood 1/10 Low FEMA zone AO · 0% chance over 30 yrs
- Wildfire 4/10 Moderate
- Heat 9/10 Extreme 10 d/yr ≥112°F today · 28 d/yr by 30 yrs out
- Wind 1/10 Low
- Air quality 3/10 Moderate 3 unhealthy d/yr today · 4 by 30 yrs out
Nearby sold comps map
Loading sold comps map…
Walkable amenities ~0.75 mi
Loading nearby amenities…
Taxation est. · year 1
- Rental income
- $48,797
- − Mortgage interest
- −$16,239
- − Property taxes
- −$3,216
- − Insurance
- −$2,917
- − Repairs & maintenance
- −$3,904
- − Management
- −$3,904
- − HOA
- −$9,096
- − Depreciation
- −$8,433
- Taxable income
- $1,088
- Est. tax owed @ 24.0%
- −$261
- After-tax cash flow
- $4,816/yr
For passive investors: Depreciation is non-cash, so a rental often shows a tax loss while cash-flowing — sheltering income. Rental losses are passive: they offset passive income freely, and up to $25,000/yr can offset ordinary (W-2) income if you actively participate and your MAGI is under $100k (phasing out to $0 by $150k); unused losses carry forward. On sale, claimed depreciation is recaptured at up to 25%, and gains may owe capital-gains tax (a 1031 exchange can defer both). Figures are a year-1 estimate at your 24.0% rate — not tax advice; consult a CPA.
Schools (NCES district)
- District
- Borrego Springs Unified
- NCES district ID
- 0605700
- Math proficiency
- 20% ▼ -6.00%
- Reading proficiency
- 35% ▼ -6.00%
- Median HH income
- $42,330
- Composite
- 26.31/100
- National rank
- #12684
- State rank
- #1120 of 1400 in CA
Livability — Borrego Springs
- Score
- 58/100
- State rank
- #712
- US rank
- #21334
Category grades
Schools grade is shown separately in the Schools card above.
Census & demographics
- Census place
- Borrego Springs, CA
- Population (ZIP)
- 3,030
Population outlook (San Diego County) Hauer SSP2
- Today (2025)
- 3,678,185 people
- By 2030
- 3,856,546 · +4.8%
- By 2040
- 4,171,407 · +13.4%
- By 2050
- 4,421,607 · +20.2%
- By 2075
- 4,831,599 · +31.4%
- By 2100
- 4,832,502 · +31.4%
Race, ethnicity, and origin ACS 2023
- Neighborhood character
- Predominantly White (66%)
- Race & ethnicity
- White 66% Hispanic / Latino 33% Two or more races 24%
- Hispanic origin (detail)
- Mexican 29%
- Common ancestry
- Lithuanian 10% Slovak 5% Scotch-Irish 1%
- Foreign-born
- 27% · Canada
- Languages at home
- 70% English-only · Spanish 30%
Political lean MEDSL · San Diego
- 2024 margin
- D (+16.8) · D 56.9% · R 40.1% · Other 2.9%
- 2008→2024 swing
- +6.6pp toward D · 2008: 10.2pp · 2024: 16.8pp
- All cycles
- 2024: D+16.8 2020: D+22.8 2016: D+17.8 2012: D+5.1 2008: D+10.2
Not yet ingested
- Civics
- —
Market trends
- HPI YoY
- ▼ -50.39%
- Current HPI
- 222.8196
- Rent YoY
- —
- Metro
- —
- State GDP YoY
- ▲ 3.21%
- F500 in state
- 116
Industry mix (Fortune 500 HQ in CA)
| Industry | F500 HQs | Revenue |
|---|---|---|
| Technology | 27 | $1,492B |
|
||
| Financial Services | 3 | $174B |
|
||
| Retail | 3 | $44B |
|
||
| Insurance | 3 | $26B |
|
||
| Media / Entertainment | 2 | $115B |
|
||
| Pharmaceuticals / Biotech | 2 | $62B |
|
||
Price history
+25.8% since first listed20 events — show timeline
- 2026-05-07 Price Changed $289,900 CRMLS
- 2026-03-21 Price Changed $299,900 CRMLS
- 2025-11-10 Listed $310,000 CRMLS
- 2025-08-04 Listing Removed — CRMLS
- 2025-02-19 Listed $329,000 CRMLS
- 2018-04-01 Listing Removed — SDMLS
- 2018-03-31 Listing Removed — CRMLS
- 2017-12-07 Listed $255,000 CRMLS
- 2017-12-07 Listed $255,000 SDMLS
- 2017-06-02 Listing Removed — SDMLS
- 2017-06-01 Listing Removed — CRMLS
- 2017-03-11 Listed $255,000 SDMLS
- 2017-03-10 Listed $255,000 CRMLS
- 2007-03-23 Sold (Public Records) $308,000 Public Records
- 2007-02-15 Listing Removed — SDMLS
- 2007-02-15 Listing Removed — CRMLS
- 2006-11-27 Listed $329,000 SDMLS
- 2006-11-27 Listed $329,000 CRMLS
- 2004-04-27 Sold (Public Records) $265,000 Public Records
- 1988-06-29 Sold (Public Records) $230,500 Public Records
Property tax history
+0.0%/yrLatest (2025): $3,216 · +0.2% YoY. Source: county tax records.
Cash-flow waterfall
monthlySold comps — $/sqft
last 12 mo · ≤1 miLoading sold comps…