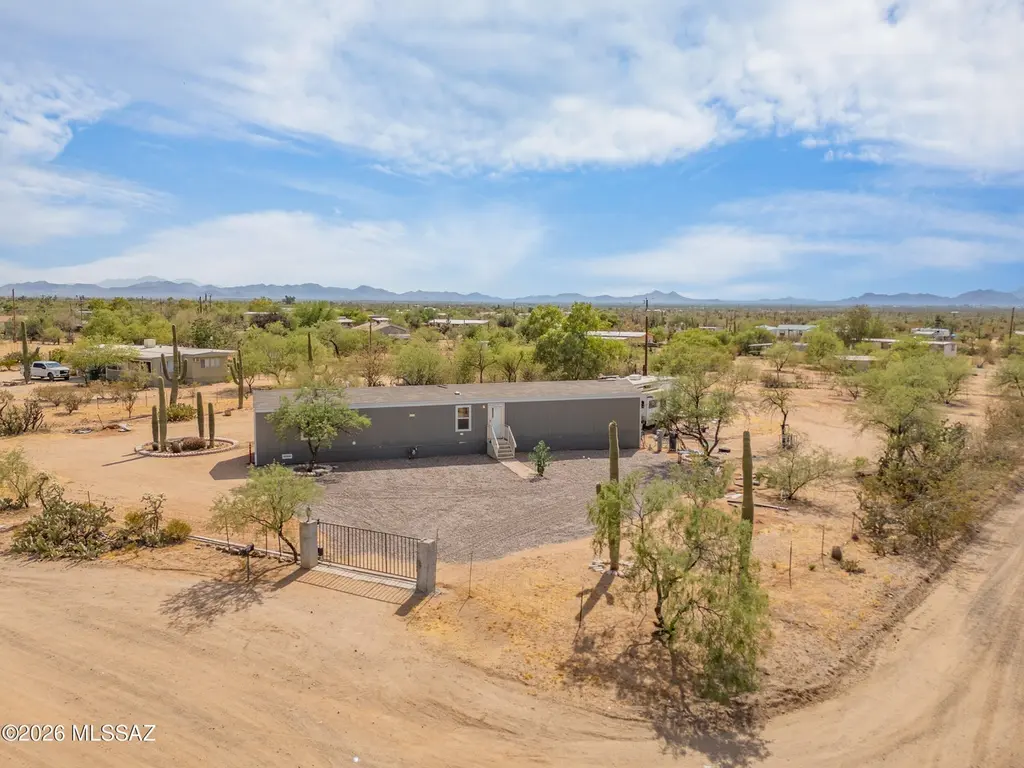
12505 W Bernice Ln · Picture Rocks, AZ
Flood risk 1/10 · Minimal
- FEMA flood zone
- X (unshaded)
- Chance of flooding over 30 yrs
- 0.0%
- Est. flood insurance / yr
- $507 – $1,088
Fire risk 5/10 · Moderate
- Est. fire insurance / yr
- $610 – $1,132
Heat risk 8/10 · Major
- Hot days now (above 109°F)
- 7 days/yr
- Hot days in 30 yrs
- 17 days/yr
Wind risk 1/10 · Minimal
- Chance of severe wind over 30 yrs
- —
Air-quality risk 1/10 · Minimal
- Unhealthy air days now
- 0 days/yr
- Unhealthy air days in 30 yrs
- 0 days/yr
Risk factors via First Street. Map © Google.
Why this score? — see what drove the D- grade
The composite is a weighted blend of 9 inputs, each scored 0–100. Each bar is that input's sub-score; the figure is the points it added to the 100-point composite (weight × sub-score).
- Cash flow +13.2/30.0
- DSCR +4.0/10.0
- 1% rule +3.7/10.0
- ARV discount +3.7/15.0
- Schools +3.1/10.0
- Livability +2.8/5.0
- Rent growth +2.6/5.0
- Condition / age +2.5/5.0
- Appreciation +0.0/10.0
$234,900
🖨 Deal sheet (PDF) 📄 Offer letter ✓ Due diligence
Listing remarks MLS
Lovely acre in Picture Rocks! Come and make it your own!
Key facts
- 1 acre lot
- Move in ready
- Mountain views
Tags
Property features AI
Finance
- Other: Zoned Pima County - SH
- HOA & community: Horses allowed
Exterior
- Utilities: Public water; Septic tank sewer
- Home design: Manufactured home; One story; Level (accessible)
- Construction: Frame and siding construction; Shingle roof; Built area approximately 1,083
- Exterior features: Chain link fencing; Corner lot; North/South exposure; Gravel road access (county maintained)
Interior
- Kitchen: Electric range; Electric cooktop; Electric oven; ENERGY STAR qualified dishwasher; ENERGY STAR qualified range
- Flooring: Vinyl flooring
- Bathrooms: 2 full bathrooms
- Heating & cooling: Forced air heating; Central air conditioning
- Interior features: ENERGY STAR qualified dishwasher; ENERGY STAR qualified range; Gas hookup available
- Laundry & utility: Laundry closet
Neighborhood map
What this means for you Summary
Snapshot
- This is a 4-bed/2.0-bath manufactured listed at $235k.
Deal economics
- At list price, monthly cash flow is $-4 ($-52/yr) — negative.
- To cash-flow at today's rent, offer at most $234k (0.3% below list).
- To meet the 1% rule (rent ≥ 1% of price), the offer needs to be $205k (12.8% below list).
- Recommended offer: $205k (12.8% below list) — sets the bar for 1% rule.
Location & tenants
- Location reads 55/100 on livability (#261 in AZ) — a working-class tenant base; expect higher turnover. Strengths: cost of living A+, housing A+; Watch: employment C-, crime D, amenities F.
- Marana Unified District (4404) (suburban): math 31% / reading 37% proficiency, ranked #83 of 249 in AZ (top 33%) — families likely to look elsewhere, expect single-tenant / working-renter base with shorter leases.
- Zoned schools: Picture Rocks Elementary (math 15% / reading 24%, grade F, #752 of 1,109 statewide, top 70%, 493 students, 67% FRL); Marana Middle School (math 24% / reading 30%, grade F, #97 of 218 statewide, top 45%, 907 students, 44% FRL); Marana High School (math 21% / reading 24%, grade F, #210 of 381 statewide, top 55%, 2,379 students, 36% FRL).
- Market conditions: Rents flat; 236 active listings in the ZIP; solid renter incomes; 5,268 units permitted in Pima County in 2024 (996 in 5+ unit buildings).
Forward outlook
- Local home prices are declining (-3.0%/yr); year-one equity from $2k of loan paydown is wiped out by about $7k of value loss. Plan a longer hold.
- Pima County population projected at +8% by 2050 — modest demand growth; plan on rents tracking national, not racing it.
Negotiation context
- It's been on market 34 days — a 3% lower offer ($228k) is reasonable based on typical stale-listing flexibility.
- 2 sale attempts since 9y ago with the ask held roughly flat each time — persistent listings suggest the price (not the market) is what's stuck; bring a comps-based counter.
- Current owner paid $25k; list at $235k implies a 840% gain — meaningful room to come down on a strong offer.
Risks & watch-outs
- Climate carrying-cost: moderate wildfire risk; extreme-heat days projected 7→17/yr by 2055 (HVAC capex compounding) — expect insurance premiums to compound above CPI over the hold.
Questions for the listing agent
- What do current leases actually rent for vs. the listed asking? Can we see a recent rent roll and the last 12 months of T-12 income?
- It's been on market 34 days. Have you received any prior offers? Is the seller open to a 13% concession, seller financing, or rate buy-down credit?
- Is there a deadline driving the sale (1031 exchange, divorce, estate, relocation)? That informs how much negotiation room exists.
- Schools are F-rated, which usually means shorter tenancies and higher turnover. Who's the typical renter profile here, and what's been the actual vacancy rate?
- Crime grade is D in this area — have there been break-ins, vandalism, or insurance claims at this property in the last 3 years? What carrier currently insures it and at what premium?
- The area grade is low — what's the realistic commute time and amenity access for the typical tenant pool here? Any planned neighborhood developments (good or bad) we should know about?
- What's the average days-on-market for RENTAL listings here right now (not sales)? A rising rental-DOM trend means longer vacancies and softer asking-rent achievability than the comps imply.
- What's the recent tenant-quality profile in this submarket — average credit score on applications, eviction rate, late-payment / NSF rate, and stable-employment percentage? A property-management company in the area should have these aggregated.
- How much new for-sale + rental construction is in the pipeline within 1–3 miles? Heavy new supply typically softens prices + rents 12–24 months out; constrained supply supports both.
Investment metrics
- 1% rule
- 0.87% ✗
- Cap rate
- 6.27%
- Cash-on-cash
- -0.08%
- DSCR
- 1.00
- GRM
- 9.6
CMA / ARV
- ARV (on-the-fly)
- $216,600
- Comps found
- 2
Show comp detail 2 sales within ~0.75 mi
| Address | Dist | Beds/Ba | Sqft | Sold | Price | $/sf | Match |
|---|---|---|---|---|---|---|---|
| 6240 N Sundown Rd | 0.46mi | 3/2.0 (-1) | 1,203 (+11%) | 3mo | $240,000 | $200 | 53 |
| 6270 N Sundown Rd | 0.46mi | 3/2.0 (-1) | 1,232 (+14%) | 6mo | $230,000 | $187 | 46 |
Match score weights: distance 35% · size 25% · config 20% · recency 20%. Top-matched comps best support the ARV.
Projected returns pro-forma
-3.0% appreciation · 0.47% rent growth · sell at horizon
- IRR
- -19.3%
- Equity multiple
- 0.34×
- Total profit
- $-43,396
- Equity at exit
- $35,024
- IRR
- -18.3%
- Equity multiple
- 0.12×
- Total profit
- $-57,865
- Equity at exit
- $20,310
Cash invested: $65,772 (down + closing). Projections, not guarantees.
Landlord ↔ Tenant lean methodology
- Overall (STATE)
- 87 Strongly Landlord-Friendly
- State Arizona
- 87 Strongly Landlord-Friendly · R+3
- County
- — inherits STATE
- City
- — inherits STATE
ZIP-level market 85743
- Home prices YoY
- -26.1%
- Rents YoY
- 0.5%
- Active inventory
- 236
- Price-to-rent
- 9.6×
Monthly cashflow live
- Estimated rent
- $2,049 medium interval (Pro) →
- Mortgage (P&I)
- −$1,232
- Tax est. 1.5%
- −$294 /mo · $3,524/yr
- Insurance
- −$98
- HOA
- −$0
- Vacancy / Maint / Mgmt
- −$430
- Net cashflow
- $-4
Break-even live
Sensitivity live
| Price | -10% $158 | -5% $77 | +0% $-4 | +5% $-85 | +10% $-167 |
|---|---|---|---|---|---|
| Rent | -10% $-166 | -5% $-85 | +0% $-4 | +5% $77 | +10% $158 |
| Rate | -1.0pp $114 | -0.5pp $55 | base $-4 | +0.5pp $-65 | +1.0pp $-127 |
UW: 25.0% down · 7.5% · 30yr · 1.5% tax · 5.0% vac · 8.0% maint · 8.0% mgmt
Financing live
Cash to close
- Down payment
- $58,725
- Closing costs
- $7,047
- Reserves months
- —
- Total cash needed
- —
Loan-product check · same deal, 3 products live
Conventional
25% down · 7.5% · 30yr
- Down + closing
- —
- Monthly P&I
- —
- Monthly cashflow
- —
- DSCR
- —
- Eligible?
- —
Personal DTI + credit; lowest rate.
DSCR
20% down · 8.5% · 30yr
- Down + closing
- —
- Monthly P&I
- —
- Monthly cashflow
- —
- DSCR
- —
- Eligible?
- —
No personal income docs; deal must DSCR.
Hard money
10% down · 12.0% · 12mo
- Down + closing
- —
- Monthly P&I
- —
- Monthly cashflow
- —
- DSCR
- —
- Eligible?
- —
Short-term bridge; refi at stabilization.
Listing history 22 events
-
2026-06-21days on market $234,900 Active 34 DOM
-
2026-06-18days on market $234,900 Active 31 DOM
-
2026-06-17days on market $234,900 Active 30 DOM
-
2026-06-16days on market $234,900 Active 29 DOM
-
2026-06-15days on market $234,900 Active 28 DOM
-
2026-06-13days on market $234,900 Active 26 DOM
-
2026-06-13days on market $234,900 Active 25 DOM
-
2026-06-10days on market $234,900 Active 23 DOM
-
2026-06-09days on market $234,900 Active 22 DOM
-
2026-06-08days on market $234,900 Active 21 DOM
-
2026-06-07days on market $234,900 Active 20 DOM
-
2026-06-05days on market $234,900 Active 17 DOM
-
2026-06-03days on market $234,900 Active 16 DOM
-
2026-06-02days on market $234,900 Active 15 DOM
-
2026-06-01days on market $234,900 Active 14 DOM
-
2026-05-31days on market $234,900 Active 13 DOM
-
2026-05-18$234,900 Active
-
2017-05-03soldstatus $25,000 Closed 57-char remark
Show marketing remark (57 chars)
Lovely acre in Picture Rocks! Come and make it your own!
-
2017-04-28status Pending 57-char remark
Show marketing remark (57 chars)
Lovely acre in Picture Rocks! Come and make it your own!
-
2017-03-26historical Active Contingent 57-char remark
Show marketing remark (57 chars)
Lovely acre in Picture Rocks! Come and make it your own!
-
2017-03-05price $25,900 57-char remark
Show marketing remark (57 chars)
Lovely acre in Picture Rocks! Come and make it your own!
-
2017-02-15$29,900 Active 57-char remark
Show marketing remark (57 chars)
Lovely acre in Picture Rocks! Come and make it your own!
ⓘ Source: listings_history table (triggers on properties + properties_extension) + one-shot
backfill from property_details.listing_events for pre-trigger history.
Climate risk First Street
- Flood 1/10 Low FEMA zone X (unshaded) · 0% chance over 30 yrs
- Wildfire 5/10 Major
- Heat 8/10 Severe 7 d/yr ≥109°F today · 17 d/yr by 30 yrs out
- Wind 1/10 Low
- Air quality 1/10 Low 0 unhealthy d/yr today · 0 by 30 yrs out
Nearby sold comps map
Loading sold comps map…
Walkable amenities ~0.75 mi
Loading nearby amenities…
Taxation est. · year 1
- Rental income
- $24,593
- − Mortgage interest
- −$13,158
- − Property taxes
- −$3,524
- − Insurance
- −$1,174
- − Repairs & maintenance
- −$1,967
- − Management
- −$1,967
- − Depreciation
- −$6,833
- Taxable loss
- −$4,031
- Est. tax savings @ 24.0%
- +$968
- After-tax cash flow
- $916/yr
For passive investors: Depreciation is non-cash, so a rental often shows a tax loss while cash-flowing — sheltering income. Rental losses are passive: they offset passive income freely, and up to $25,000/yr can offset ordinary (W-2) income if you actively participate and your MAGI is under $100k (phasing out to $0 by $150k); unused losses carry forward. On sale, claimed depreciation is recaptured at up to 25%, and gains may owe capital-gains tax (a 1031 exchange can defer both). Figures are a year-1 estimate at your 24.0% rate — not tax advice; consult a CPA.
Schools (NCES district)
- District
- Marana Unified District (4404)
- NCES district ID
- 0404630
- Math proficiency
- 31% ▼ -11.00%
- Reading proficiency
- 37% ▼ -5.00%
- Median HH income
- $65,282
- Composite
- 30.96/100
- National rank
- #6103
- State rank
- #83 of 249 in AZ
Livability — Picture Rocks
- Score
- 55/100
- State rank
- #261
- US rank
- #23370
Category grades
Schools grade is shown separately in the Schools card above.
Census & demographics
- Census place
- Picture Rocks, AZ
- County
- Pima County · 1,012,107 people
- Metro
- Tucson, AZ
- Population (ZIP)
- 31,300
- Household income
- $90,093
- Rent vs Own
- Severe rent burden
- 378.0
Population outlook (Pima County) Hauer SSP2
- Today (2025)
- 1,066,056 people
- By 2030
- 1,086,684 · +1.9%
- By 2040
- 1,117,160 · +4.8%
- By 2050
- 1,149,778 · +7.9%
- By 2075
- 1,271,480 · +19.3%
- By 2100
- 1,321,160 · +23.9%
Race, ethnicity, and origin ACS 2023
- Neighborhood character
- Majority White (63%)
- Race & ethnicity
- White 63% Hispanic / Latino 25% Two or more races 15% Asian 5% Black 2%
- Hispanic origin (detail)
- Mexican 21%
- Common ancestry
- Romanian 3% Lithuanian 2% Slovak 2%
- Foreign-born
- 9% · Canada, China, Vietnam
- Languages at home
- 85% English-only · Spanish 9% Chinese 1% Tagalog/Filipino 1%
Political lean MEDSL · Pima
- 2024 margin
- D (+15.2) · D 57.0% · R 41.8% · Other 1.2%
- 2008→2024 swing
- +9.1pp toward D · 2008: 6.1pp · 2024: 15.2pp
- All cycles
- 2024: D+15.2 2020: D+18.7 2016: D+13.5 2012: D+5.8 2008: D+6.1
Not yet ingested
- Civics
- —
Market trends
- HPI YoY
- ▼ -95.76%
- Current HPI
- 271.2845
- Rent YoY
- ▲ 0.47%
- Metro
- Tucson, AZ
- State GDP YoY
- ▲ 4.54%
- F500 in state
- 20
Industry mix (Fortune 500 HQ in AZ)
| Industry | F500 HQs | Revenue |
|---|---|---|
| Technology | 2 | $13B |
|
||
| Mining / Metals | 1 | $23B |
|
||
| Environmental Services | 1 | $16B |
|
||
| Metals / Steel | 1 | $14B |
|
||
| Technology Distribution | 1 | $9B |
|
||
| Homebuilding | 1 | $8B |
|
||
Price history
+685.6% since first listed6 events — show timeline
- 2026-05-18 Listed $234,900 MLSSAZ
- 2017-05-03 Sold (MLS) $25,000 MLSSAZ
- 2017-04-28 Pending — MLSSAZ
- 2017-03-26 Contingent — MLSSAZ
- 2017-03-05 Price Changed $25,900 MLSSAZ
- 2017-02-15 Listed $29,900 MLSSAZ
Property tax history
-2.5%/yrLatest (2018): $390 · -3.4% YoY. Source: county tax records.
Cash-flow waterfall
monthlySold comps — $/sqft
last 12 mo · ≤1 miLoading sold comps…