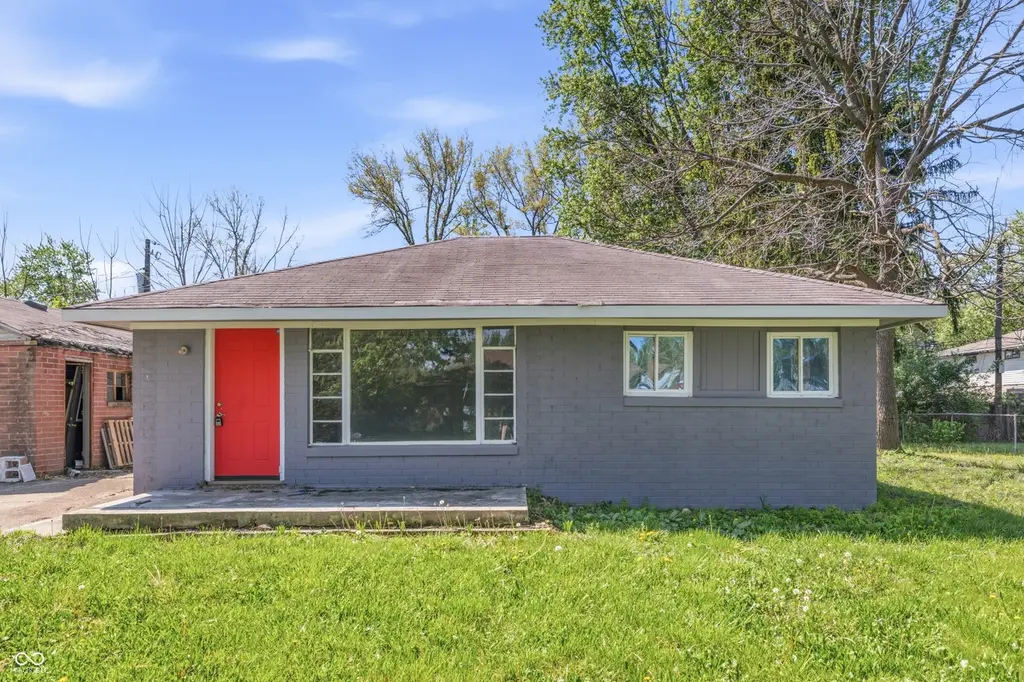
3401 W 31st St · Muncie, IN
Flood risk 1/10 · Minimal
- FEMA flood zone
- X (unshaded)
- Chance of flooding over 30 yrs
- 0.0%
- Est. flood insurance / yr
- $507 – $1,088
Fire risk 1/10 · Minimal
- Est. fire insurance / yr
- $717 – $1,331
Heat risk 3/10 · Minor
- Hot days now (above 100°F)
- 7 days/yr
- Hot days in 30 yrs
- 18 days/yr
Wind risk 2/10 · Minimal
- Chance of severe wind over 30 yrs
- 1.0%
Air-quality risk 3/10 · Minor
- Unhealthy air days now
- 2 days/yr
- Unhealthy air days in 30 yrs
- 3 days/yr
Risk factors via First Street. Map © Google.
Why this score? — see what drove the C+ grade
The composite is a weighted blend of 9 inputs, each scored 0–100. Each bar is that input's sub-score; the figure is the points it added to the 100-point composite (weight × sub-score).
- Cash flow +30.0/30.0
- DSCR +10.0/10.0
- 1% rule +7.7/10.0
- ARV discount +4.8/15.0
- Rent growth +4.0/5.0
- Livability +4.0/5.0
- Condition / age +2.5/5.0
- Schools +1.7/10.0
- Appreciation +0.0/10.0
$69,900
🖨 Deal sheet (PDF) 📄 Offer letter ✓ Due diligence
Listing remarks
3401 W 31st ST, MUNCIE, IN, USA, is a single-family residence. This home stands ready for immediate occupancy. This residence features two well-proportioned bedrooms, providing comfortable private accommodations. Complementing these spaces is a full bathroom, designed for both convenience and utility. Encompassing an expansive lot, this single-story property offers considerable outdoor potential, complementing its interior living spaces. We invite you to schedule a private viewing to fully appreciate the distinctive qualities of this property.
Key facts
- Expansive lot
- 0.25 acre lot
- 2 garage spots
Tags
Property features AI
Exterior
- Parking: Detached 2-car garage (about 432 sq ft)
- Utilities: Public water; Municipal sewer connected; 100-amp electric service
- Home design: Single-family residence; One story
- Construction: Brick construction; Crawl space foundation
- Exterior features: Patio; Approximately 0.25-acre lot
Interior
- Kitchen: Kitchen (approximately 11x10)
- Bedrooms: Two bedrooms on the main level (sizes include a 10x8 bedroom and a 10x9 room)
- Bathrooms: One full bathroom with a tub and shower
- Heating & cooling: Forced air heating; Natural gas heating; No central air
- Interior features: Attic access; Five main-level rooms
- Laundry & utility: Main-level laundry (approx. 4x6)
Neighborhood map
What this means for you Summary
Snapshot
- This is a 2-bed/1.0-bath single-family listed at $70k.
Deal economics
- At list price, monthly cash flow is $271 ($3k/yr) — positive.
- The deal already cash-flows at list — no discount required.
- Meets the 1% rule at list price ($887 rent vs $70k).
- Recommended offer: $68k (3.0% below list) — sets the bar for market timing.
- Cap rate 10.9% vs local median 6.0% in Muncie — top-decile yield for the area; either an underpriced asset or a hidden risk that comps aren't pricing in. Stress-test before assuming the spread holds.
Location & tenants
- Location reads 80/100 on livability (#18 in IN, #1,654 nationally) — a professional / high-income tenant draw. Strengths: amenities A+, commute A+, cost of living A+; Watch: schools D+, crime F, employment F.
- Muncie Community Schools (urban): math 18% / reading 25% proficiency, ranked #275 of 301 in IN (top 91%) — low school quality limits family demand, transient renter base, plan for 1-2y turnover; 68% free/reduced lunch — lower-income household profile, screen leases tightly.
- Market conditions: Rents rising fast (+6.1%/yr); 148 active listings in the ZIP; 1 comparable units currently listed for rent nearby; 171 units permitted in Delaware County in 2024 (57 in 5+ unit buildings).
Forward outlook
- Local home prices are declining (-3.0%/yr); year-one equity from $483 of loan paydown is wiped out by about $2k of value loss. Plan a longer hold.
- Delaware County population projected at -11% by 2050 — secular population decline; favor cash flow + early exit over multi-decade hold.
- At projected returns (-3.0% appreciation + 6.1% rent growth), your $20k cash investment doubles in ~7 years — after that, you're playing with house money.
Negotiation context
- It's been on market 56 days — a 3% lower offer ($68k) is reasonable based on typical stale-listing flexibility.
- 3 sale attempts; this cycle's ask has dropped $10k (13%) from the opening price — seller is motivated, your offer sets the floor, not the list.
Risks & watch-outs
- Watch-outs: built in 1955 — expect roof / HVAC / electrical / plumbing capex.
Questions for the listing agent
- It's been on market 56 days. Have you received any prior offers? Is the seller open to a 3% concession, seller financing, or rate buy-down credit?
- Built in 1955 — when were the roof, HVAC, electrical panel, plumbing, and water heater last replaced?
- Is there a deadline driving the sale (1031 exchange, divorce, estate, relocation)? That informs how much negotiation room exists.
- Schools are D-rated, which usually means shorter tenancies and higher turnover. Who's the typical renter profile here, and what's been the actual vacancy rate?
- Crime grade is F in this area — have there been break-ins, vandalism, or insurance claims at this property in the last 3 years? What carrier currently insures it and at what premium?
- What's the average days-on-market for RENTAL listings here right now (not sales)? A rising rental-DOM trend means longer vacancies and softer asking-rent achievability than the comps imply.
- What's the recent tenant-quality profile in this submarket — average credit score on applications, eviction rate, late-payment / NSF rate, and stable-employment percentage? A property-management company in the area should have these aggregated.
- How much new for-sale + rental construction is in the pipeline within 1–3 miles? Heavy new supply typically softens prices + rents 12–24 months out; constrained supply supports both.
Investment metrics
- 1% rule
- 1.27% ✓
- Cap rate
- 10.95%
- Cash-on-cash
- 16.63%
- DSCR
- 1.74
- GRM
- 6.6
CMA / ARV
- ARV (median comp)
- $65,895
- List price
- $69,900
- Delta
- 6.08%
- Verdict
- FAIR
- Comps
- 14 within 1.0 mi
Show comp detail 2 sales within ~0.75 mi
| Address | Dist | Beds/Ba | Sqft | Sold | Price | $/sf | Match |
|---|---|---|---|---|---|---|---|
| 3404 W 29th St | 0.14mi | 2/1.0 | 784 (-6%) | 2mo | $93,000 | $119 | 82 |
| 3408 S Willoughby St | 0.23mi | 2/1.0 | 716 (-14%) | 23mo | $55,000 | $77 | 46 |
Match score weights: distance 35% · size 25% · config 20% · recency 20%. Top-matched comps best support the ARV.
Projected returns pro-forma
-3.0% appreciation · 6.11% rent growth · sell at horizon
- IRR
- 11.0%
- Equity multiple
- 1.45×
- Total profit
- $8,784
- Equity at exit
- $10,422
- IRR
- 22.2%
- Equity multiple
- 3.16×
- Total profit
- $42,321
- Equity at exit
- $6,044
Cash invested: $19,572 (down + closing). Projections, not guarantees.
Landlord ↔ Tenant lean methodology
- Overall (STATE)
- 90 Strongly Landlord-Friendly
- State Indiana
- 90 Strongly Landlord-Friendly · R+11
- County
- — inherits STATE
- City
- — inherits STATE
ZIP-level market 47302
- Home prices YoY
- -12.6%
- Rents YoY
- 6.1%
- Active inventory
- 148
- Price-to-rent
- 6.6×
Monthly cashflow live
- Estimated rent
- $887 medium interval (Pro) →
- Mortgage (P&I)
- −$367
- Tax from tax record
- −$34 /mo · $403/yr
- Insurance
- −$29
- HOA
- −$0
- Vacancy / Maint / Mgmt
- −$186
- Net cashflow
- $271
Break-even live
Sensitivity live
| Price | -10% $311 | -5% $291 | +0% $271 | +5% $251 | +10% $232 |
|---|---|---|---|---|---|
| Rent | -10% $201 | -5% $236 | +0% $271 | +5% $306 | +10% $341 |
| Rate | -1.0pp $306 | -0.5pp $289 | base $271 | +0.5pp $253 | +1.0pp $235 |
UW: 25.0% down · 7.5% · 30yr · 1.5% tax · 5.0% vac · 8.0% maint · 8.0% mgmt
Financing live
Cash to close
- Down payment
- $17,475
- Closing costs
- $2,097
- Reserves months
- —
- Total cash needed
- —
Loan-product check · same deal, 3 products live
Conventional
25% down · 7.5% · 30yr
- Down + closing
- —
- Monthly P&I
- —
- Monthly cashflow
- —
- DSCR
- —
- Eligible?
- —
Personal DTI + credit; lowest rate.
DSCR
20% down · 8.5% · 30yr
- Down + closing
- —
- Monthly P&I
- —
- Monthly cashflow
- —
- DSCR
- —
- Eligible?
- —
No personal income docs; deal must DSCR.
Hard money
10% down · 12.0% · 12mo
- Down + closing
- —
- Monthly P&I
- —
- Monthly cashflow
- —
- DSCR
- —
- Eligible?
- —
Short-term bridge; refi at stabilization.
Rent comps 1 comps
| Address | Beds | Baths | Sqft | Rent | $/sqft | DOM | Units | Dist |
|---|---|---|---|---|---|---|---|---|
| 2600 W Memorial Dr Muncie, IN | 1.0 | 1.0 | 525 | $705 | $1.34 | 45d | 8 | 1.42mi |
Listing history 27 events
-
2026-06-19days on market $69,900 Active 56 DOM
-
2026-06-18days on market $69,900 Active 55 DOM
-
2026-06-17price $69,900 Active 54 DOM
-
2026-06-17days on market $79,900 Active 54 DOM
-
2026-06-16days on market $79,900 Active 53 DOM
-
2026-06-15days on market $79,900 Active 52 DOM
-
2026-06-14days on market $79,900 Active 50 DOM
-
2026-06-13days on market $79,900 Active 49 DOM
-
2026-06-10days on market $79,900 Active 47 DOM
-
2026-06-09days on market $79,900 Active 46 DOM
-
2026-06-08days on market $79,900 Active 45 DOM
-
2026-06-07days on market $79,900 Active 44 DOM
-
2026-06-05days on market $79,900 Active 41 DOM
-
2026-06-03days on market $79,900 Active 40 DOM
-
2026-06-02days on market $79,900 Active 39 DOM
-
2026-06-01days on market $79,900 Active 38 DOM
-
2026-05-31days on market $79,900 Active 37 DOM
-
2026-05-30days on market $79,900 Active 36 DOM
-
2026-04-24$79,900 Active 550-char remark
-
2026-01-20status Pending
-
2026-01-10historical
-
2025-12-15status Active
-
2025-11-04status Pending
-
2025-10-31price $45,000
-
2025-10-13price $55,000
-
2025-10-01price $65,000
-
2025-09-20$70,000 Active
ⓘ Source: listings_history table (triggers on properties + properties_extension) + one-shot
backfill from property_details.listing_events for pre-trigger history.
Tax reassessment forecast IN · Partial reset (capped growth)
- Current annual tax
- $403 · $34/mo
- Projected year-2 tax
- $498 · $42/mo
- Expected delta
- +$96/yr (+$8/mo · 23.8%)
ⓘ Screening estimate from a state-policy table — verify with the county assessor before closing.
Climate risk First Street
- Flood 1/10 Low FEMA zone X (unshaded) · 0% chance over 30 yrs
- Wildfire 1/10 Low
- Heat 3/10 Moderate 7 d/yr ≥100°F today · 18 d/yr by 30 yrs out
- Wind 2/10 Low 100% chance of damaging wind over 30 yrs
- Air quality 3/10 Moderate 2 unhealthy d/yr today · 3 by 30 yrs out
Nearby sold comps map
Loading sold comps map…
Walkable amenities ~0.75 mi
Loading nearby amenities…
Taxation est. · year 1
- Rental income
- $10,639
- − Mortgage interest
- −$3,915
- − Property taxes
- −$403
- − Insurance
- −$350
- − Repairs & maintenance
- −$851
- − Management
- −$851
- − Depreciation
- −$2,033
- Taxable income
- $2,236
- Est. tax owed @ 24.0%
- −$537
- After-tax cash flow
- $2,717/yr
For passive investors: Depreciation is non-cash, so a rental often shows a tax loss while cash-flowing — sheltering income. Rental losses are passive: they offset passive income freely, and up to $25,000/yr can offset ordinary (W-2) income if you actively participate and your MAGI is under $100k (phasing out to $0 by $150k); unused losses carry forward. On sale, claimed depreciation is recaptured at up to 25%, and gains may owe capital-gains tax (a 1031 exchange can defer both). Figures are a year-1 estimate at your 24.0% rate — not tax advice; consult a CPA.
Schools (NCES district)
- District
- Muncie Community Schools
- NCES district ID
- 1807320
- Math proficiency
- 18% ▼ -9.00%
- Reading proficiency
- 25% ▼ -4.00%
- Median HH income
- $30,052
- Composite
- 17.22/100
- National rank
- #9099
- State rank
- #275 of 301 in IN
Livability — Muncie
- Score
- 80/100
- State rank
- #18
- US rank
- #1654
Category grades
Schools grade is shown separately in the Schools card above.
Census & demographics
- County
- Delaware County · 84,658 people
- City population
- 84,658
- Metro
- Muncie, IN
- Population (ZIP)
- 25,473
- Household income
- $47,837
- Rent vs Own
- Severe rent burden
- 1150.0
Population outlook (Delaware County) Hauer SSP2
- Today (2025)
- 113,036 people
- By 2030
- 111,313 · -1.5%
- By 2040
- 106,432 · -5.8%
- By 2050
- 100,747 · -10.9%
- By 2075
- 91,000 · -19.5%
- By 2100
- 80,687 · -28.6%
Race, ethnicity, and origin ACS 2023
- Neighborhood character
- Predominantly White (84%)
- Race & ethnicity
- White 84% Two or more races 6% Black 6% Hispanic / Latino 4%
- Common ancestry
- Italian 2% Slovak 1% Romanian 1%
- Foreign-born
- 1% · Canada
- Languages at home
- 98% English-only · Spanish 1% German/W. Germanic 1%
Political lean MEDSL · Delaware
- 2024 margin
- R (+15.8) · D 41.2% · R 57.0% · Other 1.8%
- 2008→2024 swing
- -30.8pp toward R · 2008: 15.0pp · 2024: -15.8pp
- All cycles
- 2024: R+15.8 2020: R+13.2 2016: R+13.7 2012: D+3.1 2008: D+15.0
Not yet ingested
- Civics
- —
Market trends
- HPI YoY
- ▼ -30.32%
- Current HPI
- 210.431
- Rent YoY
- ▲ 6.11%
- Metro
- Muncie, IN
- State GDP YoY
- ▲ 2.90%
- F500 in state
- 18
Industry mix (Fortune 500 HQ in IN)
| Industry | F500 HQs | Revenue |
|---|---|---|
| Industrial Machinery | 2 | $37B |
|
||
| Healthcare | 1 | $177B |
|
||
| Pharmaceuticals | 1 | $45B |
|
||
| Metals / Steel | 1 | $18B |
|
||
| Agriculture | 1 | $17B |
|
||
| Packaging | 1 | $12B |
|
||
Price history
-0.1% since first listed10 events — show timeline
- 2026-06-17 Price Changed $69,900 MIBOR as Distributed by MLS Grid
- 2026-04-24 Listed $79,900 MIBOR as Distributed by MLS Grid
- 2026-01-20 Pending — MIBOR as Distributed by MLS Grid
- 2026-01-10 Listing Removed — MIBOR as Distributed by MLS Grid
- 2025-12-15 Relisted — MIBOR as Distributed by MLS Grid
- 2025-11-04 Pending — MIBOR as Distributed by MLS Grid
- 2025-10-31 Price Changed $45,000 MIBOR as Distributed by MLS Grid
- 2025-10-13 Price Changed $55,000 MIBOR as Distributed by MLS Grid
- 2025-10-01 Price Changed $65,000 MIBOR as Distributed by MLS Grid
- 2025-09-20 Listed $70,000 MIBOR as Distributed by MLS Grid
Property tax history
-8.2%/yrLatest (2024): $403 · -44.9% YoY. Source: county tax records.
Cash-flow waterfall
monthlySold comps — $/sqft
last 12 mo · ≤1 miLoading sold comps…