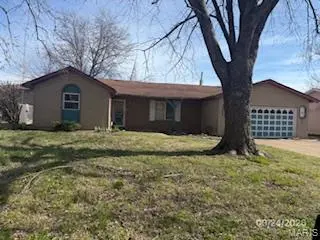
1215 Julie Ave · Cahokia Heights, IL
Flood risk 1/10 · Minimal
- FEMA flood zone
- X (shaded)
- Chance of flooding over 30 yrs
- 0.0%
- Est. flood insurance / yr
- $507 – $1,088
Fire risk 1/10 · Minimal
- Est. fire insurance / yr
- $804 – $1,492
Heat risk 6/10 · Moderate
- Hot days now (above 107°F)
- 7 days/yr
- Hot days in 30 yrs
- 21 days/yr
Wind risk 2/10 · Minimal
- Chance of severe wind over 30 yrs
- 1.0%
Air-quality risk 3/10 · Minor
- Unhealthy air days now
- 3 days/yr
- Unhealthy air days in 30 yrs
- 4 days/yr
Risk factors via First Street. Map © Google.
Why this score? — see what drove the B grade
The composite is a weighted blend of 9 inputs, each scored 0–100. Each bar is that input's sub-score; the figure is the points it added to the 100-point composite (weight × sub-score).
- Cash flow +30.0/30.0
- ARV discount +15.0/15.0
- 1% rule +10.0/10.0
- DSCR +10.0/10.0
- Rent growth +2.5/5.0
- Livability +2.5/5.0
- Condition / age +2.5/5.0
- Schools +0.6/10.0
- Appreciation +0.0/10.0
$70,000
🖨 Deal sheet (PDF) 📄 Offer letter ✓ Due diligence
Listing remarks MLS
Investor opportunity in Cahokia Heights! This bank-owned property at 1215 Julie Ave offers great potential for the right buyer looking to renovate and add value. With approximately 1,447 square feet of living space, this home features 3 bedrooms, 2 bathrooms, and a sunroom, along with a 2-car attached garage. The property is not move-in ready and will require repairs, making it ideal for investors or buyers seeking a project. There is no basement. Situated in the Cahokia Unit School District 187, this home includes a large backyard with a chain-link fence—perfect for pets or outdoor use—as well as a small storage shed for extra storage. The front yard is spacious and open with no fence, offering a variety of landscaping possibilities. Conveniently located just minutes from the interstate, this home provides easy access for commuting and travel. Property is being sold as-is. Buyer to verify all information and inquire about any required inspections.
Key facts
- 8,712 sq ft lot
- 2 garage spots
- Built 1978
Neighborhood map
What this means for you Summary
Snapshot
- This is a 3-bed/3.0-bath single-family listed at $70k.
Deal economics
- At list price, monthly cash flow is $673 ($8k/yr) — positive.
- The deal already cash-flows at list — no discount required.
- Meets the 1% rule at list price ($1k rent vs $70k).
- Recommended offer: $66k (6.0% below list) — sets the bar for market timing.
- Cap rate 17.8% vs local median 13.3% in Cahokia Heights — top-decile yield for the area; either an underpriced asset or a hidden risk that comps aren't pricing in. Stress-test before assuming the spread holds.
Location & tenants
- Location reads: area grade B — affects rentability + tenant quality, not the cash-flow math above.
- Cahokia CUSD 187 (suburban): math 3% / reading 5% proficiency, ranked #864 of 919 in IL (top 94%) — low school quality limits family demand, transient renter base, plan for 1-2y turnover; 85% free/reduced lunch — lower-income household profile, screen leases tightly.
- Market conditions: 152 active listings in the ZIP; 30 comparable units currently listed for rent nearby; rentals at typical pace (median 25d on market — plan ~3-4 weeks tenant-placement turnaround); 47% of comp listings sitting > 30 days — soft ceiling on asking rent; lower-income renter base — watch delinquency; 783 units permitted in St. Clair County in 2024 (378 in 5+ unit buildings).
- At $1,465/mo this rent would consume 52% of the median local household income ($34k/yr) (locally 729% of renters already pay >50% of income on rent) — very limited rent-growth headroom before tenants either downsize or default.
Forward outlook
- Local home prices are declining (-3.0%/yr); year-one equity from $484 of loan paydown is wiped out by about $2k of value loss. Plan a longer hold.
- St. Clair County population projected at -23% by 2050 — secular population decline; favor cash flow + early exit over multi-decade hold.
- At projected returns (-3.0% appreciation + 3.0% rent growth), your $20k cash investment doubles in ~3 years — after that, you're playing with house money.
Negotiation context
- It's been on market 84 days — a 6% lower offer ($66k) is reasonable based on typical stale-listing flexibility.
Risks & watch-outs
- Climate carrying-cost: extreme-heat days projected 7→21/yr by 2055 (HVAC capex compounding) — expect insurance premiums to compound above CPI over the hold.
Questions for the listing agent
- It's been on market 84 days. Have you received any prior offers? Is the seller open to a 6% concession, seller financing, or rate buy-down credit?
- Built in 1978 — when were the roof, HVAC, electrical panel, plumbing, and water heater last replaced?
- Why hasn't it sold? Are there any deal-killer items the seller is aware of (foundation, flood, title, zoning, code violations)?
- Is there a deadline driving the sale (1031 exchange, divorce, estate, relocation)? That informs how much negotiation room exists.
- What's the average days-on-market for RENTAL listings here right now (not sales)? A rising rental-DOM trend means longer vacancies and softer asking-rent achievability than the comps imply.
- What's the recent tenant-quality profile in this submarket — average credit score on applications, eviction rate, late-payment / NSF rate, and stable-employment percentage? A property-management company in the area should have these aggregated.
- How much new for-sale + rental construction is in the pipeline within 1–3 miles? Heavy new supply typically softens prices + rents 12–24 months out; constrained supply supports both.
Investment metrics
- 1% rule
- 2.09% ✓
- Cap rate
- 17.84%
- Cash-on-cash
- 41.23%
- DSCR
- 2.83
- GRM
- 4.0
CMA / ARV
- ARV (median comp)
- $97,154
- List price
- $70,000
- Delta
- -27.95%
- Verdict
- UNDERPRICED
- Comps
- 20 within 1.0 mi
Show comp detail 12 sales within ~0.75 mi
| Address | Dist | Beds/Ba | Sqft | Sold | Price | $/sf | Match |
|---|---|---|---|---|---|---|---|
| 208 St Christopher Dr | 0.65mi | 3/2.0 | 1,463 (+1%) | 1mo | $84,000 | $57 | 63 |
| 794 Mildred Ave | 0.39mi | 4/1.0 (+1) | 1,480 (+2%) | 4mo | $77,500 | $52 | 62 |
| 815 Sparks Ave | 0.37mi | 4/1.0 (+1) | 1,398 (-3%) | 3mo | $110,000 | $79 | 62 |
| 1624 Doris Ave | 0.31mi | 3/2.0 | 1,272 (-12%) | 2mo | $105,000 | $83 | 59 |
| 1620 Doris Ave | 0.30mi | 3/1.0 | 1,282 (-11%) | 2mo | $105,000 | $82 | 57 |
| 614 Cooper Dr | 0.55mi | 4/2.0 (+1) | 1,363 (-6%) | 2mo | $90,000 | $66 | 54 |
| 1128 Saint Boniface Dr | 0.39mi | 4/1.0 (+1) | 1,305 (-10%) | 1mo | $80,000 | $61 | 51 |
| 1115 St Bartholemew Dr Dr | 0.45mi | 4/2.0 (+1) | 1,305 (-10%) | 4mo | $110,000 | $84 | 50 |
| 1427 Williams St | 0.41mi | 4/1.0 (+1) | 1,300 (-10%) | 2mo | $59,500 | $46 | 49 |
| 300 Saint Kevin St | 0.34mi | 4/1.0 (+1) | 1,632 (+13%) | 2mo | $99,900 | $61 | 49 |
| 1426 Williams St | 0.40mi | 4/1.0 (+1) | 1,300 (-10%) | 7mo | $110,000 | $85 | 46 |
| 804 Otto St | 0.44mi | 3/1.0 | 1,260 (-13%) | 6mo | $35,000 | $28 | 46 |
Match score weights: distance 35% · size 25% · config 20% · recency 20%. Top-matched comps best support the ARV.
Projected returns pro-forma
-3.0% appreciation · 3.0% rent growth · sell at horizon
- IRR
- 37.8%
- Equity multiple
- 2.61×
- Total profit
- $31,570
- Equity at exit
- $10,437
- IRR
- 44.3%
- Equity multiple
- 5.22×
- Total profit
- $82,809
- Equity at exit
- $6,052
Cash invested: $19,600 (down + closing). Projections, not guarantees.
Landlord ↔ Tenant lean methodology
- Overall (STATE)
- 43 Moderately Tenant-Leaning
- State Illinois
- 43 Moderately Tenant-Leaning · D+7
- County
- — inherits STATE
- City
- — inherits STATE
ZIP-level market 62206
- Home prices YoY
- -20.2%
- Active inventory
- 152
- Price-to-rent
- 4.0×
Monthly cashflow live
- Estimated rent
- $1,465 high interval (Pro) →
- Mortgage (P&I)
- −$367
- Tax est. 1.5%
- −$88 /mo · $1,050/yr
- Insurance
- −$29
- HOA
- −$0
- Vacancy / Maint / Mgmt
- −$308
- Net cashflow
- $673
Break-even live
Sensitivity live
| Price | -10% $722 | -5% $698 | +0% $673 | +5% $649 | +10% $625 |
|---|---|---|---|---|---|
| Rent | -10% $558 | -5% $616 | +0% $673 | +5% $731 | +10% $789 |
| Rate | -1.0pp $709 | -0.5pp $691 | base $673 | +0.5pp $655 | +1.0pp $637 |
UW: 25.0% down · 7.5% · 30yr · 1.5% tax · 5.0% vac · 8.0% maint · 8.0% mgmt
Financing live
Cash to close
- Down payment
- $17,500
- Closing costs
- $2,100
- Reserves months
- —
- Total cash needed
- —
Loan-product check · same deal, 3 products live
Conventional
25% down · 7.5% · 30yr
- Down + closing
- —
- Monthly P&I
- —
- Monthly cashflow
- —
- DSCR
- —
- Eligible?
- —
Personal DTI + credit; lowest rate.
DSCR
20% down · 8.5% · 30yr
- Down + closing
- —
- Monthly P&I
- —
- Monthly cashflow
- —
- DSCR
- —
- Eligible?
- —
No personal income docs; deal must DSCR.
Hard money
10% down · 12.0% · 12mo
- Down + closing
- —
- Monthly P&I
- —
- Monthly cashflow
- —
- DSCR
- —
- Eligible?
- —
Short-term bridge; refi at stabilization.
Rent comps 30 comps
| Address | Beds | Baths | Sqft | Rent | $/sqft | DOM | Units | Dist |
|---|---|---|---|---|---|---|---|---|
| 1220 Williams St East Saint Louis, IL | 3.0 | 1.0 | 876 | $1,500 | $1.71 | 15d | 1 | 0.11mi |
| 818 La Salle Dr East Saint Louis, IL | 3.0 | 1.0 | 1106 | $1,300 | $1.18 | 24d | 1 | 0.20mi |
| 302 Saint Leonard Dr East Saint Louis, IL | 3.0 | 1.0 | 1155 | $1,300 | $1.13 | 44d | 1 | 0.28mi |
| 1405 Williams St Cahokia Heights, IL | 3.0 | 1.0 | 900 | $1,500 | $1.67 | 44d | 1 | 0.29mi |
| 819 Mildred Ave East Saint Louis, IL | 3.0 | 1.0 | 936 | $1,250 | $1.34 | 22d | 1 | 0.34mi |
| 1312 Saint Raphael St East Saint Louis, IL | 3.0 | 1.0 | 1280 | $1,500 | $1.17 | 44d | 1 | 0.34mi |
| 1417 Richard Dr East Saint Louis, IL | 3.0 | 1.0 | 936 | $1,400 | $1.50 | 22d | 1 | 0.37mi |
| 1420 Williams St East Saint Louis, IL | 4.0 | 1.0 | 1300 | $1,500 | $1.15 | 44d | 1 | 0.37mi |
| 1421 Richard Dr East Saint Louis, IL | 3.0 | 1.0 | 936 | $1,100 | $1.18 | 3d | 1 | 0.39mi |
| 1713 Loretta Ave East Saint Louis, IL | 3.0 | 1.0 | 944 | $1,095 | $1.16 | 44d | 1 | 0.40mi |
| 850 Saint Bartholomew Dr Cahokia, IL | 3.0 | 1.0 | 1050 | $1,285 | $1.22 | 17d | 1 | 0.41mi |
| 1808 Mullens Ave Cahokia Heights, IL | 3.0 | 1.0 | 992 | $1,500 | $1.51 | 3d | 1 | 0.54mi |
| 1162 Smith St East Saint Louis, IL | 3.0 | 1.0 | 988 | $1,295 | $1.31 | 22d | 1 | 0.70mi |
| 223 Donald St East Saint Louis, IL | 4.0 | 1.0 | 1794 | $1,550 | $0.86 | 44d | 1 | 0.80mi |
| 142 Saint Barbara Ln East Saint Louis, IL | 3.0 | 2.0 | 990 | $1,300 | $1.31 | 44d | 1 | 0.85mi |
| 102 Melvin Dr Unit 34 Sauget, IL | 4.0 | 1.0 | 1352 | $1,700 | $1.26 | 8d | 1 | 0.88mi |
| 121 Saint Dorothy Dr Cahokia, IL | 3.0 | 1.0 | 988 | $1,500 | $1.52 | 44d | 1 | 0.88mi |
| 1614 Parklane Dr East Saint Louis, IL | 4.0 | 1.0 | 1152 | $1,400 | $1.22 | 24d | 1 | 0.89mi |
| 811 Saint Thomas Ln East Saint Louis, IL | 3.0 | 1.0 | 1040 | $1,295 | $1.25 | 24d | 1 | 0.93mi |
| 1710 Parklane Dr East Saint Louis, IL | 4.0 | 1.0 | 1225 | $1,395 | $1.14 | 44d | 1 | 0.96mi |
| 2008 Delores St East Saint Louis, IL | 3.0 | 1.0 | 925 | $1,250 | $1.35 | 5d | 1 | 0.98mi |
| 1706 Andrews Dr East Saint Louis, IL | 4.0 | 1.0 | 925 | $1,320 | $1.43 | 24d | 1 | 0.99mi |
| 124 Saint James Ln Cahokia Heights, IL | 3.0 | 1.0 | 1064 | $1,350 | $1.27 | 44d | 1 | 1.05mi |
| 2116 Doris Ave Cahokia Heights, IL | 3.0 | 1.0 | 880 | $1,400 | $1.59 | 22d | 1 | 1.13mi |
| 111 Saint Thomas Ln East Saint Louis, IL | 3.0 | 1.0 | 1040 | $1,350 | $1.30 | 44d | 1 | 1.14mi |
| 526 Saint Leo Dr East Saint Louis, IL | 3.0 | 1.0 | 925 | $1,400 | $1.51 | 4d | 1 | 1.19mi |
| 725 Saint Norbert Dr East Saint Louis, IL | 3.0 | 1.0 | 1232 | $1,500 | $1.22 | 44d | 1 | 1.21mi |
| 705 Saint Martin Dr East Saint Louis, IL | 4.0 | 1.0 | 1033 | $1,600 | $1.55 | 22d | 1 | 1.23mi |
| 58 David St East Saint Louis, IL | 3.0 | 1.0 | 900 | $1,450 | $1.61 | 44d | 1 | 1.45mi |
| 2231 Loren St Cahokia Heights, IL | 2.0 | 1.0 | 1000 | $1,195 | $1.20 | 45d | 1 | 1.48mi |
Listing history 18 events
-
2026-06-21days on market $70,000 Active 84 DOM
-
2026-06-18days on market $70,000 Active 81 DOM
-
2026-06-17days on market $70,000 Active 80 DOM
-
2026-06-16days on market $70,000 Active 79 DOM
-
2026-06-15days on market $70,000 Active 78 DOM
-
2026-06-13days on market $70,000 Active 76 DOM
-
2026-06-13days on market $70,000 Active 75 DOM
-
2026-06-09days on market $70,000 Active 72 DOM
-
2026-06-08days on market $70,000 Active 71 DOM
-
2026-06-07days on market $70,000 Active 70 DOM
-
2026-06-05days on market $70,000 Active 67 DOM
-
2026-06-03days on market $70,000 Active 66 DOM
-
2026-06-02days on market $70,000 Active 65 DOM
-
2026-06-01days on market $70,000 Active 64 DOM
-
2026-05-31days on market $70,000 Active 63 DOM
-
2026-05-05price $75,000 974-char remark
Show marketing remark (974 chars)
Investor opportunity in Cahokia Heights! This bank-owned property at 1215 Julie Ave offers great potential for the right buyer looking to renovate and add value. With approximately 1,447 square feet of living space, this home features 3 bedrooms, 2 bathrooms, and a sunroom, along with a 2-car attached garage. The property is not move-in ready and will require repairs, making it ideal for investors or buyers seeking a project. There is no basement. Situated in the Cahokia Unit School District 187, this home includes a large backyard with a chain-link fence—perfect for pets or outdoor use—as well as a small storage shed for extra storage. The front yard is spacious and open with no fence, offering a variety of landscaping possibilities. Conveniently located just minutes from the interstate, this home provides easy access for commuting and travel. Property is being sold as-is. Buyer to verify all information and inquire about any required inspections.
-
2026-03-29$80,000 Active 974-char remark
Show marketing remark (974 chars)
Investor opportunity in Cahokia Heights! This bank-owned property at 1215 Julie Ave offers great potential for the right buyer looking to renovate and add value. With approximately 1,447 square feet of living space, this home features 3 bedrooms, 2 bathrooms, and a sunroom, along with a 2-car attached garage. The property is not move-in ready and will require repairs, making it ideal for investors or buyers seeking a project. There is no basement. Situated in the Cahokia Unit School District 187, this home includes a large backyard with a chain-link fence—perfect for pets or outdoor use—as well as a small storage shed for extra storage. The front yard is spacious and open with no fence, offering a variety of landscaping possibilities. Conveniently located just minutes from the interstate, this home provides easy access for commuting and travel. Property is being sold as-is. Buyer to verify all information and inquire about any required inspections.
-
1999-06-16soldstatus $69,500
ⓘ Source: listings_history table (triggers on properties + properties_extension) + one-shot
backfill from property_details.listing_events for pre-trigger history.
Climate risk First Street
- Flood 1/10 Low FEMA zone X (shaded) · 0% chance over 30 yrs
- Wildfire 1/10 Low
- Heat 6/10 Major 7 d/yr ≥107°F today · 21 d/yr by 30 yrs out
- Wind 2/10 Low 100% chance of damaging wind over 30 yrs
- Air quality 3/10 Moderate 3 unhealthy d/yr today · 4 by 30 yrs out
Nearby sold comps map
Loading sold comps map…
Walkable amenities ~0.75 mi
Loading nearby amenities…
Taxation est. · year 1
- Rental income
- $17,577
- − Mortgage interest
- −$3,921
- − Property taxes
- −$1,050
- − Insurance
- −$350
- − Repairs & maintenance
- −$1,406
- − Management
- −$1,406
- − Depreciation
- −$2,036
- Taxable income
- $7,408
- Est. tax owed @ 24.0%
- −$1,778
- After-tax cash flow
- $6,303/yr
For passive investors: Depreciation is non-cash, so a rental often shows a tax loss while cash-flowing — sheltering income. Rental losses are passive: they offset passive income freely, and up to $25,000/yr can offset ordinary (W-2) income if you actively participate and your MAGI is under $100k (phasing out to $0 by $150k); unused losses carry forward. On sale, claimed depreciation is recaptured at up to 25%, and gains may owe capital-gains tax (a 1031 exchange can defer both). Figures are a year-1 estimate at your 24.0% rate — not tax advice; consult a CPA.
Schools (NCES district)
- District
- Cahokia CUSD 187
- NCES district ID
- 1708040
- Math proficiency
- 3% ▼ -2.00%
- Reading proficiency
- 5% ▬ 0.00%
- Median HH income
- $28,028
- Composite
- 6.44/100
- National rank
- #14827
- State rank
- #864 of 919 in IL
Livability — Cahokia Heights
No livability data for this city. (Only ~50 U.S. cities are tracked.)
Census & demographics
- Census place
- Cahokia Heights, IL
- County
- Saint Clair County · 169,691 people
- City population
- 19,956
- Metro
- St. Louis, MO-IL
- Population (ZIP)
- 12,959
- Household income
- $33,838
- Rent vs Own
- Severe rent burden
- 729.0
Population outlook (St. Clair County) Hauer SSP2
- Today (2025)
- 250,366 people
- By 2030
- 240,511 · -3.9%
- By 2040
- 217,391 · -13.2%
- By 2050
- 192,699 · -23.0%
- By 2075
- 140,637 · -43.8%
- By 2100
- 100,499 · -59.9%
Race, ethnicity, and origin ACS 2023
- Neighborhood character
- Diverse neighborhood (Simpson 0.56)
- Race & ethnicity
- Black 59% White 29% Two or more races 6% Hispanic / Latino 3% Asian 2%
- Common ancestry
- Romanian 2% Lithuanian 1% Iranian 1%
- Foreign-born
- 2% · China
- Languages at home
- 95% English-only · Spanish 3% Other Indo-European 1% Chinese 1%
Political lean MEDSL · St. Clair
- 2024 margin
- Lean D (+7.9) · D 53.0% · R 45.1% · Other 1.8%
- 2008→2024 swing
- -14.6pp toward R · 2008: 22.4pp · 2024: 7.9pp
- All cycles
- 2024: D+7.9 2020: D+8.7 2016: D+5.6 2012: D+14.5 2008: D+22.4
Not yet ingested
- Civics
- —
Market trends
- HPI YoY
- ▼ -33.26%
- Current HPI
- 131.5144
- Rent YoY
- —
- Metro
- St. Louis, MO-IL
- State GDP YoY
- ▲ 1.59%
- F500 in state
- 60
Industry mix (Fortune 500 HQ in IL)
| Industry | F500 HQs | Revenue |
|---|---|---|
| Insurance | 4 | $201B |
|
||
| Consumer Goods | 4 | $87B |
|
||
| Industrial Machinery | 3 | $64B |
|
||
| Healthcare | 2 | $55B |
|
||
| Retail / Pharmacy | 1 | $148B |
|
||
| Agriculture / Food | 1 | $86B |
|
||
Price history
+7.9% since first listed3 events — show timeline
- 2026-05-05 Price Changed $75,000 MARIS as Distributed by MLS Grid
- 2026-03-29 Listed $80,000 MARIS as Distributed by MLS Grid
- 1999-06-16 Sold (Public Records) $69,500 Public Records
Property tax history
-30.5%/yrLatest (2024): $26 · -97.9% YoY. Source: county tax records.
Cash-flow waterfall
monthlySold comps — $/sqft
last 12 mo · ≤1 miLoading sold comps…