3064 Culpepper Ln · Vernon, FL
Flood risk 1/10 · Minimal
- FEMA flood zone
- X (unshaded)
- Chance of flooding over 30 yrs
- 0.0%
- Est. flood insurance / yr
- $507 – $1,088
Fire risk 4/10 · Minor
- Est. fire insurance / yr
- $947 – $1,759
Heat risk 8/10 · Major
- Hot days now (above 106°F)
- 7 days/yr
- Hot days in 30 yrs
- 20 days/yr
Wind risk 9/10 · Severe
- Chance of severe wind over 30 yrs
- 99.0%
Air-quality risk 2/10 · Minimal
- Unhealthy air days now
- 0 days/yr
- Unhealthy air days in 30 yrs
- 1 days/yr
Risk factors via First Street. Map © Google.
Why this score? — see what drove the B+ grade
The composite is a weighted blend of 9 inputs, each scored 0–100. Each bar is that input's sub-score; the figure is the points it added to the 100-point composite (weight × sub-score).
- Cash flow +30.0/30.0
- ARV discount +10.7/15.0
- 1% rule +10.0/10.0
- DSCR +10.0/10.0
- Appreciation +6.1/10.0
- Schools +4.1/10.0
- Livability +3.0/5.0
- Rent growth +2.5/5.0
- Condition / age +2.5/5.0
$89,999
🖨 Deal sheet (PDF) 📄 Offer letter ✓ Due diligence
Listing remarks
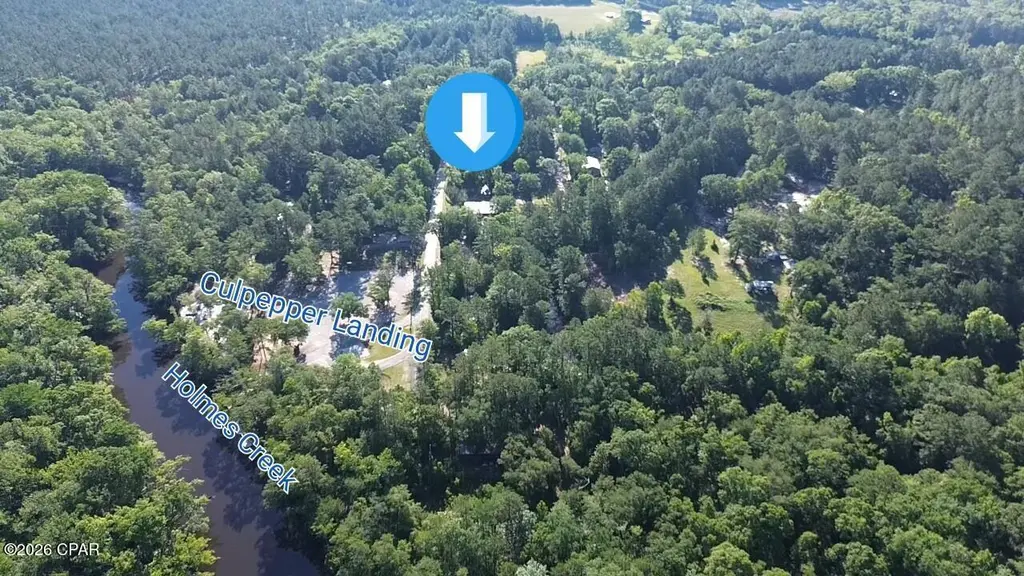
This 960 sq ft single-wide mobile home offers a great opportunity for someone ready to create their own personalized space. The property is situated less than 1/8 mile from Culpepper Landing on Holmes Creek a popular boat launch providing easy access to Cypress Springs. This property is perfect for boating, fishing, kayaking, and enjoying Florida's natural beauty. The home features two bedrooms and two bathrooms, a spacious covered front porch ideal for morning coffee or evening relaxation, a durable metal roof, and a convenient laundry/utility room addition built off the back. It offers open living space with plenty of room to update and personalize. This home needs some TLC and updating,
Key facts
- Covered front porch
- Durable metal roof
- Covered overhang
Tags
Property features AI
Finance
- HOA & community: Short-term rentals allowed
Exterior
- Utilities: Has heating and cooling
- Home design: Single wide mobile home
- Construction: Metal roof
- Exterior features: Covered porch; Shed(s)
Interior
- Kitchen: Electric cooktop
- Bathrooms: 2 full bathrooms
- Heating & cooling: Central heating; Central air conditioning
- Interior features: Living room measuring 20 x 14; Covered front porch measuring 8 x 16
Neighborhood map
What this means for you Summary
Snapshot
- This is a 2-bed/1.0-bath manufactured listed at $90k.
Deal economics
- At list price, monthly cash flow is $508 ($6k/yr) — positive.
- The deal already cash-flows at list — no discount required.
- Meets the 1% rule at list price ($1k rent vs $90k).
- Recommended offer: $87k (3.0% below list) — sets the bar for market timing.
- Cap rate 13.1% vs local median 3.2% in Vernon — top-decile yield for the area; either an underpriced asset or a hidden risk that comps aren't pricing in. Stress-test before assuming the spread holds.
Location & tenants
- Location reads 59/100 on livability (#834 in FL) — a working-class tenant base; expect higher turnover. Strengths: cost of living A+, housing A+; Watch: crime D+, amenities F, commute F.
- Washington (rural): math 49% / reading 50% proficiency, ranked #45 of 73 in FL (top 62%) — families likely to look elsewhere, expect single-tenant / working-renter base with shorter leases.
- Zoned schools: Kate M. Smith Elementary School (math 58% / reading 60%, grade B-, #722 of 2,144 statewide, top 34%, 941 students, 61% FRL); Roulhac Middle School (math 61% / reading 53%, grade B, #164 of 571 statewide, top 30%, 440 students, 54% FRL); Chipley High School (math 35% / reading 50%, grade F, #264 of 667 statewide, top 41%, 588 students, 46% FRL) — zoned schools at 54% FRL track the district average.
- Market conditions: 47 active listings in the ZIP; 217 units permitted in Washington County in 2024 (0 in 5+ unit buildings).
Forward outlook
- In year one you build about $3k of equity ($622 loan paydown + $2k appreciation (2.2% local appreciation)).
- Washington County population projected at -11% by 2050 — secular population decline; favor cash flow + early exit over multi-decade hold.
- At projected returns (2.2% appreciation + 3.0% rent growth), your $25k cash investment doubles in ~3 years — after that, you're playing with house money.
Negotiation context
- It's been on market 37 days — a 3% lower offer ($87k) is reasonable based on typical stale-listing flexibility.
- 2 sale attempts since 24y ago with the ask held roughly flat each time — persistent listings suggest the price (not the market) is what's stuck; bring a comps-based counter.
Risks & watch-outs
- Climate carrying-cost: severe wind risk, 99% chance of damaging wind over 30y; extreme-heat days projected 7→20/yr by 2055 (HVAC capex compounding) — expect insurance premiums to compound above CPI over the hold.
Questions for the listing agent
- It's been on market 37 days. Have you received any prior offers? Is the seller open to a 3% concession, seller financing, or rate buy-down credit?
- Is there a deadline driving the sale (1031 exchange, divorce, estate, relocation)? That informs how much negotiation room exists.
- Schools are D-rated, which usually means shorter tenancies and higher turnover. Who's the typical renter profile here, and what's been the actual vacancy rate?
- Crime grade is D in this area — have there been break-ins, vandalism, or insurance claims at this property in the last 3 years? What carrier currently insures it and at what premium?
- What's the average days-on-market for RENTAL listings here right now (not sales)? A rising rental-DOM trend means longer vacancies and softer asking-rent achievability than the comps imply.
- What's the recent tenant-quality profile in this submarket — average credit score on applications, eviction rate, late-payment / NSF rate, and stable-employment percentage? A property-management company in the area should have these aggregated.
- How much new for-sale + rental construction is in the pipeline within 1–3 miles? Heavy new supply typically softens prices + rents 12–24 months out; constrained supply supports both.
Investment metrics
- 1% rule
- 1.59% ✓
- Cap rate
- 13.07%
- Cash-on-cash
- 24.21%
- DSCR
- 2.08
- GRM
- 5.2
CMA / ARV
- ARV (on-the-fly)
- $96,960
- Comps found
- 1
Show comp detail 1 sale within ~0.75 mi
| Address | Dist | Beds/Ba | Sqft | Sold | Price | $/sf | Match |
|---|---|---|---|---|---|---|---|
| 2987 Bruner Dairy Rd | 0.57mi | 3/2.0 (+1) | 1,080 (+12%) | 14mo | $109,000 | $101 | 31 |
Match score weights: distance 35% · size 25% · config 20% · recency 20%. Top-matched comps best support the ARV.
Projected returns pro-forma
2.24% appreciation · 3.0% rent growth · sell at horizon
- IRR
- 28.9%
- Equity multiple
- 2.57×
- Total profit
- $39,678
- Equity at exit
- $36,676
- IRR
- 30.1%
- Equity multiple
- 4.99×
- Total profit
- $100,491
- Equity at exit
- $53,734
Cash invested: $25,200 (down + closing). Projections, not guarantees.
Landlord ↔ Tenant lean methodology
- Overall (STATE)
- 87 Strongly Landlord-Friendly
- State Florida
- 87 Strongly Landlord-Friendly · R+3
- County
- — inherits STATE
- City
- — inherits STATE
ZIP-level market 32462
- Home prices YoY
- 1.0%
- Active inventory
- 47
- Price-to-rent
- 5.2×
Monthly cashflow live
- Estimated rent
- $1,431 medium interval (Pro) →
- Mortgage (P&I)
- −$472
- Tax est. 1.5%
- −$112 /mo · $1,350/yr
- Insurance
- −$37
- HOA
- −$0
- Vacancy / Maint / Mgmt
- −$300
- Net cashflow
- $508
Break-even live
Sensitivity live
| Price | -10% $571 | -5% $539 | +0% $508 | +5% $477 | +10% $446 |
|---|---|---|---|---|---|
| Rent | -10% $395 | -5% $452 | +0% $508 | +5% $565 | +10% $621 |
| Rate | -1.0pp $554 | -0.5pp $531 | base $508 | +0.5pp $485 | +1.0pp $461 |
UW: 25.0% down · 7.5% · 30yr · 1.5% tax · 5.0% vac · 8.0% maint · 8.0% mgmt
Financing live
Cash to close
- Down payment
- $22,500
- Closing costs
- $2,700
- Reserves months
- —
- Total cash needed
- —
Loan-product check · same deal, 3 products live
Conventional
25% down · 7.5% · 30yr
- Down + closing
- —
- Monthly P&I
- —
- Monthly cashflow
- —
- DSCR
- —
- Eligible?
- —
Personal DTI + credit; lowest rate.
DSCR
20% down · 8.5% · 30yr
- Down + closing
- —
- Monthly P&I
- —
- Monthly cashflow
- —
- DSCR
- —
- Eligible?
- —
No personal income docs; deal must DSCR.
Hard money
10% down · 12.0% · 12mo
- Down + closing
- —
- Monthly P&I
- —
- Monthly cashflow
- —
- DSCR
- —
- Eligible?
- —
Short-term bridge; refi at stabilization.
Listing history 20 events
-
2026-06-21days on market $89,999 Active 37 DOM
-
2026-06-21days on market $89,999 Active 36 DOM
-
2026-06-18days on market $89,999 Active 34 DOM
-
2026-06-17days on market $89,999 Active 33 DOM
-
2026-06-16days on market $89,999 Active 32 DOM
-
2026-06-15days on market $89,999 Active 31 DOM
-
2026-06-13days on market $89,999 Active 29 DOM
-
2026-06-12days on market $89,999 Active 28 DOM
-
2026-06-09days on market $89,999 Active 25 DOM
-
2026-06-08days on market $89,999 Active 24 DOM
-
2026-06-07days on market $89,999 Active 23 DOM
-
2026-06-07days on market $89,999 Active 22 DOM
-
2026-06-04days on market $89,999 Active 19 DOM
-
2026-06-02days on market $89,999 Active 18 DOM
-
2026-06-01days on market $89,999 Active 17 DOM
-
2026-05-31days on market $89,999 Active 16 DOM
-
2026-05-31days on market $89,999 Active 15 DOM
-
2026-05-14$89,999 Active 1487-char remark
-
2021-12-14historical
-
2002-05-18$29,900
ⓘ Source: listings_history table (triggers on properties + properties_extension) + one-shot
backfill from property_details.listing_events for pre-trigger history.
Climate risk First Street
- Flood 1/10 Low FEMA zone X (unshaded) · 0% chance over 30 yrs
- Wildfire 4/10 Moderate
- Heat 8/10 Severe 7 d/yr ≥106°F today · 20 d/yr by 30 yrs out
- Wind 9/10 Extreme 99% chance of damaging wind over 30 yrs
- Air quality 2/10 Low 0 unhealthy d/yr today · 1 by 30 yrs out
Nearby sold comps map
Loading sold comps map…
Walkable amenities ~0.75 mi
Loading nearby amenities…
Taxation est. · year 1
- Rental income
- $17,170
- − Mortgage interest
- −$5,041
- − Property taxes
- −$1,350
- − Insurance
- −$450
- − Repairs & maintenance
- −$1,374
- − Management
- −$1,374
- − Depreciation
- −$2,618
- Taxable income
- $4,963
- Est. tax owed @ 24.0%
- −$1,191
- After-tax cash flow
- $4,909/yr
For passive investors: Depreciation is non-cash, so a rental often shows a tax loss while cash-flowing — sheltering income. Rental losses are passive: they offset passive income freely, and up to $25,000/yr can offset ordinary (W-2) income if you actively participate and your MAGI is under $100k (phasing out to $0 by $150k); unused losses carry forward. On sale, claimed depreciation is recaptured at up to 25%, and gains may owe capital-gains tax (a 1031 exchange can defer both). Figures are a year-1 estimate at your 24.0% rate — not tax advice; consult a CPA.
Schools (NCES district)
- District
- Washington
- NCES district ID
- 1202010
- Math proficiency
- 49% ▼ -7.00%
- Reading proficiency
- 50% ▼ -4.00%
- Median HH income
- $36,948
- Composite
- 41.12/100
- National rank
- #3561
- State rank
- #45 of 73 in FL
Livability — Vernon
- Score
- 59/100
- State rank
- #834
- US rank
- #20536
Category grades
Schools grade is shown separately in the Schools card above.
Census & demographics
- Population (ZIP)
- 3,452
Population outlook (Washington County) Hauer SSP2
- Today (2025)
- 24,087 people
- By 2030
- 23,600 · -2.0%
- By 2040
- 22,643 · -6.0%
- By 2050
- 21,524 · -10.6%
- By 2075
- 18,432 · -23.5%
- By 2100
- 13,298 · -44.8%
Race, ethnicity, and origin ACS 2023
- Neighborhood character
- Majority White (64%)
- Race & ethnicity
- White 64% Black 20% Two or more races 8% Native American 5% Hispanic / Latino 5% Asian 1%
- Common ancestry
- Greek 2% Slovak 1% Lithuanian 1%
- Foreign-born
- 3% · Canada, South Korea
- Languages at home
- 97% English-only · Spanish 1% Tagalog/Filipino 1%
Political lean MEDSL · Washington
- 2024 margin
- Solid R (+65.4) · D 17.0% · R 82.4%
- 2008→2024 swing
- -17.7pp toward R · 2008: -47.8pp · 2024: -65.4pp
- All cycles
- 2024: R+65.4 2020: R+61.1 2016: R+57.1 2012: R+47.4 2008: R+47.8
Not yet ingested
- Civics
- —
Market trends
- HPI YoY
- ▲ 2.24%
- Current HPI
- 221.7113
- Rent YoY
- —
- Metro
- —
- State GDP YoY
- ▲ 3.28%
- F500 in state
- 36
Industry mix (Fortune 500 HQ in FL)
| Industry | F500 HQs | Revenue |
|---|---|---|
| Industrial Technology | 2 | $29B |
|
||
| Insurance | 2 | $17B |
|
||
| Retail | 1 | $60B |
|
||
| Technology Distribution | 1 | $58B |
|
||
| Homebuilding | 1 | $35B |
|
||
| Technology Manufacturing | 1 | $35B |
|
||
Price history
+201.0% since first listed3 events — show timeline
- 2026-05-14 Listed $89,999 CPARMLS
- 2021-12-14 Listing Removed — CPARMLS
- 2002-05-18 Listed $29,900 CPARMLS
Cash-flow waterfall
monthlySold comps — $/sqft
last 12 mo · ≤1 miLoading sold comps…