 Duplex
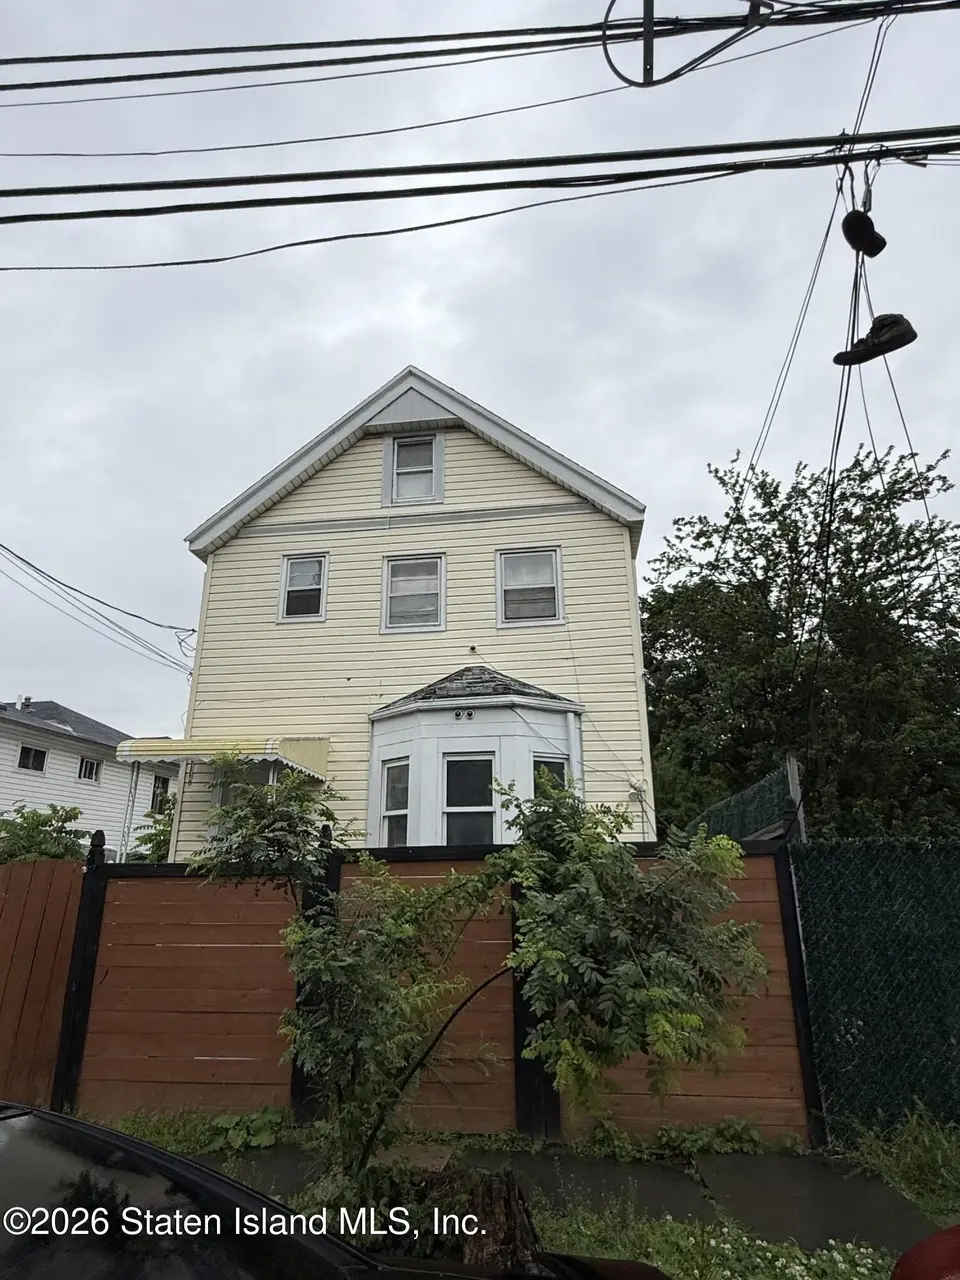
71 Osgood Ave · New York, NY
Flood risk 1/10 · Minimal
- FEMA flood zone
- X (unshaded)
- Chance of flooding over 30 yrs
- 0.0%
- Est. flood insurance / yr
- $507 – $1,088
Fire risk 1/10 · Minimal
- Est. fire insurance / yr
- $691 – $1,283
Heat risk 7/10 · Major
- Hot days now (above 98°F)
- 7 days/yr
- Hot days in 30 yrs
- 16 days/yr
Wind risk 6/10 · Moderate
- Chance of severe wind over 30 yrs
- 61.0%
Air-quality risk 4/10 · Minor
- Unhealthy air days now
- 5 days/yr
- Unhealthy air days in 30 yrs
- 7 days/yr
Risk factors via First Street. Map © Google.
Why this score? — see what drove the B- grade
The composite is a weighted blend of 9 inputs, each scored 0–100. Each bar is that input's sub-score; the figure is the points it added to the 100-point composite (weight × sub-score).
- Cash flow +23.5/30.0
- ARV discount +14.8/15.0
- DSCR +7.6/10.0
- 1% rule +5.3/10.0
- Schools +5.0/10.0
- Livability +3.8/5.0
- Rent growth +3.0/5.0
- Condition / age +2.5/5.0
- Appreciation +0.0/10.0
$499,000
🖨 Deal sheet 📄 Offer letter ✓ Due diligence
Multi-family units
County records classify this as Multi-Family (2-4 Unit). Listing-text estimate: 2 units. confirmed
Listing remarks
Short sale subject to third-party bank approval. Cash offers only. Drive-by only — no interior access. Property is being sold as-is with all existing violations. Legal two-family currently being utilized as an SRO (single room occupancy) and is occupied.
Key facts
- 3,000 sq ft lot
- Built 1940
- Listed 28 days
Property features AI
Finance
- Other: Annual tax information not included per instructions
- Financial info: Two-unit property
Exterior
- Parking: No attached garage
- Utilities: Electric: 110V; Water and sewer: (not specified)
- Home design: 3-story multifamily building; Approximately 1,100 building area total; Vinyl siding
- Construction: Vinyl siding construction; Year built: Approximate; Property condition: Poor
- Exterior features: Lot approximately 0.07 acres (about 3,000 sq ft); Lot dimensions about 25 x 120; Zoned R3A
Interior
- Bedrooms: Unit 1: 2 bedrooms (level 1); Unit 2: 2 bedrooms (level 2)
- Bathrooms: 1 full bathroom (total)
- Heating & cooling: Natural gas hot water heating
- Interior features: Unfinished basement
Neighborhood map
What this means for you Summary
Snapshot
- This is a 2 × 2-bed/1.0-bath units multifamily listed at $499k.
Deal economics
- At list price, monthly cash flow is $929 ($11k/yr) — positive. Per door: $465/mo.
- The deal already cash-flows at list — no discount required.
- Meets the 1% rule at list price ($5k rent vs $499k).
- Recommended offer: $492k (1.5% below list) — sets the bar for market timing.
- Cap rate 8.5% vs local median 2.6% in New York — top-decile yield for the area; either an underpriced asset or a hidden risk that comps aren't pricing in. Stress-test before assuming the spread holds.
Location & tenants
- Location reads 75/100 on livability (#268 in NY, #4,188 nationally) — a middle-class / working-renter tenant base. Strengths: amenities A+, commute A+, health & safety A; Watch: crime F, cost of living F.
- Market conditions: Rents rising (+2.0%/yr); 203 active listings in the ZIP; 3 comparable units currently listed for rent nearby; rentals at typical pace (median 24d on market — plan ~3-4 weeks tenant-placement turnaround); 480 units permitted in Richmond County in 2024 (22 in 5+ unit buildings).
- At $5,120/mo this rent would consume 86% of the median local household income ($72k/yr) (locally 2401% of renters already pay >50% of income on rent) — very limited rent-growth headroom before tenants either downsize or default.
Forward outlook
- Local home prices are declining (-3.0%/yr); year-one equity from $3k of loan paydown is wiped out by about $15k of value loss. Plan a longer hold.
- Richmond County population projected to shrink 5% by 2050 — rents likely to lag national; underwrite the cash flow, not the appreciation.
Negotiation context
- It's been on market 28 days — a 2% lower offer ($492k) is reasonable based on typical stale-listing flexibility.
- 4 sale attempts since 7y ago with the ask held roughly flat each time — persistent listings suggest the price (not the market) is what's stuck; bring a comps-based counter.
- Current owner paid $121k; list at $499k implies a 312% gain — meaningful room to come down on a strong offer.
Risks & watch-outs
- Watch-outs: built in 1940 — expect roof / HVAC / electrical / plumbing capex.
- Climate carrying-cost: major wind risk, 61% chance of damaging wind over 30y; extreme-heat days projected 7→16/yr by 2055 (HVAC capex compounding) — expect insurance premiums to compound above CPI over the hold.
Questions for the listing agent
- Can we see the unit-by-unit rent roll, current vacancy, and any below-market leases? What's the average tenancy length?
- What capital expenditures (roof, boiler, parking lot, exteriors) have been made in the last 5 years, and what's planned in the next 2?
- Built in 1940 — when were the roof, HVAC, electrical panel, plumbing, and water heater last replaced?
- Is there a deadline driving the sale (1031 exchange, divorce, estate, relocation)? That informs how much negotiation room exists.
- Schools are B-rated — typically a magnet for longer-tenancy family renters. What's the average tenant stay here, and is there a school-zone premium baked into asking?
- Crime grade is F in this area — have there been break-ins, vandalism, or insurance claims at this property in the last 3 years? What carrier currently insures it and at what premium?
- What's the average days-on-market for RENTAL listings here right now (not sales)? A rising rental-DOM trend means longer vacancies and softer asking-rent achievability than the comps imply.
- What's the recent tenant-quality profile in this submarket — average credit score on applications, eviction rate, late-payment / NSF rate, and stable-employment percentage? A property-management company in the area should have these aggregated.
- How much new apartment / multifamily construction is in the pipeline within 1–3 miles? Heavy new supply (>2% of stock underway) typically softens rents 12–24 months out; light construction supports rent growth.
Investment metrics
- 1% rule
- 1.03% ✓
- Cap rate
- 8.53%
- Cash-on-cash
- 7.98%
- DSCR
- 1.36
- GRM
- 8.1
CMA / ARV
- ARV (on-the-fly)
- $596,200
- Comps found
- 2
Show comp detail 2 sales within ~0.75 mi
| Address | Dist | Beds/Ba | Sqft | Sold | Price | $/sf | Match |
|---|---|---|---|---|---|---|---|
| 174 Pine Pl | 0.26mi | 3/1.0 (-1) | 1,000 (-8%) | 12mo | $550,000 | $550 | 56 |
| 273 Clifton Ave | 0.73mi | 3/4.0 (-1) | 1,200 (+11%) | 3mo | $655,000 | $546 | 32 |
Match score weights: distance 35% · size 25% · config 20% · recency 20%. Top-matched comps best support the ARV.
Projected returns pro-forma
-3.0% appreciation · 1.99% rent growth · sell at horizon
- IRR
- -5.2%
- Equity multiple
- 0.81×
- Total profit
- $-26,955
- Equity at exit
- $74,403
- IRR
- 3.3%
- Equity multiple
- 1.23×
- Total profit
- $31,507
- Equity at exit
- $43,144
Cash invested: $139,720 (down + closing). Projections, not guarantees.
Landlord ↔ Tenant lean methodology
- Overall (CITY)
- 0 Strongly Tenant-Friendly
- State New York
- 15 Strongly Tenant-Friendly · D+10
- County
- — inherits STATE
- City New York
- 0 Strongly Tenant-Friendly · D+34
ZIP-level market 10304
- Rents YoY
- 2.0%
- Active inventory
- 203
- Price-to-rent
- 16.2×
Monthly cashflow live
- Estimated rent
- $5,120 medium interval (Pro) →
- Mortgage (P&I)
- −$2,617
- Tax from tax record
- −$291 /mo · $3,490/yr
- Insurance
- −$208
- HOA
- −$0
- Vacancy / Maint / Mgmt
- −$1,075
- Net cashflow
- $929
Break-even live
2-unit breakdown (identical units grouped — click to expand)
| Units | Beds | Baths | Est. rent |
|---|---|---|---|
| 2× units | 2 | 1 | $5,120 |
| #1 | 2 | 1 | $2,560 |
| #2 | 2 | 1 | $2,560 |
| Total (2 units) | $5,120 | ||
UW: 25.0% down · 7.5% · 30yr · 1.5% tax · 5.0% vac · 8.0% maint · 8.0% mgmt
Financing live
Cash to close
- Down payment
- $124,750
- Closing costs
- $14,970
- Reserves months
- —
- Total cash needed
- —
Loan-product check · same deal, 3 products live
Conventional
25% down · 7.5% · 30yr
- Down + closing
- —
- Monthly P&I
- —
- Monthly cashflow
- —
- DSCR
- —
- Eligible?
- —
Personal DTI + credit; lowest rate.
DSCR
20% down · 8.5% · 30yr
- Down + closing
- —
- Monthly P&I
- —
- Monthly cashflow
- —
- DSCR
- —
- Eligible?
- —
No personal income docs; deal must DSCR.
Hard money
10% down · 12.0% · 12mo
- Down + closing
- —
- Monthly P&I
- —
- Monthly cashflow
- —
- DSCR
- —
- Eligible?
- —
Short-term bridge; refi at stabilization.
Rent comps 3 comps
| Address | Beds | Baths | Sqft | Rent | $/sqft | DOM | Units | Dist |
|---|---|---|---|---|---|---|---|---|
| 21 Susan Ct Staten Island, NY | 3.0 | 2.5 | 900 | $3,400 | $3.78 | 24d | 1 | 0.30mi |
| 305 Osgood Ave Unit 2 Staten Island, NY | 3.0 | 2.0 | 1300 | $3,200 | $2.46 | 24d | 1 | 0.46mi |
| 97 Greenfield Ave Staten Island, NY | 3.0 | 2.5 | 1254 | $3,400 | $2.71 | 24d | 1 | 0.49mi |
Listing history 23 events
-
2026-06-18days on market $499,000 Active 28 DOM
-
2026-06-17days on market $499,000 Active 27 DOM
-
2026-06-16days on market $499,000 Active 26 DOM
-
2026-06-15days on market $499,000 Active 25 DOM
-
2026-06-13days on market $499,000 Active 23 DOM
-
2026-06-10days on market $499,000 Active 19 DOM
-
2026-06-08days on market $499,000 Active 18 DOM
-
2026-06-08days on market $499,000 Active 17 DOM
-
2026-06-04days on market $499,000 Active 14 DOM
-
2026-06-03days on market $499,000 Active 13 DOM
-
2026-06-02days on market $499,000 Active 12 DOM
-
2026-06-01days on market $499,000 Active 11 DOM
-
2026-05-31days on market $499,000 Active 10 DOM
-
2026-05-21$499,000 Active
-
2021-02-04status Pending
-
2019-11-27historical
-
2019-11-27historical
-
2019-11-25$99,999 Active
-
2019-06-21historical
-
2019-06-05status Active
-
2019-04-17historical
-
2019-02-05$349,000 Active
-
1996-03-21soldstatus $121,000
ⓘ Source: listings_history table (triggers on properties + properties_extension) + one-shot
backfill from property_details.listing_events for pre-trigger history.
Tax reassessment forecast NY · Partial reset (capped growth)
- Current annual tax
- $3,490 · $291/mo
- Projected year-2 tax
- $5,962 · $497/mo
- Expected delta
- +$2,472/yr (+$206/mo · 70.8%)
ⓘ Screening estimate from a state-policy table — verify with the county assessor before closing.
Climate risk First Street
- Flood 1/10 Low FEMA zone X (unshaded) · 0% chance over 30 yrs
- Wildfire 1/10 Low
- Heat 7/10 Severe 7 d/yr ≥98°F today · 16 d/yr by 30 yrs out
- Wind 6/10 Major 61% chance of damaging wind over 30 yrs
- Air quality 4/10 Moderate 5 unhealthy d/yr today · 7 by 30 yrs out
Nearby sold comps map
Loading sold comps map…
Walkable amenities ~0.75 mi
Loading nearby amenities…
Taxation est. · year 1
- Rental income
- $61,440
- − Mortgage interest
- −$27,952
- − Property taxes
- −$3,490
- − Insurance
- −$2,495
- − Repairs & maintenance
- −$4,915
- − Management
- −$4,915
- − Depreciation
- −$14,516
- Taxable income
- $3,156
- Est. tax owed @ 24.0%
- −$758
- After-tax cash flow
- $10,393/yr
For passive investors: Depreciation is non-cash, so a rental often shows a tax loss while cash-flowing — sheltering income. Rental losses are passive: they offset passive income freely, and up to $25,000/yr can offset ordinary (W-2) income if you actively participate and your MAGI is under $100k (phasing out to $0 by $150k); unused losses carry forward. On sale, claimed depreciation is recaptured at up to 25%, and gains may owe capital-gains tax (a 1031 exchange can defer both). Figures are a year-1 estimate at your 24.0% rate — not tax advice; consult a CPA.
Schools (NCES district)
No district data.
Livability — New York
- Score
- 75/100
- State rank
- #268
- US rank
- #4188
Category grades
Schools grade is shown separately in the Schools card above.
Census & demographics
- Census place
- New York, NY
- County
- Richmond County · 404,174 people
- City population
- 7,731,280
- Metro
- New York-Newark-Jersey City, NY-NJ-PA
- Population (ZIP)
- 45,658
- Household income
- $71,561
- Rent vs Own
- Severe rent burden
- 2401.0
Population outlook (Richmond County) Hauer SSP2
- Today (2025)
- 482,784 people
- By 2030
- 481,831 · -0.2%
- By 2040
- 473,159 · -2.0%
- By 2050
- 457,242 · -5.3%
- By 2075
- 408,029 · -15.5%
- By 2100
- 341,459 · -29.3%
Race, ethnicity, and origin ACS 2023
- Neighborhood character
- Highly diverse neighborhood (Simpson 0.73)
- Race & ethnicity
- White 36% Black 25% Hispanic / Latino 24% Asian 13% Two or more races 8% Native American 1%
- Hispanic origin (detail)
- Mexican 4% Puerto Rican 10% Dominican 2%
- Common ancestry
- Scotch-Irish 3% Romanian 2% Swiss 2%
- Foreign-born
- 32% · Canada, China, Jamaica
- Languages at home
- 54% English-only · Spanish 16% Chinese 8% Other Indo-European 5%
Political lean MEDSL · Richmond
- 2024 margin
- Strong R (+29.8) · D 35.1% · R 64.9%
- 2008→2024 swing
- -25.7pp toward R · 2008: -4.0pp · 2024: -29.8pp
- All cycles
- 2024: R+29.8 2020: R+14.9 2016: R+16.8 2012: D+0.8 2008: R+4.0
Not yet ingested
- Civics
- —
Market trends
- HPI YoY
- ▼ -254.93%
- Current HPI
- 346.7976
- Rent YoY
- ▲ 1.99%
- Metro
- New York-Newark-Jersey City, NY-NJ-PA
- State GDP YoY
- ▲ 2.60%
- F500 in state
- 92
Industry mix (Fortune 500 HQ in NY)
| Industry | F500 HQs | Revenue |
|---|---|---|
| Financial Services | 10 | $950B |
|
||
| Consumer Goods | 9 | $162B |
|
||
| Insurance | 4 | $225B |
|
||
| Telecommunications | 2 | $144B |
|
||
| Pharmaceuticals | 2 | $112B |
|
||
| Media / Entertainment | 2 | $69B |
|
||
Price history
+312.4% since first listed10 events — show timeline
- 2026-05-21 Listed $499,000 SIBORMLS
- 2021-02-04 Pending — SIBORMLS
- 2019-11-27 Listing Removed — SIBORMLS
- 2019-11-27 Listing Removed — SIBORMLS
- 2019-11-25 Listed $99,999 SIBORMLS
- 2019-06-21 Listing Removed — SIBORMLS
- 2019-06-05 Relisted — SIBORMLS
- 2019-04-17 Listing Removed — SIBORMLS
- 2019-02-05 Listed $349,000 SIBORMLS
- 1996-03-21 Sold (Public Records) $121,000 Public Records
Property tax history
+4.4%/yrLatest (2025): $3,490 · +7.7% YoY. Source: county tax records.
Cash-flow waterfall
monthlySold comps — $/sqft
last 12 mo · ≤1 miLoading sold comps…