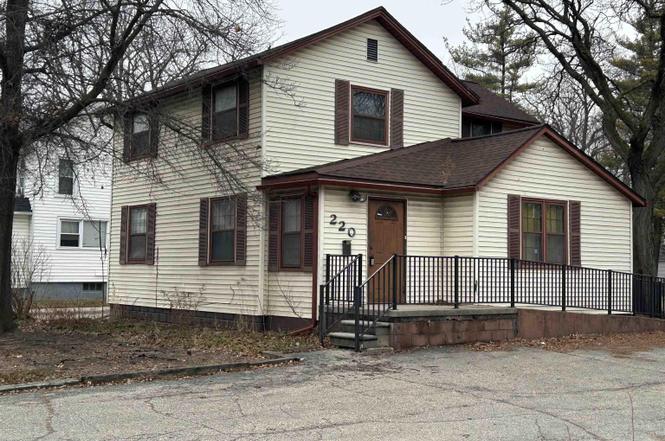
220 Cass Ave · Mount Clemens, MI
Flood risk No data
- FEMA flood zone
- —
- Chance of flooding over 30 yrs
- —
- Est. flood insurance / yr
- —
Fire risk No data
- Est. fire insurance / yr
- —
Heat risk No data
- Hot days now (above threshold)
- —
- Hot days in 30 yrs
- —
Wind risk No data
- Chance of severe wind over 30 yrs
- —
Air-quality risk No data
- Unhealthy air days now
- —
- Unhealthy air days in 30 yrs
- —
Risk factors via First Street. Map © Google.
Why this score? — see what drove the C- grade
The composite is a weighted blend of 9 inputs, each scored 0–100. Each bar is that input's sub-score; the figure is the points it added to the 100-point composite (weight × sub-score).
- ARV discount +15.0/15.0
- Cash flow +14.6/30.0
- Rent growth +5.0/5.0
- DSCR +4.4/10.0
- 1% rule +4.0/10.0
- Livability +3.9/5.0
- Condition / age +2.5/5.0
- Schools +0.6/10.0
- Appreciation +0.0/10.0
$169,900
🖨 Deal sheet 📄 Offer letter ✓ Due diligence
Listing remarks MLS
Attorneys office in commercial zoning on Main Street in Mt. Clemens. Includes accessibility ramp to adjacent parking lot (60x230) also included in sale. 1/2 bath up and down, 3 offices down and 3 offices up- needs updating, however a great value on main road for your business. New furnace and central air. Subject to probate court approval. Taxes as listed here in the listing are for both parcels (and including parking lot).
Key facts
- New furnace
- Central air
- Accessibility ramp
Tags
Neighborhood map
What this means for you Summary
Snapshot
- This is a 3-bed/1.0-bath single-family listed at $170k.
Deal economics
- At list price, monthly cash flow is $39 ($473/yr) — positive.
- The deal already cash-flows at list — no discount required.
- To meet the 1% rule (rent ≥ 1% of price), the offer needs to be $154k (9.6% below list).
- Recommended offer: $154k (9.6% below list) — sets the bar for 1% rule.
- Cap rate 6.6% vs local median 3.5% in Mount Clemens — top-decile yield for the area; either an underpriced asset or a hidden risk that comps aren't pricing in. Stress-test before assuming the spread holds.
Location & tenants
- Location reads 77/100 on livability (#120 in MI, #2,918 nationally) — a middle-class / working-renter tenant base. Strengths: commute A+, cost of living A+, housing A+; Watch: schools D+, crime D+, amenities D+.
- Mount Clemens Community School District (suburban): math 4% / reading 11% proficiency, ranked #532 of 540 in MI (top 98%) — low school quality limits family demand, transient renter base, plan for 1-2y turnover; 80% free/reduced lunch — lower-income household profile, screen leases tightly.
- Market conditions: Rents rising fast (+10.8%/yr); 66 active listings in the ZIP; 13 comparable units currently listed for rent nearby; rentals leasing fast (median 2d on market — plan ~1-2 weeks tenant-placement turnaround); 1,321 units permitted in Macomb County in 2024 (86 in 5+ unit buildings).
- This rent runs 35% of the median local income ($52k/yr) — at the standard rent-burdened threshold; future hikes will face affordability resistance.
Forward outlook
- Local home prices are declining (-3.0%/yr); year-one equity from $1k of loan paydown is wiped out by about $5k of value loss. Plan a longer hold.
- Macomb County population projected at +9% by 2050 — modest demand growth; plan on rents tracking national, not racing it.
Negotiation context
- It's been on market 22 days — a 2% lower offer ($167k) is reasonable based on typical stale-listing flexibility.
- 5 sale attempts since 21y ago; this cycle's ask has dropped $20k (11%) from the opening price — seller is motivated, your offer sets the floor, not the list.
- Current owner paid $135k; 26% above their basis — modest negotiation headroom, anchor on the comps not their cost.
Risks & watch-outs
- Watch-outs: built in 1945 — expect roof / HVAC / electrical / plumbing capex.
Questions for the listing agent
- Built in 1945 — when were the roof, HVAC, electrical panel, plumbing, and water heater last replaced?
- Is there a deadline driving the sale (1031 exchange, divorce, estate, relocation)? That informs how much negotiation room exists.
- Schools are D-rated, which usually means shorter tenancies and higher turnover. Who's the typical renter profile here, and what's been the actual vacancy rate?
- Crime grade is D in this area — have there been break-ins, vandalism, or insurance claims at this property in the last 3 years? What carrier currently insures it and at what premium?
- What's the average days-on-market for RENTAL listings here right now (not sales)? A rising rental-DOM trend means longer vacancies and softer asking-rent achievability than the comps imply.
- What's the recent tenant-quality profile in this submarket — average credit score on applications, eviction rate, late-payment / NSF rate, and stable-employment percentage? A property-management company in the area should have these aggregated.
- How much new for-sale + rental construction is in the pipeline within 1–3 miles? Heavy new supply typically softens prices + rents 12–24 months out; constrained supply supports both.
Investment metrics
- 1% rule
- 0.90% ✗
- Cap rate
- 6.57%
- Cash-on-cash
- 0.99%
- DSCR
- 1.04
- GRM
- 9.2
CMA / ARV
- ARV (on-the-fly)
- $250,002
- Comps found
- 12
Show comp detail 12 sales within ~0.75 mi
| Address | Dist | Beds/Ba | Sqft | Sold | Price | $/sf | Match |
|---|---|---|---|---|---|---|---|
| 220 Cass Ave | 0.00mi | 3/1.0 | 1,462 (0%) | 0mo | $165,000 | $113 | 100 |
| 33 Ferrin Pl | 0.38mi | 3/1.0 | 1,525 (+4%) | 2mo | $125,000 | $82 | 74 |
| 9 Queen St | 0.40mi | 3/2.5 | 1,480 (+1%) | 1mo | $264,000 | $178 | 72 |
| 183 Washington St | 0.52mi | 3/1.5 | 1,445 (-1%) | 2mo | $250,000 | $173 | 70 |
| 129 South Ave | 0.50mi | 3/2.5 | 1,450 (-1%) | 1mo | $274,000 | $189 | 69 |
| 75 Church St | 0.34mi | 3/2.0 | 1,380 (-6%) | 5mo | $305,000 | $221 | 66 |
| 57 Madison Ave | 0.40mi | 3/2.0 | 1,380 (-6%) | 4mo | $209,900 | $152 | 65 |
| 142 Miller St | 0.46mi | 3/2.0 | 1,328 (-9%) | 4mo | $227,500 | $171 | 56 |
| 217 Jones St | 0.61mi | 3/1.0 | 1,330 (-9%) | 4mo | $141,000 | $106 | 53 |
| 60 Riverside Dr | 0.71mi | 4/2.0 (+1) | 1,522 (+4%) | 3mo | $260,000 | $171 | 49 |
| 104 Logan St | 0.60mi | 3/2.5 | 1,302 (-11%) | 5mo | $205,000 | $157 | 44 |
| 26 Hollywood Ct | 0.72mi | 3/1.0 | 1,260 (-14%) | 1mo | $170,500 | $135 | 42 |
Match score weights: distance 35% · size 25% · config 20% · recency 20%. Top-matched comps best support the ARV.
Projected returns pro-forma
-3.0% appreciation · 8.0% rent growth · sell at horizon
- IRR
- -9.2%
- Equity multiple
- 0.65×
- Total profit
- $-16,878
- Equity at exit
- $25,333
- IRR
- 5.9%
- Equity multiple
- 1.54×
- Total profit
- $25,581
- Equity at exit
- $14,690
Cash invested: $47,572 (down + closing). Projections, not guarantees.
Landlord ↔ Tenant lean methodology
- Overall (STATE)
- 62 Landlord-Friendly
- State Michigan
- 62 Landlord-Friendly · EVEN
- County
- — inherits STATE
- City
- — inherits STATE
ZIP-level market 48043
- Rents YoY
- 10.8%
- Active inventory
- 66
- Price-to-rent
- 9.2×
Monthly cashflow live
- Estimated rent
- $1,536 high interval (Pro) →
- Mortgage (P&I)
- −$891
- Tax est. 1.5%
- −$212 /mo · $2,548/yr
- Insurance
- −$71
- HOA
- −$0
- Vacancy / Maint / Mgmt
- −$323
- Net cashflow
- $39
Break-even live
UW: 25.0% down · 7.5% · 30yr · 1.5% tax · 5.0% vac · 8.0% maint · 8.0% mgmt
Financing live
Cash to close
- Down payment
- $42,475
- Closing costs
- $5,097
- Reserves months
- —
- Total cash needed
- —
Loan-product check · same deal, 3 products live
Conventional
25% down · 7.5% · 30yr
- Down + closing
- —
- Monthly P&I
- —
- Monthly cashflow
- —
- DSCR
- —
- Eligible?
- —
Personal DTI + credit; lowest rate.
DSCR
20% down · 8.5% · 30yr
- Down + closing
- —
- Monthly P&I
- —
- Monthly cashflow
- —
- DSCR
- —
- Eligible?
- —
No personal income docs; deal must DSCR.
Hard money
10% down · 12.0% · 12mo
- Down + closing
- —
- Monthly P&I
- —
- Monthly cashflow
- —
- DSCR
- —
- Eligible?
- —
Short-term bridge; refi at stabilization.
Rent comps 13 comps
| Address | Beds | Baths | Sqft | Rent | $/sqft | DOM | Units | Dist |
|---|---|---|---|---|---|---|---|---|
| 15 Washington St Unit 2 Mt Clemens, MI | 3.0 | 1.0 | 1396 | $1,400 | $1.00 | 43d | 1 | 0.05mi |
| 40 Ferrin Pl Mount Clemens, MI | 3.0 | 1.0 | 1400 | $1,700 | $1.21 | 1d | 1 | 0.36mi |
| 35 S Groesbeck Hwy Mt Clemens, MI | 1.0–2.0 | 1.0–1.5 | 1125 | $2,050 | $1.82 | 1d | 1 | 0.63mi |
| 64 Crocker Blvd Mt Clemens, MI | 2.0 | 1.0 | 950 | $1,250 | $1.32 | 43d | 1 | 0.70mi |
| 70 Crocker Blvd Mt Clemens, MI | 2.0 | 1.0 | 950 | $1,400 | $1.47 | 10d | 1 | 0.70mi |
| 121 Jones St Unit 2 Mt Clemens, MI | 2.0 | 1.0 | 1050 | $1,600 | $1.52 | 2d | 1 | 0.76mi |
| 121 Jones St Unit 1 Mt Clemens, MI | 2.0 | 1.0 | 1080 | $1,400 | $1.30 | 1d | 1 | 0.76mi |
| 277 N Rose St Mt Clemens, MI | 1.0–2.0 | 1.0 | 755 | $1,434 | $1.90 | 1d | 2 | 1.05mi |
| 133 S Christine Cir Unit 1 Mt Clemens, MI | 3.0 | 1.5 | 1040 | $1,500 | $1.44 | 1d | 1 | 1.09mi |
| 23128 Wellington Cres Clinton Twp, MI | 1.0–2.0 | 1.0 | 850 | $1,375 | $1.62 | 2d | 6 | 1.11mi |
| 176 N Christine Cir Unit 1 Mt Clemens, MI | 2.0 | 1.5 | 1020 | $1,300 | $1.27 | 43d | 1 | 1.14mi |
| 42510 Pinehurst Dr Clinton Twp, MI | 3.0 | 2.5 | 1845 | $2,600 | $1.41 | 4d | 1 | 1.23mi |
| 38539 Wellington Dr #19 Clinton Twp, MI | 2.0 | 1.0 | 1092 | $1,400 | $1.28 | 43d | 1 | 1.26mi |
Listing history 13 events
-
2026-04-04status Pending
Show marketing remark (427 chars)
Attorneys office in commercial zoning on Main Street in Mt. Clemens. Includes accessibility ramp to adjacent parking lot (60x230) also included in sale. 1/2 bath up and down, 3 offices down and 3 offices up- needs updating, however a great value on main road for your business. New furnace and central air. Subject to probate court approval. Taxes as listed here in the listing are for both parcels (and including parking lot).
-
2026-04-04status Pending 427-char remark
Show marketing remark (427 chars)
Attorneys office in commercial zoning on Main Street in Mt. Clemens. Includes accessibility ramp to adjacent parking lot (60x230) also included in sale. 1/2 bath up and down, 3 offices down and 3 offices up- needs updating, however a great value on main road for your business. New furnace and central air. Subject to probate court approval. Taxes as listed here in the listing are for both parcels (and including parking lot).
-
2026-03-23price $169,900 427-char remark
Show marketing remark (427 chars)
Attorneys office in commercial zoning on Main Street in Mt. Clemens. Includes accessibility ramp to adjacent parking lot (60x230) also included in sale. 1/2 bath up and down, 3 offices down and 3 offices up- needs updating, however a great value on main road for your business. New furnace and central air. Subject to probate court approval. Taxes as listed here in the listing are for both parcels (and including parking lot).
-
2026-03-23price $169,900
Show marketing remark (427 chars)
Attorneys office in commercial zoning on Main Street in Mt. Clemens. Includes accessibility ramp to adjacent parking lot (60x230) also included in sale. 1/2 bath up and down, 3 offices down and 3 offices up- needs updating, however a great value on main road for your business. New furnace and central air. Subject to probate court approval. Taxes as listed here in the listing are for both parcels (and including parking lot).
-
2026-03-13$189,900 Active
Show marketing remark (427 chars)
Attorneys office in commercial zoning on Main Street in Mt. Clemens. Includes accessibility ramp to adjacent parking lot (60x230) also included in sale. 1/2 bath up and down, 3 offices down and 3 offices up- needs updating, however a great value on main road for your business. New furnace and central air. Subject to probate court approval. Taxes as listed here in the listing are for both parcels (and including parking lot).
-
2026-03-13$189,900 Active 427-char remark
Show marketing remark (427 chars)
Attorneys office in commercial zoning on Main Street in Mt. Clemens. Includes accessibility ramp to adjacent parking lot (60x230) also included in sale. 1/2 bath up and down, 3 offices down and 3 offices up- needs updating, however a great value on main road for your business. New furnace and central air. Subject to probate court approval. Taxes as listed here in the listing are for both parcels (and including parking lot).
-
2006-02-24soldstatus $135,000 409-char remark
Show marketing remark (409 chars)
Zoned multiple - Family low density residential district (RMI) Meticously clean & tastefully decorated. Property has legal non conforming use of professional office. Reception area 14x11.10. Office 1 - 19.3x11.10 Office 2 - 13.5x11 Office 3 - 14x12.3 Office 4 - 13.10x11.8 Office 5 - 11.10x8.8. Accounting office 12.7x8.6. Foyer 7.5x5.6. Finished basement with kitchen. Enclosed porch 11.9x5.9 (storage)
-
2006-02-23historical 409-char remark
Show marketing remark (409 chars)
Zoned multiple - Family low density residential district (RMI) Meticously clean & tastefully decorated. Property has legal non conforming use of professional office. Reception area 14x11.10. Office 1 - 19.3x11.10 Office 2 - 13.5x11 Office 3 - 14x12.3 Office 4 - 13.10x11.8 Office 5 - 11.10x8.8. Accounting office 12.7x8.6. Foyer 7.5x5.6. Finished basement with kitchen. Enclosed porch 11.9x5.9 (storage)
-
2006-02-23historical
Show marketing remark (409 chars)
Zoned multiple - Family low density residential district (RMI) Meticously clean & tastefully decorated. Property has legal non conforming use of professional office. Reception area 14x11.10. Office 1 - 19.3x11.10 Office 2 - 13.5x11 Office 3 - 14x12.3 Office 4 - 13.10x11.8 Office 5 - 11.10x8.8. Accounting office 12.7x8.6. Foyer 7.5x5.6. Finished basement with kitchen. Enclosed porch 11.9x5.9 (storage)
-
2006-01-04$139,500 409-char remark
Show marketing remark (409 chars)
Zoned multiple - Family low density residential district (RMI) Meticously clean & tastefully decorated. Property has legal non conforming use of professional office. Reception area 14x11.10. Office 1 - 19.3x11.10 Office 2 - 13.5x11 Office 3 - 14x12.3 Office 4 - 13.10x11.8 Office 5 - 11.10x8.8. Accounting office 12.7x8.6. Foyer 7.5x5.6. Finished basement with kitchen. Enclosed porch 11.9x5.9 (storage)
-
2006-01-03$139,500
-
2006-01-03historical
-
2005-06-02$150,000
ⓘ Source: listings_history table (triggers on properties + properties_extension) + one-shot
backfill from property_details.listing_events for pre-trigger history.
Nearby sold comps map
Loading sold comps map…
Walkable amenities ~0.75 mi
Loading nearby amenities…
Taxation est. · year 1
- Rental income
- $18,434
- − Mortgage interest
- −$9,517
- − Property taxes
- −$2,548
- − Insurance
- −$850
- − Repairs & maintenance
- −$1,475
- − Management
- −$1,475
- − Depreciation
- −$4,943
- Taxable loss
- −$2,373
- Est. tax savings @ 24.0%
- +$570
- After-tax cash flow
- $1,043/yr
For passive investors: Depreciation is non-cash, so a rental often shows a tax loss while cash-flowing — sheltering income. Rental losses are passive: they offset passive income freely, and up to $25,000/yr can offset ordinary (W-2) income if you actively participate and your MAGI is under $100k (phasing out to $0 by $150k); unused losses carry forward. On sale, claimed depreciation is recaptured at up to 25%, and gains may owe capital-gains tax (a 1031 exchange can defer both). Figures are a year-1 estimate at your 24.0% rate — not tax advice; consult a CPA.
Schools (NCES district)
- District
- Mount Clemens Community School District
- NCES district ID
- 2624690
- Math proficiency
- 4% ▼ -9.00%
- Reading proficiency
- 11% ▼ -7.00%
- Median HH income
- $36,632
- Composite
- 6.25/100
- National rank
- #10005
- State rank
- #532 of 540 in MI
Livability — Mount Clemens
- Score
- 77/100
- State rank
- #120
- US rank
- #2918
Category grades
Schools grade is shown separately in the Schools card above.
Census & demographics
- Census place
- Mount Clemens, MI
- County
- Macomb County · 638,552 people
- City population
- 15,429
- Metro
- Detroit-Warren-Dearborn, MI
- Population (ZIP)
- 15,429
- Household income
- $52,161
- Rent vs Own
- Severe rent burden
- 610.0
Population outlook (Macomb County) Hauer SSP2
- Today (2025)
- 925,296 people
- By 2030
- 948,226 · +2.5%
- By 2040
- 983,961 · +6.3%
- By 2050
- 1,010,200 · +9.2%
- By 2075
- 1,076,222 · +16.3%
- By 2100
- 1,077,065 · +16.4%
Race, ethnicity, and origin ACS 2023
- Neighborhood character
- Majority White (65%)
- Race & ethnicity
- White 65% Black 22% Two or more races 10% Hispanic / Latino 4%
- Common ancestry
- Romanian 10% Lithuanian 4% Slovak 2%
- Foreign-born
- 2% · Canada
- Languages at home
- 96% English-only · Spanish 2% Russian/Polish/Slavic 1%
Political lean MEDSL · Macomb
- 2024 margin
- R (+13.7) · D 42.2% · R 55.9% · Other 1.9%
- 2008→2024 swing
- -22.3pp toward R · 2008: 8.6pp · 2024: -13.7pp
- All cycles
- 2024: R+13.7 2020: R+8.1 2016: R+11.6 2012: D+4.0 2008: D+8.6
Not yet ingested
- Civics
- —
Market trends
- HPI YoY
- ▼ -194.74%
- Current HPI
- 260.7139
- Rent YoY
- ▲ 10.82%
- Metro
- Detroit-Warren-Dearborn, MI
- State GDP YoY
- ▲ 1.37%
- F500 in state
- 28
Industry mix (Fortune 500 HQ in MI)
| Industry | F500 HQs | Revenue |
|---|---|---|
| Automotive Parts | 3 | $48B |
|
||
| Automotive | 2 | $372B |
|
||
| Chemicals | 1 | $45B |
|
||
| Automotive Retail | 1 | $29B |
|
||
| Healthcare / Medical Devices | 1 | $23B |
|
||
| Automotive Technology | 1 | $20B |
|
||
Price history
+13.3% since first listed13 events — show timeline
- 2026-04-04 Pending — REALCOMP
- 2026-04-04 Pending — MiRealSource-MiMLS
- 2026-03-23 Price Changed $169,900 MiRealSource-MiMLS
- 2026-03-23 Price Changed $169,900 REALCOMP
- 2026-03-13 Listed $189,900 MiRealSource-MiMLS
- 2026-03-13 Listed $189,900 REALCOMP
- 2006-02-24 Sold (MLS) $135,000 MiRealSource-MiMLS
- 2006-02-23 Listing Removed — MiRealSource-MiMLS
- 2006-02-23 Listing Removed — MiRealSource-MiMLS
- 2006-01-04 Listed $139,500 MiRealSource-MiMLS
- 2006-01-03 Listing Removed — MiRealSource-MiMLS
- 2006-01-03 Listed $139,500 MiRealSource-MiMLS
- 2005-06-02 Listed $150,000 MiRealSource-MiMLS
Cash-flow waterfall
monthlySold comps — $/sqft
last 12 mo · ≤1 miLoading sold comps…