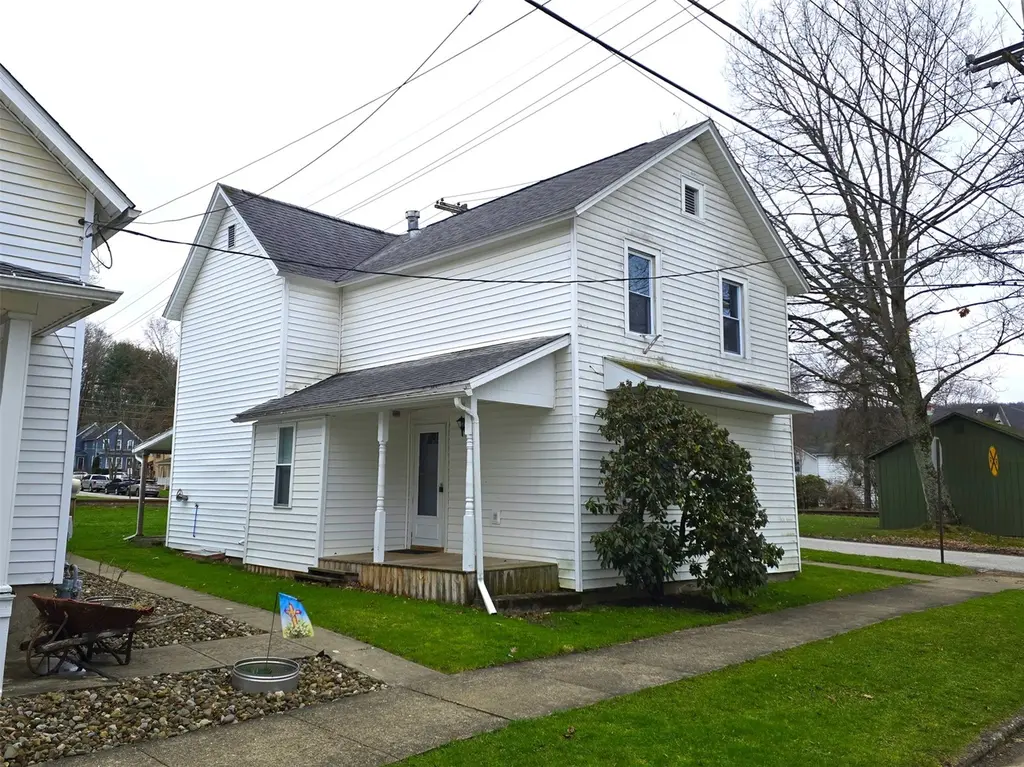
301 Bank St · Titusville, PA
Flood risk 1/10 · Minimal
- FEMA flood zone
- X (unshaded)
- Chance of flooding over 30 yrs
- 0.0%
- Est. flood insurance / yr
- $473 – $860
Fire risk 2/10 · Minimal
- Est. fire insurance / yr
- $511 – $949
Heat risk 2/10 · Minimal
- Hot days now (above 92°F)
- 8 days/yr
- Hot days in 30 yrs
- 19 days/yr
Wind risk 1/10 · Minimal
- Chance of severe wind over 30 yrs
- —
Air-quality risk 2/10 · Minimal
- Unhealthy air days now
- 0 days/yr
- Unhealthy air days in 30 yrs
- 1 days/yr
Risk factors via First Street. Map © Google.
Why this score? — see what drove the B grade
The composite is a weighted blend of 9 inputs, each scored 0–100. Each bar is that input's sub-score; the figure is the points it added to the 100-point composite (weight × sub-score).
- Cash flow +29.1/30.0
- ARV discount +11.3/15.0
- DSCR +10.0/10.0
- 1% rule +7.4/10.0
- Livability +4.2/5.0
- Schools +3.7/10.0
- Rent growth +2.5/5.0
- Condition / age +2.5/5.0
- Appreciation +0.0/10.0
$97,000
🖨 Deal sheet 📄 Offer letter ✓ Due diligence
Listing remarks MLS
Well maintained, 2 unit investment property features newer roof, a new GFA furnace, new carpeting, new hot water heater, new front stoop, side & rear porches, new countertop in lower unit, & interior paint. Lower unit is a one bedroom & upper unit is 2 bedrooms. Both units have stoves & refrigerators. This property could be reverted back into a one family home.
Key facts
- 2,614 sq ft lot
- Parking
- Built 1930
Neighborhood map
What this means for you Summary
Snapshot
- This is a 4-bed/2.0-bath single-family listed at $97k.
Deal economics
- At list price, monthly cash flow is $336 ($4k/yr) — positive.
- The deal already cash-flows at list — no discount required.
- Meets the 1% rule at list price ($1k rent vs $97k).
- Recommended offer: $96k (1.5% below list) — sets the bar for market timing.
Location & tenants
- Location reads 84/100 on livability (#104 in PA, #777 nationally) — a professional / high-income tenant draw. Strengths: commute A+, cost of living A+, health & safety A+; Watch: amenities F, employment F.
- Titusville Area SD (town): math 35% / reading 55% proficiency, ranked #287 of 539 in PA (top 53%) — families likely to look elsewhere, expect single-tenant / working-renter base with shorter leases.
- Market conditions: 32 active listings in the ZIP; 83 units permitted in Crawford County in 2024 (0 in 5+ unit buildings).
Forward outlook
- Local home prices are declining (-3.0%/yr); year-one equity from $671 of loan paydown is wiped out by about $3k of value loss. Plan a longer hold.
- Crawford County population projected at -22% by 2050 — secular population decline; favor cash flow + early exit over multi-decade hold.
- At projected returns (-3.0% appreciation + 3.0% rent growth), your $27k cash investment doubles in ~8 years — after that, you're playing with house money.
Negotiation context
- It's been on market 26 days — a 2% lower offer ($96k) is reasonable based on typical stale-listing flexibility.
- 2 sale attempts with the ask held roughly flat each time — persistent listings suggest the price (not the market) is what's stuck; bring a comps-based counter.
- Current owner paid $42k; list at $97k implies a 131% gain — meaningful room to come down on a strong offer.
Risks & watch-outs
- Watch-outs: built in 1930 — expect roof / HVAC / electrical / plumbing capex.
Questions for the listing agent
- Built in 1930 — when were the roof, HVAC, electrical panel, plumbing, and water heater last replaced?
- Is there a deadline driving the sale (1031 exchange, divorce, estate, relocation)? That informs how much negotiation room exists.
- Schools are B-rated — typically a magnet for longer-tenancy family renters. What's the average tenant stay here, and is there a school-zone premium baked into asking?
- What's the average days-on-market for RENTAL listings here right now (not sales)? A rising rental-DOM trend means longer vacancies and softer asking-rent achievability than the comps imply.
- What's the recent tenant-quality profile in this submarket — average credit score on applications, eviction rate, late-payment / NSF rate, and stable-employment percentage? A property-management company in the area should have these aggregated.
- How much new for-sale + rental construction is in the pipeline within 1–3 miles? Heavy new supply typically softens prices + rents 12–24 months out; constrained supply supports both.
Investment metrics
- 1% rule
- 1.24% ✓
- Cap rate
- 10.45%
- Cash-on-cash
- 14.85%
- DSCR
- 1.66
- GRM
- 6.7
CMA / ARV
- ARV (on-the-fly)
- $105,980
- Comps found
- 12
Show comp detail 12 sales within ~0.75 mi
| Address | Dist | Beds/Ba | Sqft | Sold | Price | $/sf | Match |
|---|---|---|---|---|---|---|---|
| 425 East Spruce St | 0.55mi | 3/1.5 (-1) | 1,484 (-2%) | 3mo | $30,000 | $20 | 62 |
| 403 East Main St | 0.37mi | 4/2.0 | 1,716 (+13%) | 5mo | $93,800 | $55 | 56 |
| 411 North Brown St | 0.60mi | 3/2.0 (-1) | 1,600 (+6%) | 3mo | $138,500 | $87 | 55 |
| 110 Breed St | 0.25mi | 4/2.0 | 1,741 (+15%) | 11mo | $40,000 | $23 | 54 |
| 218 Brook St | 0.66mi | 4/2.0 | 1,568 (+4%) | 14mo | $130,000 | $83 | 52 |
| 415 N Franklin St | 0.64mi | 3/1.0 (-1) | 1,504 (-1%) | 10mo | $106,000 | $70 | 52 |
| 421 East Spruce St | 0.54mi | 3/1.5 (-1) | 1,547 (+2%) | 19mo | $88,500 | $57 | 48 |
| 518 Dairy St | 0.39mi | 3/1.0 (-1) | 1,340 (-12%) | 14mo | $117,950 | $88 | 42 |
| 996 National Forge Rd | 0.34mi | 3/3.0 (-1) | 1,320 (-13%) | 14mo | $130,000 | $98 | 42 |
| 430 North Drake St | 0.62mi | 3/2.5 (-1) | 1,560 (+3%) | 20mo | $68,000 | $44 | 42 |
| 113 Union St | 0.68mi | 3/2.5 (-1) | 1,644 (+9%) | 6mo | $107,000 | $65 | 42 |
| 315 W Elm St | 0.74mi | 3/1.5 (-1) | 1,360 (-10%) | 13mo | $110,000 | $81 | 30 |
Match score weights: distance 35% · size 25% · config 20% · recency 20%. Top-matched comps best support the ARV.
Projected returns pro-forma
-3.0% appreciation · 3.0% rent growth · sell at horizon
- IRR
- 5.4%
- Equity multiple
- 1.21×
- Total profit
- $5,668
- Equity at exit
- $14,463
- IRR
- 14.8%
- Equity multiple
- 2.19×
- Total profit
- $32,426
- Equity at exit
- $8,387
Cash invested: $27,160 (down + closing). Projections, not guarantees.
Landlord ↔ Tenant lean methodology
- Overall (STATE)
- 62 Landlord-Friendly
- State Pennsylvania
- 62 Landlord-Friendly · EVEN
- County
- — inherits STATE
- City
- — inherits STATE
ZIP-level market 16354
- Home prices YoY
- -5.3%
- Active inventory
- 32
- Price-to-rent
- 6.7×
Monthly cashflow live
- Estimated rent
- $1,201 medium interval (Pro) →
- Mortgage (P&I)
- −$509
- Tax from tax record
- −$64 /mo · $762/yr
- Insurance
- −$40
- HOA
- −$0
- Vacancy / Maint / Mgmt
- −$252
- Net cashflow
- $336
Break-even live
UW: 25.0% down · 7.5% · 30yr · 1.5% tax · 5.0% vac · 8.0% maint · 8.0% mgmt
Financing live
Cash to close
- Down payment
- $24,250
- Closing costs
- $2,910
- Reserves months
- —
- Total cash needed
- —
Loan-product check · same deal, 3 products live
Conventional
25% down · 7.5% · 30yr
- Down + closing
- —
- Monthly P&I
- —
- Monthly cashflow
- —
- DSCR
- —
- Eligible?
- —
Personal DTI + credit; lowest rate.
DSCR
20% down · 8.5% · 30yr
- Down + closing
- —
- Monthly P&I
- —
- Monthly cashflow
- —
- DSCR
- —
- Eligible?
- —
No personal income docs; deal must DSCR.
Hard money
10% down · 12.0% · 12mo
- Down + closing
- —
- Monthly P&I
- —
- Monthly cashflow
- —
- DSCR
- —
- Eligible?
- —
Short-term bridge; refi at stabilization.
Listing history 6 events
-
2026-04-27status Pending
-
2026-04-02historical $97,000
-
2026-03-31$97,000
-
2026-03-29$97,000 Active
-
2019-02-22soldstatus $42,000
-
2019-02-21soldstatus $42,000 386-char remark
Show marketing remark (386 chars)
Well maintained, 2 unit investment property features newer roof, a new GFA furnace, new carpeting, new hot water heater, new front stoop, side & rear porches, new countertop in lower unit, & interior paint. Lower unit is a one bedroom & upper unit is 2 bedrooms. Both units have stoves & refrigerators. This property could be reverted back into a one family home.
ⓘ Source: listings_history table (triggers on properties + properties_extension) + one-shot
backfill from property_details.listing_events for pre-trigger history.
Tax reassessment forecast PA · Partial reset (capped growth)
- Current annual tax
- $762 · $64/mo
- Projected year-2 tax
- $1,147 · $96/mo
- Expected delta
- +$385/yr (+$32/mo · 50.5%)
ⓘ Screening estimate from a state-policy table — verify with the county assessor before closing.
Climate risk First Street
- Flood 1/10 Low FEMA zone X (unshaded) · 0% chance over 30 yrs
- Wildfire 2/10 Low
- Heat 2/10 Low 8 d/yr ≥92°F today · 19 d/yr by 30 yrs out
- Wind 1/10 Low
- Air quality 2/10 Low 0 unhealthy d/yr today · 1 by 30 yrs out
Nearby sold comps map
Loading sold comps map…
Walkable amenities ~0.75 mi
Loading nearby amenities…
Taxation est. · year 1
- Rental income
- $14,410
- − Mortgage interest
- −$5,434
- − Property taxes
- −$762
- − Insurance
- −$485
- − Repairs & maintenance
- −$1,153
- − Management
- −$1,153
- − Depreciation
- −$2,822
- Taxable income
- $2,602
- Est. tax owed @ 24.0%
- −$624
- After-tax cash flow
- $3,408/yr
For passive investors: Depreciation is non-cash, so a rental often shows a tax loss while cash-flowing — sheltering income. Rental losses are passive: they offset passive income freely, and up to $25,000/yr can offset ordinary (W-2) income if you actively participate and your MAGI is under $100k (phasing out to $0 by $150k); unused losses carry forward. On sale, claimed depreciation is recaptured at up to 25%, and gains may owe capital-gains tax (a 1031 exchange can defer both). Figures are a year-1 estimate at your 24.0% rate — not tax advice; consult a CPA.
Schools (NCES district)
- District
- Titusville Area SD
- NCES district ID
- 4223490
- Math proficiency
- 35% ▼ -9.00%
- Reading proficiency
- 55% ▼ -10.00%
- Median HH income
- $38,179
- Composite
- 37.43/100
- National rank
- #4418
- State rank
- #287 of 539 in PA
Livability — Titusville
- Score
- 84/100
- State rank
- #104
- US rank
- #777
Category grades
Schools grade is shown separately in the Schools card above.
Census & demographics
- Census place
- Titusville, PA
- Population (ZIP)
- 10,120
Population outlook (Crawford County) Hauer SSP2
- Today (2025)
- 81,399 people
- By 2030
- 77,977 · -4.2%
- By 2040
- 70,659 · -13.2%
- By 2050
- 63,841 · -21.6%
- By 2075
- 50,198 · -38.3%
- By 2100
- 37,898 · -53.4%
Race, ethnicity, and origin ACS 2023
- Neighborhood character
- Predominantly White (95%)
- Race & ethnicity
- White 95% Two or more races 2%
- Common ancestry
- Romanian 5% Serbian 3% Iranian 3%
- Foreign-born
- 1% · South Korea
Political lean MEDSL · Crawford
- 2024 margin
- Solid R (+39.2) · D 30.0% · R 69.2%
- 2008→2024 swing
- -28.8pp toward R · 2008: -10.4pp · 2024: -39.2pp
- All cycles
- 2024: R+39.2 2020: R+37.2 2016: R+38.5 2012: R+19.6 2008: R+10.4
Not yet ingested
- Civics
- —
Market trends
- HPI YoY
- ▼ -12.41%
- Current HPI
- 221.8311
- Rent YoY
- —
- Metro
- —
- State GDP YoY
- ▲ 1.68%
- F500 in state
- 34
Industry mix (Fortune 500 HQ in PA)
| Industry | F500 HQs | Revenue |
|---|---|---|
| Healthcare | 2 | $309B |
|
||
| Insurance | 2 | $27B |
|
||
| Telecommunications / Media | 1 | $124B |
|
||
| Industrial Distribution | 1 | $22B |
|
||
| Financial Services | 1 | $20B |
|
||
| Chemicals / Materials | 1 | $18B |
|
||
Price history
+131.0% since first listed6 events — show timeline
- 2026-04-27 Pending — GEBOR
- 2026-04-02 Rental Removed $97,000 GEBOR
- 2026-03-31 Listed for Rent $97,000 GEBOR
- 2026-03-29 Listed $97,000 GEBOR
- 2019-02-22 Sold (Public Records) $42,000 Public Records
- 2019-02-21 Sold (MLS) $42,000 AVBREALTORS
Property tax history
+10.2%/yrLatest (2025): $762 · +2.7% YoY. Source: county tax records.
Cash-flow waterfall
monthlySold comps — $/sqft
last 12 mo · ≤1 miLoading sold comps…