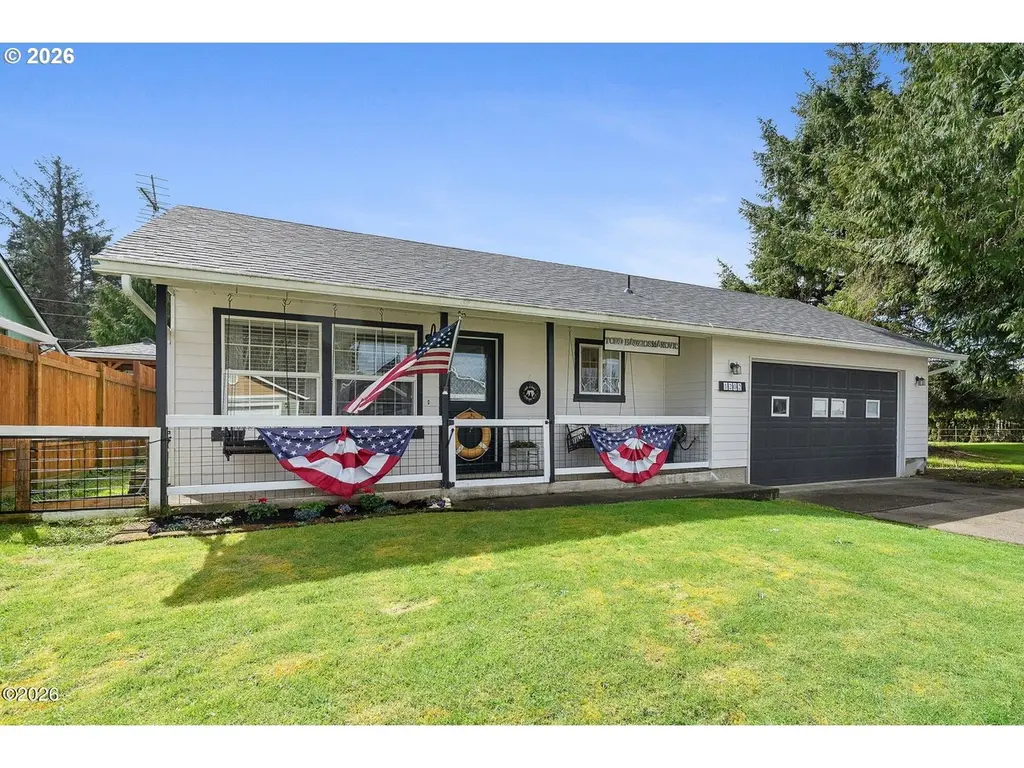
1202 N 1st Ave · Rockaway Beach, OR
Flood risk 6/10 · Moderate
- FEMA flood zone
- X (unshaded)
- Chance of flooding over 30 yrs
- 0.69%
- Est. flood insurance / yr
- $507 – $1,088
Fire risk 2/10 · Minimal
- Est. fire insurance / yr
- $498 – $926
Heat risk 1/10 · Minimal
- Hot days now (above 76°F)
- 9 days/yr
- Hot days in 30 yrs
- 20 days/yr
Wind risk 1/10 · Minimal
- Chance of severe wind over 30 yrs
- —
Air-quality risk 6/10 · Moderate
- Unhealthy air days now
- 8 days/yr
- Unhealthy air days in 30 yrs
- 9 days/yr
Risk factors via First Street. Map © Google.
Why this score? — see what drove the C grade
The composite is a weighted blend of 9 inputs, each scored 0–100. Each bar is that input's sub-score; the figure is the points it added to the 100-point composite (weight × sub-score).
- Cash flow +24.8/30.0
- DSCR +8.0/10.0
- ARV discount +6.2/15.0
- 1% rule +5.4/10.0
- Schools +4.2/10.0
- Livability +3.7/5.0
- Rent growth +2.5/5.0
- Condition / age +2.5/5.0
- Appreciation +0.0/10.0
$449,000
🖨 Deal sheet 📄 Offer letter ✓ Due diligence
Listing remarks MLS
Located in the heart of Rockaway Beach! Nice single-level home with vaulted ceilings—roomy, kitchen/dining area for gatherings. Enjoy the covered backyard patio with a fenced yard. Great for barbecues and sheltered from the wind. There's a nice dog run located on the east side of the house & a converted office space off the garage, adding privacy for remote workers! Nicely landscaped and ready as your getaway, secondary, or primary residence at the beach. Located out of the flood zone. Newer roof with a warranty.
Key facts
- Landscaped
- Fenced yard
- Newer roof
Tags
Neighborhood map
What this means for you Summary
Snapshot
- This is a 3-bed/2.0-bath single-family listed at $449k.
Deal economics
- At list price, monthly cash flow is $952 ($11k/yr) — positive.
- The deal already cash-flows at list — no discount required.
- Meets the 1% rule at list price ($5k rent vs $449k).
- Recommended offer: $422k (6.0% below list) — sets the bar for market timing.
- Cap rate 8.8% vs local median 6.6% in Rockaway Beach — top-decile yield for the area; either an underpriced asset or a hidden risk that comps aren't pricing in. Stress-test before assuming the spread holds.
Location & tenants
- Location reads 74/100 on livability (#94 in OR, #4,777 nationally) — a middle-class / working-renter tenant base. Strengths: crime A+, housing A+, cost of living A-; Watch: health & safety C-, employment D, amenities F.
- Neah-Kah-Nie SD 56 (rural): math 39% / reading 55% proficiency, ranked #62 of 183 in OR (top 34%) — families likely to look elsewhere, expect single-tenant / working-renter base with shorter leases.
- Market conditions: 126 active listings in the ZIP; 2 comparable units currently listed for rent nearby; 86 units permitted in Tillamook County in 2024 (0 in 5+ unit buildings).
Forward outlook
- Local home prices are declining (-3.0%/yr); year-one equity from $3k of loan paydown is wiped out by about $13k of value loss. Plan a longer hold.
- Tillamook County population projected at +3% by 2050 — modest demand growth; plan on rents tracking national, not racing it.
Negotiation context
- It's been on market 75 days — a 6% lower offer ($422k) is reasonable based on typical stale-listing flexibility.
- 6 sale attempts since 26y ago with the ask held roughly flat each time — persistent listings suggest the price (not the market) is what's stuck; bring a comps-based counter.
- Current owner paid $365k; 23% above their basis — modest negotiation headroom, anchor on the comps not their cost.
Risks & watch-outs
- Climate carrying-cost: major flood risk — expect insurance premiums to compound above CPI over the hold.
Questions for the listing agent
- It's been on market 75 days. Have you received any prior offers? Is the seller open to a 6% concession, seller financing, or rate buy-down credit?
- Why hasn't it sold? Are there any deal-killer items the seller is aware of (foundation, flood, title, zoning, code violations)?
- Is there a deadline driving the sale (1031 exchange, divorce, estate, relocation)? That informs how much negotiation room exists.
- What's the average days-on-market for RENTAL listings here right now (not sales)? A rising rental-DOM trend means longer vacancies and softer asking-rent achievability than the comps imply.
- What's the recent tenant-quality profile in this submarket — average credit score on applications, eviction rate, late-payment / NSF rate, and stable-employment percentage? A property-management company in the area should have these aggregated.
- How much new for-sale + rental construction is in the pipeline within 1–3 miles? Heavy new supply typically softens prices + rents 12–24 months out; constrained supply supports both.
Investment metrics
- 1% rule
- 1.04% ✓
- Cap rate
- 8.84%
- Cash-on-cash
- 9.09%
- DSCR
- 1.40
- GRM
- 8.0
CMA / ARV
- ARV (median comp)
- $436,399
- List price
- $449,000
- Delta
- 2.89%
- Verdict
- FAIR
- Comps
- 20 within 1.0 mi
Show comp detail 12 sales within ~0.75 mi
| Address | Dist | Beds/Ba | Sqft | Sold | Price | $/sf | Match |
|---|---|---|---|---|---|---|---|
| 123 S Ocean St | 0.09mi | 2/2.0 (-1) | 1,308 (+5%) | 8mo | $407,000 | $311 | 76 |
| 407 S 2nd Ave | 0.31mi | 2/2.0 (-1) | 1,327 (+6%) | 6mo | $314,000 | $237 | 65 |
| 250 N Harbor St | 0.14mi | 2/2.0 (-1) | 1,093 (-12%) | 4mo | $455,000 | $416 | 64 |
| 247 S Dolphin St | 0.37mi | 4/1.0 (+1) | 1,272 (+2%) | 9mo | $349,000 | $274 | 63 |
| 101 S Quadrant St | 0.14mi | 3/3.0 | 1,410 (+13%) | 6mo | $435,000 | $309 | 63 |
| 243 S Grayling St | 0.29mi | 3/2.0 | 1,067 (-14%) | 0mo | $499,000 | $468 | 62 |
| 115 N Miller St Unit 303 I | 0.46mi | 2/2.0 (-1) | 1,320 (+6%) | 3mo | $43,250 | $33 | 62 |
| 115 N Miller St #103 | 0.46mi | 2/2.0 (-1) | 1,320 (+6%) | 4mo | $32,000 | $24 | 61 |
| 115 N Miller St Unit 103 I | 0.46mi | 2/2.0 (-1) | 1,320 (+6%) | 4mo | $32,000 | $24 | 61 |
| 115 N Miller St #103 | 0.46mi | 2/2.0 (-1) | 1,320 (+6%) | 8mo | $29,900 | $23 | 58 |
| 115 N Miller St Unit 103 Trk H | 0.46mi | 2/2.0 (-1) | 1,320 (+6%) | 8mo | $29,900 | $23 | 58 |
| 711 N 6th St | 0.44mi | 2/2.0 (-1) | 1,128 (-10%) | 3mo | $700,000 | $621 | 56 |
Match score weights: distance 35% · size 25% · config 20% · recency 20%. Top-matched comps best support the ARV.
Projected returns pro-forma
-3.0% appreciation · 3.0% rent growth · sell at horizon
- IRR
- -2.6%
- Equity multiple
- 0.90×
- Total profit
- $-12,269
- Equity at exit
- $66,947
- IRR
- 7.1%
- Equity multiple
- 1.53×
- Total profit
- $66,779
- Equity at exit
- $38,821
Cash invested: $125,720 (down + closing). Projections, not guarantees.
Landlord ↔ Tenant lean methodology
- Overall (STATE)
- 28 Tenant-Leaning
- State Oregon
- 28 Tenant-Leaning · D+6
- County
- — inherits STATE
- City
- — inherits STATE
ZIP-level market 97136
- Home prices YoY
- -34.6%
- Active inventory
- 126
- Price-to-rent
- 8.0×
Monthly cashflow live
- Estimated rent
- $4,671 medium interval (Pro) →
- Mortgage (P&I)
- −$2,355
- Tax from tax record
- −$196 /mo · $2,354/yr
- Insurance
- −$187
- HOA
- −$0
- Vacancy / Maint / Mgmt
- −$981
- Net cashflow
- $952
Break-even live
UW: 25.0% down · 7.5% · 30yr · 1.5% tax · 5.0% vac · 8.0% maint · 8.0% mgmt
Financing live
Cash to close
- Down payment
- $112,250
- Closing costs
- $13,470
- Reserves months
- —
- Total cash needed
- —
Loan-product check · same deal, 3 products live
Conventional
25% down · 7.5% · 30yr
- Down + closing
- —
- Monthly P&I
- —
- Monthly cashflow
- —
- DSCR
- —
- Eligible?
- —
Personal DTI + credit; lowest rate.
DSCR
20% down · 8.5% · 30yr
- Down + closing
- —
- Monthly P&I
- —
- Monthly cashflow
- —
- DSCR
- —
- Eligible?
- —
No personal income docs; deal must DSCR.
Hard money
10% down · 12.0% · 12mo
- Down + closing
- —
- Monthly P&I
- —
- Monthly cashflow
- —
- DSCR
- —
- Eligible?
- —
Short-term bridge; refi at stabilization.
Rent comps 2 comps
| Address | Beds | Baths | Sqft | Rent | $/sqft | DOM | Units | Dist |
|---|---|---|---|---|---|---|---|---|
| 406 N 3rd Ave Rockaway Beach, OR | 2.0 | 1.0 | 762 | $3,000 | $3.94 | 43d | 1 | 0.29mi |
| 145 N Dolphin St Rockaway Beach, OR | 2.0 | 2.0 | 1020 | $6,000 | $5.88 | 43d | 1 | 0.31mi |
Listing history 27 events
-
2026-06-18days on market $449,000 Active 75 DOM
-
2026-06-17days on market $449,000 Active 74 DOM
-
2026-06-16days on market $449,000 Active 73 DOM
-
2026-06-15days on market $449,000 Active 72 DOM
-
2026-06-13days on market $449,000 Active 70 DOM
-
2026-06-12days on market $449,000 Active 69 DOM
-
2026-06-09days on market $449,000 Active 66 DOM
-
2026-06-08days on market $449,000 Active 65 DOM
-
2026-06-08days on market $449,000 Active 64 DOM
-
2026-06-07days on market $449,000 Active 63 DOM
-
2026-06-04days on market $449,000 Active 60 DOM
-
2026-06-02days on market $449,000 Active 59 DOM
-
2026-06-01days on market $449,000 Active 58 DOM
-
2026-05-31days on market $449,000 Active 57 DOM
-
2026-04-04$449,000 Active 528-char remark
Show marketing remark (528 chars)
Located in the heart of Rockaway Beach! Nice single-level home with vaulted ceilings—roomy, kitchen/dining area for gatherings. Enjoy the covered backyard patio with a fenced yard. Great for barbecues and sheltered from the wind. There's a nice dog run located on the east side of the house & a converted office space off the garage, adding privacy for remote workers! Nicely landscaped and ready as your getaway, secondary, or primary residence at the beach. Located out of the flood zone. Newer roof with a warranty.
-
2026-04-03$449,000 Active 528-char remark
Show marketing remark (528 chars)
Located in the heart of Rockaway Beach! Nice single-level home with vaulted ceilings—roomy, kitchen/dining area for gatherings. Enjoy the covered backyard patio with a fenced yard. Great for barbecues and sheltered from the wind. There's a nice dog run located on the east side of the house & a converted office space off the garage, adding privacy for remote workers! Nicely landscaped and ready as your getaway, secondary, or primary residence at the beach. Located out of the flood zone. Newer roof with a warranty.
-
2022-02-25price $435,000
-
2022-02-07$150,000
-
2021-03-29soldstatus $365,000
-
2021-03-29soldstatus $365,000
-
2021-02-27$349,900
-
2013-12-30soldstatus $165,000
-
2013-12-30soldstatus $165,000
-
2013-06-02$179,900
-
2001-02-15soldstatus $130,000
-
2001-02-15soldstatus $130,000
-
2000-09-25$130,000
ⓘ Source: listings_history table (triggers on properties + properties_extension) + one-shot
backfill from property_details.listing_events for pre-trigger history.
Tax reassessment forecast OR · Resets to sale price
- Current annual tax
- $2,354 · $196/mo
- Projected year-2 tax
- $4,355 · $363/mo
- Expected delta
- +$2,002/yr (+$167/mo · 85.1%)
ⓘ Screening estimate from a state-policy table — verify with the county assessor before closing.
Climate risk First Street
- Flood 6/10 Major FEMA zone X (unshaded) · 69% chance over 30 yrs
- Wildfire 2/10 Low
- Heat 1/10 Low 9 d/yr ≥76°F today · 20 d/yr by 30 yrs out
- Wind 1/10 Low
- Air quality 6/10 Major 8 unhealthy d/yr today · 9 by 30 yrs out
Nearby sold comps map
Loading sold comps map…
Walkable amenities ~0.75 mi
Loading nearby amenities…
Taxation est. · year 1
- Rental income
- $56,050
- − Mortgage interest
- −$25,151
- − Property taxes
- −$2,354
- − Insurance
- −$2,245
- − Repairs & maintenance
- −$4,484
- − Management
- −$4,484
- − Depreciation
- −$13,062
- Taxable income
- $4,271
- Est. tax owed @ 24.0%
- −$1,025
- After-tax cash flow
- $10,401/yr
For passive investors: Depreciation is non-cash, so a rental often shows a tax loss while cash-flowing — sheltering income. Rental losses are passive: they offset passive income freely, and up to $25,000/yr can offset ordinary (W-2) income if you actively participate and your MAGI is under $100k (phasing out to $0 by $150k); unused losses carry forward. On sale, claimed depreciation is recaptured at up to 25%, and gains may owe capital-gains tax (a 1031 exchange can defer both). Figures are a year-1 estimate at your 24.0% rate — not tax advice; consult a CPA.
Schools (NCES district)
- District
- Neah-Kah-Nie SD 56
- NCES district ID
- 4108650
- Math proficiency
- 39% ▼ -4.00%
- Reading proficiency
- 55% ▼ -4.00%
- Median HH income
- $42,437
- Composite
- 41.68/100
- National rank
- #7205
- State rank
- #62 of 183 in OR
Livability — Rockaway Beach
- Score
- 74/100
- State rank
- #94
- US rank
- #4777
Category grades
Schools grade is shown separately in the Schools card above.
Census & demographics
- Census place
- Rockaway Beach, OR
- Population (ZIP)
- 2,422
Population outlook (Tillamook County) Hauer SSP2
- Today (2025)
- 26,318 people
- By 2030
- 26,603 · +1.1%
- By 2040
- 26,898 · +2.2%
- By 2050
- 27,129 · +3.1%
- By 2075
- 27,858 · +5.9%
- By 2100
- 26,212 · -0.4%
Race, ethnicity, and origin ACS 2023
- Neighborhood character
- Predominantly White (94%)
- Race & ethnicity
- White 94% Hispanic / Latino 2% Two or more races 2% Asian 1%
- Common ancestry
- Slovak 4% Iranian 4% Portuguese 3%
- Foreign-born
- 2% · Canada
- Languages at home
- 93% English-only · Spanish 4% French/Haitian/Cajun 1% Other Indo-European 1%
Political lean MEDSL · Tillamook
- 2024 margin
- Toss-up / Even · D 47.9% · R 49.2% · Other 2.9%
- 2008→2024 swing
- -11.2pp toward R · 2008: 9.9pp · 2024: -1.4pp
- All cycles
- 2024: R+1.4 2020: R+1.7 2016: R+5.9 2012: D+4.7 2008: D+9.9
Not yet ingested
- Civics
- —
Market trends
- HPI YoY
- ▼ -121.02%
- Current HPI
- 228.3227
- Rent YoY
- —
- Metro
- —
- State GDP YoY
- ▲ 2.05%
- F500 in state
- 2
Industry mix (Fortune 500 HQ in OR)
| Industry | F500 HQs | Revenue |
|---|---|---|
| Consumer Goods | 1 | $51B |
|
||
Price history
+245.4% since first listed13 events — show timeline
- 2026-04-04 Listed $449,000 RMLS
- 2026-04-03 Listed $449,000 OCMLS
- 2022-02-25 Price Changed $435,000 OCMLS
- 2022-02-07 Listed $150,000 OCMLS
- 2021-03-29 Sold (Public Records) $365,000 Public Records
- 2021-03-29 Sold (MLS) $365,000 RMLS
- 2021-02-27 Listed $349,900 RMLS
- 2013-12-30 Sold (Public Records) $165,000 Public Records
- 2013-12-30 Sold (MLS) $165,000 RMLS
- 2013-06-02 Listed $179,900 RMLS
- 2001-02-15 Sold (Public Records) $130,000 Public Records
- 2001-02-15 Sold (MLS) $130,000 OCMLS
- 2000-09-25 Listed $130,000 OCMLS
Property tax history
+3.0%/yrLatest (2025): $2,354 · +8.6% YoY. Source: county tax records.
Cash-flow waterfall
monthlySold comps — $/sqft
last 12 mo · ≤1 miLoading sold comps…