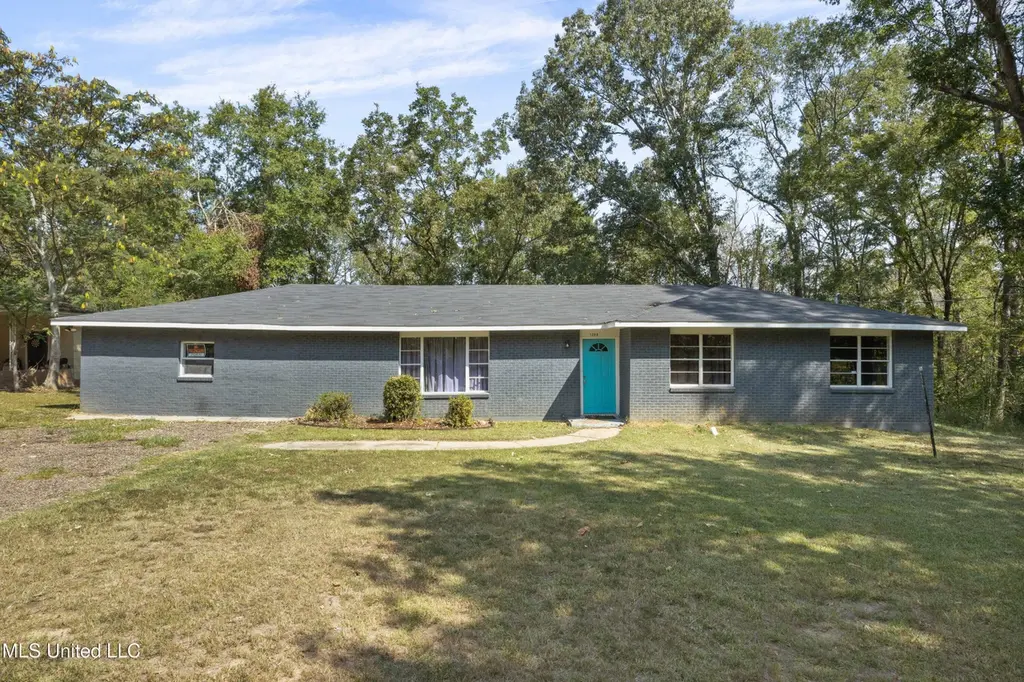
1208 Cooper Rd · Jackson, MS
Flood risk 1/10 · Minimal
- FEMA flood zone
- X (unshaded)
- Chance of flooding over 30 yrs
- 0.0%
- Est. flood insurance / yr
- $507 – $1,088
Fire risk 4/10 · Minor
- Est. fire insurance / yr
- $1,241 – $2,305
Heat risk 7/10 · Major
- Hot days now (above 108°F)
- 7 days/yr
- Hot days in 30 yrs
- 19 days/yr
Wind risk 8/10 · Major
- Chance of severe wind over 30 yrs
- 80.0%
Air-quality risk 1/10 · Minimal
- Unhealthy air days now
- 0 days/yr
- Unhealthy air days in 30 yrs
- 0 days/yr
Risk factors via First Street. Map © Google.
Why this score? — see what drove the D+ grade
The composite is a weighted blend of 9 inputs, each scored 0–100. Each bar is that input's sub-score; the figure is the points it added to the 100-point composite (weight × sub-score).
- Cash flow +24.2/30.0
- DSCR +7.8/10.0
- 1% rule +5.6/10.0
- Rent growth +3.6/5.0
- Livability +3.4/5.0
- Condition / age +2.5/5.0
- Schools +1.1/10.0
- ARV discount +0.0/15.0
- Appreciation +0.0/10.0
$125,000
🖨 Deal sheet 📄 Offer letter ✓ Due diligence
Listing remarks MLS
Income producing property. This spacious 3 bedroom 2 bath home is a must see.
Key facts
- 0.34 acre lot
- 4 parking spots
- Built 1963
Neighborhood map
What this means for you Summary
Snapshot
- This is a 4-bed/2.0-bath single-family listed at $125k.
Deal economics
- At list price, monthly cash flow is $249 ($3k/yr) — positive.
- The deal already cash-flows at list — no discount required.
- Meets the 1% rule at list price ($1k rent vs $125k).
- Recommended offer: $114k (9.0% below list) — sets the bar for market timing.
Location & tenants
- Location reads 68/100 on livability (#66 in MS) — a middle-class / working-renter tenant base. Strengths: commute A+, cost of living A+, housing A+; Watch: schools F, amenities F, employment F.
- Jackson Public School District (urban): math 9% / reading 18% proficiency, ranked #112 of 130 in MS (top 86%) — low school quality limits family demand, transient renter base, plan for 1-2y turnover; 88% free/reduced lunch — lower-income household profile, screen leases tightly.
- Market conditions: Rents rising fast (+4.2%/yr); 302 active listings in the ZIP; 24 comparable units currently listed for rent nearby; rentals at typical pace (median 24d on market — plan ~3-4 weeks tenant-placement turnaround); 42% of comp listings sitting > 30 days — soft ceiling on asking rent; 167 units permitted in Hinds County in 2024 (0 in 5+ unit buildings).
- This rent runs 31% of the median local income ($51k/yr) — at the standard rent-burdened threshold; future hikes will face affordability resistance.
Forward outlook
- Local home prices are declining (-3.0%/yr); year-one equity from $864 of loan paydown is wiped out by about $4k of value loss. Plan a longer hold.
- Hinds County population projected to shrink 6% by 2050 — rents likely to lag national; underwrite the cash flow, not the appreciation.
Negotiation context
- It's been on market 92 days — a 9% lower offer ($114k) is reasonable based on typical stale-listing flexibility.
- 8 sale attempts since 23y ago with the ask held roughly flat each time — persistent listings suggest the price (not the market) is what's stuck; bring a comps-based counter.
Risks & watch-outs
- Climate carrying-cost: severe wind risk, 80% chance of damaging wind over 30y; extreme-heat days projected 7→19/yr by 2055 (HVAC capex compounding) — expect insurance premiums to compound above CPI over the hold.
Questions for the listing agent
- It's been on market 92 days. Have you received any prior offers? Is the seller open to a 9% concession, seller financing, or rate buy-down credit?
- Built in 1963 — when were the roof, HVAC, electrical panel, plumbing, and water heater last replaced?
- Why hasn't it sold? Are there any deal-killer items the seller is aware of (foundation, flood, title, zoning, code violations)?
- Is there a deadline driving the sale (1031 exchange, divorce, estate, relocation)? That informs how much negotiation room exists.
- Schools are F-rated, which usually means shorter tenancies and higher turnover. Who's the typical renter profile here, and what's been the actual vacancy rate?
- The area grade is low — what's the realistic commute time and amenity access for the typical tenant pool here? Any planned neighborhood developments (good or bad) we should know about?
- What's the average days-on-market for RENTAL listings here right now (not sales)? A rising rental-DOM trend means longer vacancies and softer asking-rent achievability than the comps imply.
- What's the recent tenant-quality profile in this submarket — average credit score on applications, eviction rate, late-payment / NSF rate, and stable-employment percentage? A property-management company in the area should have these aggregated.
- How much new for-sale + rental construction is in the pipeline within 1–3 miles? Heavy new supply typically softens prices + rents 12–24 months out; constrained supply supports both.
Investment metrics
- 1% rule
- 1.06% ✓
- Cap rate
- 8.69%
- Cash-on-cash
- 8.54%
- DSCR
- 1.38
- GRM
- 7.9
CMA / ARV
- ARV (median comp)
- $90,596
- List price
- $125,000
- Delta
- 37.97%
- Verdict
- OVERPRICED
- Comps
- 20 within 1.0 mi
Show comp detail 12 sales within ~0.75 mi
| Address | Dist | Beds/Ba | Sqft | Sold | Price | $/sf | Match |
|---|---|---|---|---|---|---|---|
| 1244 Cooper Rd | 0.10mi | 3/2.0 (-1) | 1,680 (+8%) | 2mo | $65,000 | $39 | 77 |
| 1357 Canterbury Ln | 0.39mi | 4/2.0 | 1,698 (+9%) | 2mo | $105,000 | $62 | 66 |
| 3114 Suncrest Dr | 0.55mi | 4/2.0 | 1,432 (-8%) | 3mo | $64,900 | $45 | 57 |
| 3253 Ridgeland Dr | 0.50mi | 3/2.0 (-1) | 1,506 (-4%) | 14mo | $55,000 | $37 | 54 |
| 1119 Primrose St | 0.25mi | 3/2.0 (-1) | 1,785 (+14%) | 8mo | $135,000 | $76 | 53 |
| 3453 Shannon Dale Dr | 0.43mi | 3/2.0 (-1) | 1,683 (+8%) | 11mo | $150,000 | $89 | 53 |
| 1027 Autumn St | 0.63mi | 3/2.0 (-1) | 1,694 (+8%) | 1mo | $84,900 | $50 | 50 |
| 929 Palm St | 0.54mi | 3/2.0 (-1) | 1,649 (+6%) | 13mo | $5,000 | $3 | 50 |
| 3303 Ridgeland Dr Dr | 0.49mi | 3/1.5 (-1) | 1,372 (-12%) | 10mo | $114,900 | $84 | 41 |
| 965 N Valley Falls Rd | 0.41mi | 3/2.0 (-1) | 1,329 (-15%) | 12mo | $105,000 | $79 | 41 |
| 3302 Cherrywood Dr | 0.75mi | 3/2.0 (-1) | 1,416 (-9%) | 11mo | $80,000 | $56 | 35 |
| 950 Woodville Dr | 0.65mi | 3/1.5 (-1) | 1,362 (-13%) | 10mo | $17,500 | $13 | 33 |
Match score weights: distance 35% · size 25% · config 20% · recency 20%. Top-matched comps best support the ARV.
Projected returns pro-forma
-3.0% appreciation · 4.23% rent growth · sell at horizon
- IRR
- -2.1%
- Equity multiple
- 0.92×
- Total profit
- $-2,748
- Equity at exit
- $18,638
- IRR
- 8.8%
- Equity multiple
- 1.71×
- Total profit
- $24,933
- Equity at exit
- $10,808
Cash invested: $35,000 (down + closing). Projections, not guarantees.
Landlord ↔ Tenant lean methodology
- Overall (STATE)
- 90 Strongly Landlord-Friendly
- State Mississippi
- 90 Strongly Landlord-Friendly · R+11
- County
- — inherits STATE
- City
- — inherits STATE
ZIP-level market 39212
- Home prices YoY
- -11.7%
- Rents YoY
- 4.2%
- Active inventory
- 302
- Price-to-rent
- 7.9×
Monthly cashflow live
- Estimated rent
- $1,323 high interval (Pro) →
- Mortgage (P&I)
- −$656
- Tax from tax record
- −$89 /mo · $1,065/yr
- Insurance
- −$52
- HOA
- −$0
- Vacancy / Maint / Mgmt
- −$278
- Net cashflow
- $249
Break-even live
UW: 25.0% down · 7.5% · 30yr · 1.5% tax · 5.0% vac · 8.0% maint · 8.0% mgmt
Financing live
Cash to close
- Down payment
- $31,250
- Closing costs
- $3,750
- Reserves months
- —
- Total cash needed
- —
Loan-product check · same deal, 3 products live
Conventional
25% down · 7.5% · 30yr
- Down + closing
- —
- Monthly P&I
- —
- Monthly cashflow
- —
- DSCR
- —
- Eligible?
- —
Personal DTI + credit; lowest rate.
DSCR
20% down · 8.5% · 30yr
- Down + closing
- —
- Monthly P&I
- —
- Monthly cashflow
- —
- DSCR
- —
- Eligible?
- —
No personal income docs; deal must DSCR.
Hard money
10% down · 12.0% · 12mo
- Down + closing
- —
- Monthly P&I
- —
- Monthly cashflow
- —
- DSCR
- —
- Eligible?
- —
Short-term bridge; refi at stabilization.
Rent comps 24 comps
| Address | Beds | Baths | Sqft | Rent | $/sqft | DOM | Units | Dist |
|---|---|---|---|---|---|---|---|---|
| 3341 Suncrest Dr Jackson, MS | 4.0 | 1.0 | 1292 | $1,225 | $0.95 | 44d | 1 | 0.21mi |
| 1054 Deryll St Jackson, MS | 3.0 | 1.5 | 1132 | $1,050 | $0.93 | 14d | 1 | 0.29mi |
| 1018 Deryll St Jackson, MS | 3.0 | 1.0 | 1056 | $900 | $0.85 | 23d | 1 | 0.36mi |
| 1010 Deryll St Jackson, MS | 3.0 | 2.0 | 1143 | $1,050 | $0.92 | 14d | 1 | 0.38mi |
| 3308 Ramona St Jackson, MS | 3.0 | 1.0 | 1104 | $1,150 | $1.04 | 21d | 1 | 0.61mi |
| 1219 Woody Dr Jackson, MS | 3.0 | 1.0 | 1058 | $1,150 | $1.09 | 23d | 1 | 0.88mi |
| 2808 Ridgeland Dr Jackson, MS | 3.0 | 2.0 | 1606 | $1,600 | $1.00 | 44d | 1 | 0.92mi |
| 2915 Longwood Dr Jackson, MS | 3.0 | 2.0 | 1800 | $1,400 | $0.78 | 23d | 1 | 0.96mi |
| 3049 Lakewood Dr Jackson, MS | 3.0 | 1.0 | 1200 | $975 | $0.81 | 44d | 1 | 1.00mi |
| 3162 Oak Forest Dr Jackson, MS | 3.0 | 1.5 | 1280 | $1,236 | $0.97 | 44d | 1 | 1.06mi |
| 3020 Lakewood Dr Jackson, MS | 4.0 | 2.0 | 1600 | $1,150 | $0.72 | 23d | 1 | 1.07mi |
| 3122 Oak Forest Dr Jackson, MS | 3.0 | 2.0 | 1421 | $1,100 | $0.77 | 44d | 1 | 1.10mi |
| 2904 Marwood Dr Jackson, MS | 3.0 | 2.0 | 1554 | $1,250 | $0.80 | 23d | 1 | 1.11mi |
| 3151 Shirley Dr Jackson, MS | 4.0 | 2.0 | 1474 | $1,306 | $0.89 | 14d | 1 | 1.16mi |
| 3147 Shirley Dr Jackson, MS | 4.0 | 2.0 | 2137 | $1,425 | $0.67 | 44d | 1 | 1.17mi |
| 3147 Shirley Dr Jackson, MS | 4.0 | 2.0 | 2137 | $1,425 | $0.67 | 14d | 1 | 1.17mi |
| 1641 Woodburn St Jackson, MS | 5.0 | 2.0 | 1300 | $1,812 | $1.39 | 14d | 1 | 1.17mi |
| 3030 Oak Forest Dr Jackson, MS | 3.0 | 2.0 | 1200 | $1,100 | $0.92 | 14d | 1 | 1.18mi |
| 3030 Oak Forest Dr Jackson, MS | 3.0 | 1.5 | 1200 | $1,100 | $0.92 | 44d | 1 | 1.18mi |
| 103 Sykes Park Cir Jackson, MS | 3.0 | 2.0 | 1500 | $1,250 | $0.83 | 44d | 1 | 1.34mi |
| 1223 Marydale Dr Jackson, MS | 3.0 | 1.0 | 1300 | $950 | $0.73 | 44d | 1 | 1.38mi |
| 3511 Sykes Park Dr Jackson, MS | 3.0 | 2.0 | 1225 | $1,426 | $1.16 | 14d | 1 | 1.40mi |
| 427 McDowell Park Cir Jackson, MS | 3.0 | 1.5 | 1308 | $1,200 | $0.92 | 14d | 1 | 1.41mi |
| 2873 Teresa Dr Jackson, MS | 3.0 | 1.0 | 1100 | $1,100 | $1.00 | 44d | 1 | 1.45mi |
Listing history 31 events
-
2026-06-18days on market $125,000 Active 92 DOM
-
2026-06-17days on market $125,000 Active 91 DOM
-
2026-06-16days on market $125,000 Active 90 DOM
-
2026-06-15days on market $125,000 Active 89 DOM
-
2026-06-14days on market $125,000 Active 87 DOM
-
2026-06-13status $125,000 Active 86 DOM
-
2026-05-04status Pending 77-char remark
Show marketing remark (77 chars)
Income producing property. This spacious 3 bedroom 2 bath home is a must see.
-
2026-02-07$125,000 Active 77-char remark
Show marketing remark (77 chars)
Income producing property. This spacious 3 bedroom 2 bath home is a must see.
-
2025-03-30historical
-
2025-02-01status Active
-
2025-01-30historical
-
2024-08-30$155,000 Active
-
2024-02-02soldstatus
-
2023-09-10historical $1,275
-
2023-08-24price $1,275
-
2023-07-20$1,500
-
2023-04-17historical
-
2023-03-30status Active
-
2023-03-16status Pending
-
2023-01-31price $125,000
-
2022-12-28$155,000 Active
-
2021-10-01historical
-
2017-04-04soldstatus
-
2015-09-16soldstatus
-
2006-04-28soldstatus
-
2006-04-28soldstatus
-
2006-04-17$83,000
-
2003-10-27$74,900
-
2000-02-17soldstatus
-
1994-05-05soldstatus
-
1961-04-11soldstatus
ⓘ Source: listings_history table (triggers on properties + properties_extension) + one-shot
backfill from property_details.listing_events for pre-trigger history.
Tax reassessment forecast MS · Resets to sale price
- Current annual tax
- $1,065 · $89/mo
- Projected year-2 tax
- $1,065 · $89/mo
- Expected delta
- $0/yr ($0/mo · 0.0%)
ⓘ Screening estimate from a state-policy table — verify with the county assessor before closing.
Climate risk First Street
- Flood 1/10 Low FEMA zone X (unshaded) · 0% chance over 30 yrs
- Wildfire 4/10 Moderate
- Heat 7/10 Severe 7 d/yr ≥108°F today · 19 d/yr by 30 yrs out
- Wind 8/10 Severe 80% chance of damaging wind over 30 yrs
- Air quality 1/10 Low 0 unhealthy d/yr today · 0 by 30 yrs out
Nearby sold comps map
Loading sold comps map…
Walkable amenities ~0.75 mi
Loading nearby amenities…
Taxation est. · year 1
- Rental income
- $15,882
- − Mortgage interest
- −$7,002
- − Property taxes
- −$1,065
- − Insurance
- −$625
- − Repairs & maintenance
- −$1,271
- − Management
- −$1,271
- − Depreciation
- −$3,636
- Taxable income
- $1,012
- Est. tax owed @ 24.0%
- −$243
- After-tax cash flow
- $2,747/yr
For passive investors: Depreciation is non-cash, so a rental often shows a tax loss while cash-flowing — sheltering income. Rental losses are passive: they offset passive income freely, and up to $25,000/yr can offset ordinary (W-2) income if you actively participate and your MAGI is under $100k (phasing out to $0 by $150k); unused losses carry forward. On sale, claimed depreciation is recaptured at up to 25%, and gains may owe capital-gains tax (a 1031 exchange can defer both). Figures are a year-1 estimate at your 24.0% rate — not tax advice; consult a CPA.
Schools (NCES district)
- District
- Jackson Public School District
- NCES district ID
- 2802190
- Math proficiency
- 9% ▼ -14.00%
- Reading proficiency
- 18% ▼ -7.00%
- Median HH income
- $33,234
- Composite
- 10.89/100
- National rank
- #9755
- State rank
- #112 of 130 in MS
Livability — Jackson
- Score
- 68/100
- State rank
- #66
- US rank
- #9695
Category grades
Schools grade is shown separately in the Schools card above.
Census & demographics
- Census place
- Jackson, MS
- County
- Hinds County · 167,040 people
- City population
- 140,204
- Metro
- Jackson, MS
- Population (ZIP)
- 25,659
- Household income
- $50,722
- Rent vs Own
- Severe rent burden
- 1314.0
Population outlook (Hinds County) Hauer SSP2
- Today (2025)
- 242,528 people
- By 2030
- 241,113 · -0.6%
- By 2040
- 235,557 · -2.9%
- By 2050
- 226,946 · -6.4%
- By 2075
- 199,995 · -17.5%
- By 2100
- 164,165 · -32.3%
Race, ethnicity, and origin ACS 2023
- Neighborhood character
- Predominantly Black (86%)
- Race & ethnicity
- Black 86% White 9% Hispanic / Latino 3% Two or more races 3%
- Common ancestry
- Serbian 1% Lithuanian 1%
- Foreign-born
- 1% · Canada
- Languages at home
- 97% English-only · Spanish 2%
Political lean MEDSL · Hinds
- 2024 margin
- Solid D (+46.1) · D 72.4% · R 26.3% · Other 1.4%
- 2008→2024 swing
- +7.1pp toward D · 2008: 39.0pp · 2024: 46.1pp
- All cycles
- 2024: D+46.1 2020: D+48.3 2016: D+43.7 2012: D+45.1 2008: D+39.0
Not yet ingested
- Civics
- —
Market trends
- HPI YoY
- ▼ -23.01%
- Current HPI
- 174.4025
- Rent YoY
- ▲ 4.23%
- Metro
- Jackson, MS
- State GDP YoY
- —
- F500 in state
- 0
Price history
+66.9% since first listed25 events — show timeline
- 2026-05-04 Pending — MLSU
- 2026-02-07 Listed $125,000 MLSU
- 2025-03-30 Listing Removed — MLSU
- 2025-02-01 Relisted — MLSU
- 2025-01-30 Listing Removed — MLSU
- 2024-08-30 Listed $155,000 MLSU
- 2024-02-02 Sold (Public Records) — Public Records
- 2023-09-10 Rental Removed $1,275 APPFOLIO
- 2023-08-24 Price Changed $1,275 APPFOLIO
- 2023-07-20 Listed for Rent $1,500 APPFOLIO
- 2023-04-17 Listing Removed — MLSU
- 2023-03-30 Relisted — MLSU
- 2023-03-16 Pending — MLSU
- 2023-01-31 Price Changed $125,000 MLSU
- 2022-12-28 Listed $155,000 MLSU
- 2021-10-01 Listing Removed — MLSU
- 2017-04-04 Sold (Public Records) — Public Records
- 2015-09-16 Sold (Public Records) — Public Records
- 2006-04-28 Sold (Public Records) — Public Records
- 2006-04-28 Sold (MLS) — MLSU
- 2006-04-17 Listed $83,000 MLSU
- 2003-10-27 Listed $74,900 MLSU
- 2000-02-17 Sold (Public Records) — Public Records
- 1994-05-05 Sold (Public Records) — Public Records
- 1961-04-11 Sold (Public Records) — Public Records
Property tax history
-1.9%/yrLatest (2025): $1,065 · +2.0% YoY. Source: county tax records.
Cash-flow waterfall
monthlySold comps — $/sqft
last 12 mo · ≤1 miLoading sold comps…