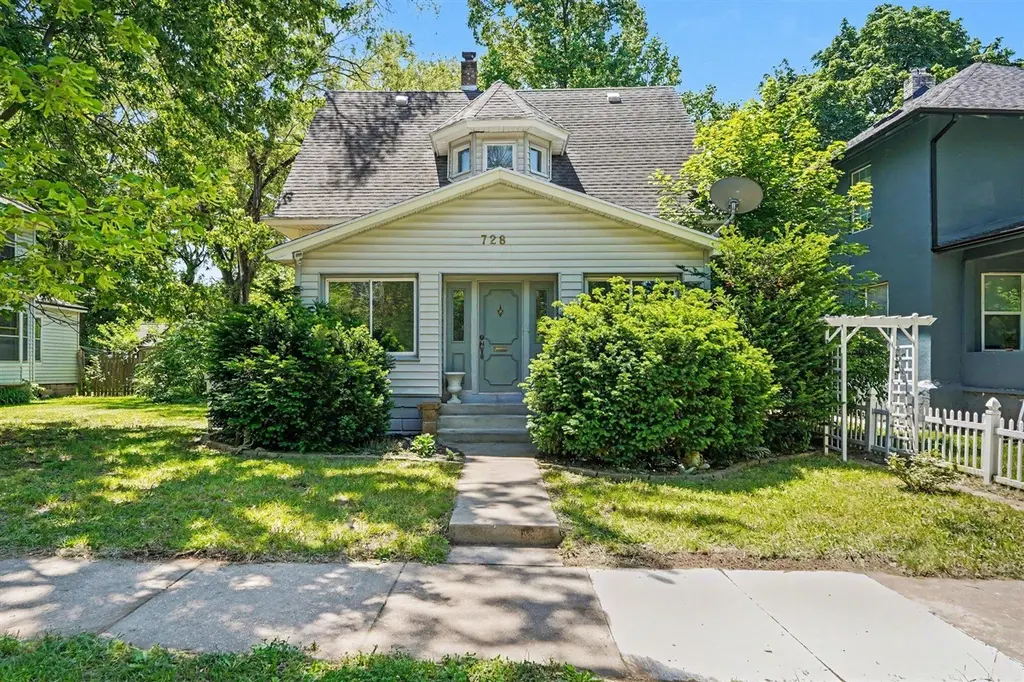
728 Adams St SE · Grand Rapids, MI
Flood risk 1/10 · Minimal
- FEMA flood zone
- X (unshaded)
- Chance of flooding over 30 yrs
- 0.0%
- Est. flood insurance / yr
- $473 – $860
Fire risk 1/10 · Minimal
- Est. fire insurance / yr
- $784 – $1,456
Heat risk 2/10 · Minimal
- Hot days now (above 96°F)
- 7 days/yr
- Hot days in 30 yrs
- 16 days/yr
Wind risk 2/10 · Minimal
- Chance of severe wind over 30 yrs
- —
Air-quality risk 2/10 · Minimal
- Unhealthy air days now
- 2 days/yr
- Unhealthy air days in 30 yrs
- 2 days/yr
Risk factors via First Street. Map © Google.
Why this score? — see what drove the D+ grade
The composite is a weighted blend of 9 inputs, each scored 0–100. Each bar is that input's sub-score; the figure is the points it added to the 100-point composite (weight × sub-score).
- Cash flow +16.4/30.0
- ARV discount +7.5/15.0
- DSCR +5.1/10.0
- Livability +4.2/5.0
- 1% rule +4.1/10.0
- Rent growth +3.7/5.0
- Condition / age +2.5/5.0
- Schools +1.9/10.0
- Appreciation +0.0/10.0
$230,000
🖨 Deal sheet (PDF) 📄 Offer letter ✓ Due diligence
Listing remarks MLS
Step into the historic charm of this beautifully maintained bungalow featuring timeless character and thoughtful updates throughout. Gorgeous hardwood floors, antique light fixtures, and decorative ceiling medallions create a warm and inviting atmosphere. Recently updated kitchen offers stainless steel appliances, new countertops, a stylish backsplash, and modern touches while preserving the home's classic appeal. Spacious main-level full bathroom features a stunning clawfoot tub, newly tiled flooring (2023). Enjoy your morning coffee or unwind in enclosed front porch, a perfect extension of the living space. Upstairs, youll find three bedrooms including a generously sized primary w/ plenty of room to spread out. Recent improvements include new deck (2025), central air (2023), water heater (2022), fresh paint throughout, updated light fixtures, and more. This move-in-ready home blends historic charm with modern comfort in all the right ways. Put this one on your shortlist, it wont last!
Key facts
- Updated kitchen
- New countertops
- Hardwood floors
Tags
Property features AI
Exterior
- Utilities: Public water; Electricity available; Natural gas connected
- Home design: Single family residence; Residential property
- Construction: Built in 1910; Brick and vinyl siding construction; Composition roof; Full basement
- Exterior features: Sidewalk; Paved road
Interior
- Kitchen: Range; Microwave; Dishwasher; Refrigerator; Pantry
- Bedrooms: Primary bedroom; Bedroom 2; Bedroom 3; Three bedrooms total
- Bathrooms: 1 full bathroom; 1 half bathroom
- Heating & cooling: Forced air heating; Has cooling
- Interior features: Pantry; Storms, screens, replacement windows and window treatments
- Laundry & utility: Washer; Dryer; Natural gas water heater
Neighborhood map
What this means for you Summary
Snapshot
- This is a 3-bed/1.0-bath single-family listed at $230k.
Deal economics
- At list price, monthly cash flow is $129 ($2k/yr) — positive.
- The deal already cash-flows at list — no discount required.
- To meet the 1% rule (rent ≥ 1% of price), the offer needs to be $209k (9.2% below list).
- Recommended offer: $209k (9.2% below list) — sets the bar for 1% rule.
- Cap rate 7.0% vs local median 4.5% in Grand Rapids — top-decile yield for the area; either an underpriced asset or a hidden risk that comps aren't pricing in. Stress-test before assuming the spread holds.
Location & tenants
- Location reads 83/100 on livability (#44 in MI, #939 nationally) — a professional / high-income tenant draw. Strengths: amenities A+, commute A+, cost of living A+; Watch: employment C-, crime F.
- Grand Rapids Public Schools (urban): math 15% / reading 29% proficiency, ranked #451 of 540 in MI (top 84%) — low school quality limits family demand, transient renter base, plan for 1-2y turnover; 80% free/reduced lunch — lower-income household profile, screen leases tightly.
- Zoned schools: Campus Elementary (math 2% / reading 2%, grade F, #1,384 of 1,397 statewide, top 100%, 266 students, 97% FRL); Alger Middle School (math 2% / reading 12%, grade F, #481 of 493 statewide, top 98%, 342 students, 95% FRL); City Middlehigh (math 65% / reading 88%, grade A-, #16 of 713 statewide, top 2%, 908 students, 40% FRL) — zoned schools at 77% FRL track the district average.
- Market conditions: Rents rising fast (+4.7%/yr); 178 active listings in the ZIP; 18 comparable units currently listed for rent nearby; rentals lingering (median 46d on market — plan ~5-8 weeks vacancy on turnover, expect pricing pressure); 72% of comp listings sitting > 30 days — soft ceiling on asking rent; 2,253 units permitted in Kent County in 2024 (969 in 5+ unit buildings).
- This rent runs 41% of the median local income ($61k/yr) — at the standard rent-burdened threshold; future hikes will face affordability resistance.
Forward outlook
- Local home prices are declining (-3.0%/yr); year-one equity from $2k of loan paydown is wiped out by about $7k of value loss. Plan a longer hold.
- Kent County population projected at +22% by 2050 — long-run rental-demand tailwind backs the buy-and-hold thesis.
Negotiation context
- Only 13 days on market — expect competitive offers; lowballing is unlikely to land.
- 13 sale attempts since 9y ago with the ask held roughly flat each time — persistent listings suggest the price (not the market) is what's stuck; bring a comps-based counter.
- Current owner paid $190k; 21% above their basis — modest negotiation headroom, anchor on the comps not their cost.
Risks & watch-outs
- Watch-outs: built in 1910 — expect roof / HVAC / electrical / plumbing capex.
Questions for the listing agent
- Built in 1910 — when were the roof, HVAC, electrical panel, plumbing, and water heater last replaced?
- Is there a deadline driving the sale (1031 exchange, divorce, estate, relocation)? That informs how much negotiation room exists.
- Crime grade is F in this area — have there been break-ins, vandalism, or insurance claims at this property in the last 3 years? What carrier currently insures it and at what premium?
- The area grade is low — what's the realistic commute time and amenity access for the typical tenant pool here? Any planned neighborhood developments (good or bad) we should know about?
- What's the average days-on-market for RENTAL listings here right now (not sales)? A rising rental-DOM trend means longer vacancies and softer asking-rent achievability than the comps imply.
- What's the recent tenant-quality profile in this submarket — average credit score on applications, eviction rate, late-payment / NSF rate, and stable-employment percentage? A property-management company in the area should have these aggregated.
- How much new for-sale + rental construction is in the pipeline within 1–3 miles? Heavy new supply typically softens prices + rents 12–24 months out; constrained supply supports both.
Investment metrics
- 1% rule
- 0.91% ✗
- Cap rate
- 6.96%
- Cash-on-cash
- 2.39%
- DSCR
- 1.11
- GRM
- 9.2
CMA / ARV
No comps found within radius.
Projected returns pro-forma
-3.0% appreciation · 4.74% rent growth · sell at horizon
- IRR
- -10.7%
- Equity multiple
- 0.61×
- Total profit
- $-25,376
- Equity at exit
- $34,294
- IRR
- 0.9%
- Equity multiple
- 1.07×
- Total profit
- $4,217
- Equity at exit
- $19,886
Cash invested: $64,400 (down + closing). Projections, not guarantees.
Landlord ↔ Tenant lean methodology
- Overall (STATE)
- 62 Landlord-Friendly
- State Michigan
- 62 Landlord-Friendly · EVEN
- County
- — inherits STATE
- City
- — inherits STATE
ZIP-level market 49507
- Rents YoY
- 4.7%
- Active inventory
- 178
- Price-to-rent
- 9.2×
Monthly cashflow live
- Estimated rent
- $2,088 high interval (Pro) →
- Mortgage (P&I)
- −$1,206
- Tax from tax record
- −$219 /mo · $2,633/yr
- Insurance
- −$96
- HOA
- −$0
- Vacancy / Maint / Mgmt
- −$439
- Net cashflow
- $129
Break-even live
Sensitivity live
| Price | -10% $259 | -5% $194 | +0% $129 | +5% $63 | +10% $-2 |
|---|---|---|---|---|---|
| Rent | -10% $-36 | -5% $46 | +0% $129 | +5% $211 | +10% $294 |
| Rate | -1.0pp $244 | -0.5pp $187 | base $129 | +0.5pp $69 | +1.0pp $8 |
UW: 25.0% down · 7.5% · 30yr · 1.5% tax · 5.0% vac · 8.0% maint · 8.0% mgmt
Financing live
Cash to close
- Down payment
- $57,500
- Closing costs
- $6,900
- Reserves months
- —
- Total cash needed
- —
Loan-product check · same deal, 3 products live
Conventional
25% down · 7.5% · 30yr
- Down + closing
- —
- Monthly P&I
- —
- Monthly cashflow
- —
- DSCR
- —
- Eligible?
- —
Personal DTI + credit; lowest rate.
DSCR
20% down · 8.5% · 30yr
- Down + closing
- —
- Monthly P&I
- —
- Monthly cashflow
- —
- DSCR
- —
- Eligible?
- —
No personal income docs; deal must DSCR.
Hard money
10% down · 12.0% · 12mo
- Down + closing
- —
- Monthly P&I
- —
- Monthly cashflow
- —
- DSCR
- —
- Eligible?
- —
Short-term bridge; refi at stabilization.
Rent comps 18 comps
| Address | Beds | Baths | Sqft | Rent | $/sqft | DOM | Units | Dist |
|---|---|---|---|---|---|---|---|---|
| 1057 Griggs St SE Grand Rapids, MI | 2.0 | 1.0 | 1100 | $1,550 | $1.41 | 45d | 1 | 0.65mi |
| 1027 Underwood Ave SE Grand Rapids, MI | 4.0 | 2.0 | 1600 | $2,300 | $1.44 | 16d | 1 | 0.71mi |
| 434 Worden St SE Unit 2 Grand Rapids, MI | 2.0 | 1.0 | 900 | $1,495 | $1.66 | 45d | 1 | 0.76mi |
| 729 Bates St SE Unit 1 Grand Rapids, MI | 4.0 | 3.5 | 1576 | $2,395 | $1.52 | 45d | 1 | 0.79mi |
| 840 Lafayette Ave SE Unit 2 Grand Rapids, MI | 3.0 | 1.0 | 950 | $1,600 | $1.68 | 45d | 1 | 0.86mi |
| 950 Merritt St SE Grand Rapids, MI | 3.0 | 1.0 | 1000 | $2,100 | $2.10 | 45d | 1 | 0.88mi |
| 1555 Margaret Ave SE Grand Rapids, MI | 2.0 | 1.0 | 900 | $1,500 | $1.67 | 16d | 1 | 0.91mi |
| 1400 Rossman Ave SE Grand Rapids, MI | 3.0 | 1.0 | 1400 | $2,200 | $1.57 | 45d | 1 | 0.95mi |
| 1114 Dunham St SE Unit 1 Grand Rapids, MI | 2.0 | 1.0 | 894 | $1,300 | $1.45 | 45d | 1 | 0.99mi |
| 1031 Merrifield St SE Grand Rapids, MI | 3.0 | 2.0 | 1238 | $2,300 | $1.86 | 16d | 1 | 1.00mi |
| 550 Union Ave SE Grand Rapids, MI | 3.0 | 1.5 | 1743 | $2,800 | $1.61 | 45d | 1 | 1.02mi |
| 638 Wealthy St SE Unit A Grand Rapids, MI | 2.0 | 2.0 | 1000 | $2,100 | $2.10 | 45d | 1 | 1.21mi |
| 414 Paris Ave SE Grand Rapids, MI | 3.0 | 1.5 | 1700 | $2,850 | $1.68 | 45d | 1 | 1.21mi |
| 242 Elm St SW Grand Rapids, MI | 2.0 | 1.5 | 1100 | $3,200 | $2.91 | 4d | 1 | 1.30mi |
| 1333 Wealthy St SE Unit 2 Grand Rapids, MI | 2.0 | 1.0 | 1113 | $1,900 | $1.71 | 45d | 1 | 1.42mi |
| 1400 Wealthy St SE Grand Rapids, MI | 2.0 | 1.0 | 907 | $1,925 | $2.12 | 5d | 1 | 1.43mi |
| 258 Orchard Hill St SE Grand Rapids, MI | 3.0 | 1.0 | 1300 | $1,900 | $1.46 | 45d | 1 | 1.44mi |
| 2551 Eastern Ave SE Unit 1 Grand Rapids, MI | 3.0 | 2.0 | 1600 | $2,100 | $1.31 | 45d | 1 | 1.46mi |
Listing history 12 events
-
2026-06-18status $230,000 Pending 13 DOM
-
2026-06-17days on market $230,000 Active 13 DOM
-
2026-06-16pricedays on market $230,000 Active 12 DOM
-
2026-06-15days on market $240,000 Active 11 DOM
-
2026-06-14days on market $240,000 Active 9 DOM
-
2026-06-13days on market $240,000 Active 8 DOM
-
2026-06-10days on market $240,000 Active 6 DOM
-
2026-06-09days on market $240,000 Active 5 DOM
-
2026-06-08days on market $240,000 Active 4 DOM
-
2026-06-07days on market $240,000 Active 3 DOM
-
2026-06-05remarks 699-char remark
-
2026-06-05$240,000 Active 1 DOM
ⓘ Source: listings_history table (triggers on properties + properties_extension) + one-shot
backfill from property_details.listing_events for pre-trigger history.
Tax reassessment forecast MI · Partial reset (capped growth)
- Current annual tax
- $2,633 · $219/mo
- Projected year-2 tax
- $3,087 · $257/mo
- Expected delta
- +$455/yr (+$38/mo · 17.3%)
ⓘ Screening estimate from a state-policy table — verify with the county assessor before closing.
Climate risk First Street
- Flood 1/10 Low FEMA zone X (unshaded) · 0% chance over 30 yrs
- Wildfire 1/10 Low
- Heat 2/10 Low 7 d/yr ≥96°F today · 16 d/yr by 30 yrs out
- Wind 2/10 Low
- Air quality 2/10 Low 2 unhealthy d/yr today · 2 by 30 yrs out
Nearby sold comps map
Loading sold comps map…
Walkable amenities ~0.75 mi
Loading nearby amenities…
Taxation est. · year 1
- Rental income
- $25,062
- − Mortgage interest
- −$12,884
- − Property taxes
- −$2,633
- − Insurance
- −$1,150
- − Repairs & maintenance
- −$2,005
- − Management
- −$2,005
- − Depreciation
- −$6,691
- Taxable loss
- −$2,306
- Est. tax savings @ 24.0%
- +$553
- After-tax cash flow
- $2,095/yr
For passive investors: Depreciation is non-cash, so a rental often shows a tax loss while cash-flowing — sheltering income. Rental losses are passive: they offset passive income freely, and up to $25,000/yr can offset ordinary (W-2) income if you actively participate and your MAGI is under $100k (phasing out to $0 by $150k); unused losses carry forward. On sale, claimed depreciation is recaptured at up to 25%, and gains may owe capital-gains tax (a 1031 exchange can defer both). Figures are a year-1 estimate at your 24.0% rate — not tax advice; consult a CPA.
Schools (NCES district)
- District
- Grand Rapids Public Schools
- NCES district ID
- 2616440
- Math proficiency
- 15% ▼ -5.00%
- Reading proficiency
- 29% ▼ -1.00%
- Median HH income
- $40,612
- Composite
- 18.62/100
- National rank
- #8899
- State rank
- #451 of 540 in MI
Livability — Grand Rapids
- Score
- 83/100
- State rank
- #44
- US rank
- #939
Category grades
Schools grade is shown separately in the Schools card above.
Census & demographics
- Census place
- Grand Rapids, MI
- County
- Kent County · 533,805 people
- City population
- 181,325
- Metro
- Grand Rapids-Kentwood, MI
- Population (ZIP)
- 38,487
- Household income
- $61,461
- Rent vs Own
- Severe rent burden
- 1625.0
Population outlook (Kent County) Hauer SSP2
- Today (2025)
- 712,484 people
- By 2030
- 748,618 · +5.1%
- By 2040
- 814,777 · +14.4%
- By 2050
- 868,556 · +21.9%
- By 2075
- 966,487 · +35.7%
- By 2100
- 967,975 · +35.9%
Race, ethnicity, and origin ACS 2023
- Neighborhood character
- Highly diverse neighborhood (Simpson 0.71)
- Race & ethnicity
- Hispanic / Latino 31% Black 31% White 30% Two or more races 21%
- Hispanic origin (detail)
- Mexican 18% Puerto Rican 3% Dominican 1%
- Common ancestry
- Iranian 8% Romanian 2% Lithuanian 1%
- Foreign-born
- 18% · Canada
- Languages at home
- 71% English-only · Spanish 23% Arabic 1% Other Indo-European 1%
Political lean MEDSL · Kent
- 2024 margin
- Lean D (+5.4) · D 51.8% · R 46.5% · Other 1.7%
- 2008→2024 swing
- +4.8pp toward D · 2008: 0.5pp · 2024: 5.4pp
- All cycles
- 2024: D+5.4 2020: D+6.1 2016: R+3.1 2012: R+7.9 2008: D+0.5
Not yet ingested
- Civics
- —
Market trends
- HPI YoY
- ▼ -301.99%
- Current HPI
- 325.3878
- Rent YoY
- ▲ 4.74%
- Metro
- Grand Rapids-Kentwood, MI
- State GDP YoY
- ▲ 1.37%
- F500 in state
- 28
Industry mix (Fortune 500 HQ in MI)
| Industry | F500 HQs | Revenue |
|---|---|---|
| Automotive Parts | 3 | $48B |
|
||
| Automotive | 2 | $372B |
|
||
| Chemicals | 1 | $45B |
|
||
| Automotive Retail | 1 | $29B |
|
||
| Healthcare / Medical Devices | 1 | $23B |
|
||
| Automotive Technology | 1 | $20B |
|
||
Price history
+1900.0% since first listed42 events — show timeline
- 2026-06-04 Listed $240,000 MiRealSource-MiMLS
- 2026-06-04 Listed $240,000 SW Michigan MLS
- 2026-06-04 Listed $240,000 REALCOMP
- 2022-08-23 Sold (Public Records) $190,000 Public Records
- 2022-08-11 Sold (MLS) $190,000 SW Michigan MLS
- 2022-08-11 Sold (MLS) $190,000 REALCOMP
- 2022-07-16 Pending — SW Michigan MLS
- 2022-07-16 Pending — REALCOMP
- 2022-07-12 Price Changed $199,900 REALCOMP
- 2022-07-12 Price Changed $199,900 SW Michigan MLS
- 2022-06-30 Price Changed $205,000 REALCOMP
- 2022-06-25 Price Changed $215,000 REALCOMP
- 2022-06-17 Price Changed $205,000 REALCOMP
- 2022-06-17 Price Changed $205,000 SW Michigan MLS
- 2022-06-08 Price Changed $215,000 REALCOMP
- 2022-06-08 Price Changed $215,000 SW Michigan MLS
- 2022-06-05 Listed $199,900 MiRealSource-MiMLS
- 2022-06-05 Listed $225,000 SW Michigan MLS
- 2022-06-05 Listed $225,000 REALCOMP
- 2018-01-08 Sold (Public Records) $109,600 Public Records
- 2018-01-02 Sold (MLS) $109,600 SW Michigan MLS
- 2018-01-02 Sold (MLS) $109,600 REALCOMP
- 2017-12-05 Pending — SW Michigan MLS
- 2017-11-30 Price Changed $109,900 SW Michigan MLS
- 2017-11-15 Price Changed $117,400 SW Michigan MLS
- 2017-11-02 Listing Removed — SW Michigan MLS
- 2017-11-01 Listing Removed — REALCOMP
- 2017-10-24 Listed $119,900 SW Michigan MLS
- 2017-10-24 Listed $109,900 REALCOMP
- 2017-10-10 Price Changed $119,900 SW Michigan MLS
- 2017-10-02 Price Changed $124,900 SW Michigan MLS
- 2017-09-22 Relisted — SW Michigan MLS
- 2017-09-17 Pending — SW Michigan MLS
- 2017-09-11 Price Changed $129,900 SW Michigan MLS
- 2017-09-06 Listed $134,900 SW Michigan MLS
- 2017-09-05 Listed $119,900 REALCOMP
- 2017-03-30 Sold (MLS) $32,500 SW Michigan MLS
- 2017-03-30 Sold (MLS) $32,500 REALCOMP
- 2017-02-23 Pending — SW Michigan MLS
- 2017-01-25 Listed $60,000 SW Michigan MLS
- 2017-01-23 Listed $60,000 REALCOMP
- 2015-02-20 Sold (Public Records) $12,000 Public Records
Property tax history
+9.9%/yrLatest (2025): $2,633 · +2.4% YoY. Source: county tax records.
Cash-flow waterfall
monthlySold comps — $/sqft
last 12 mo · ≤1 miLoading sold comps…