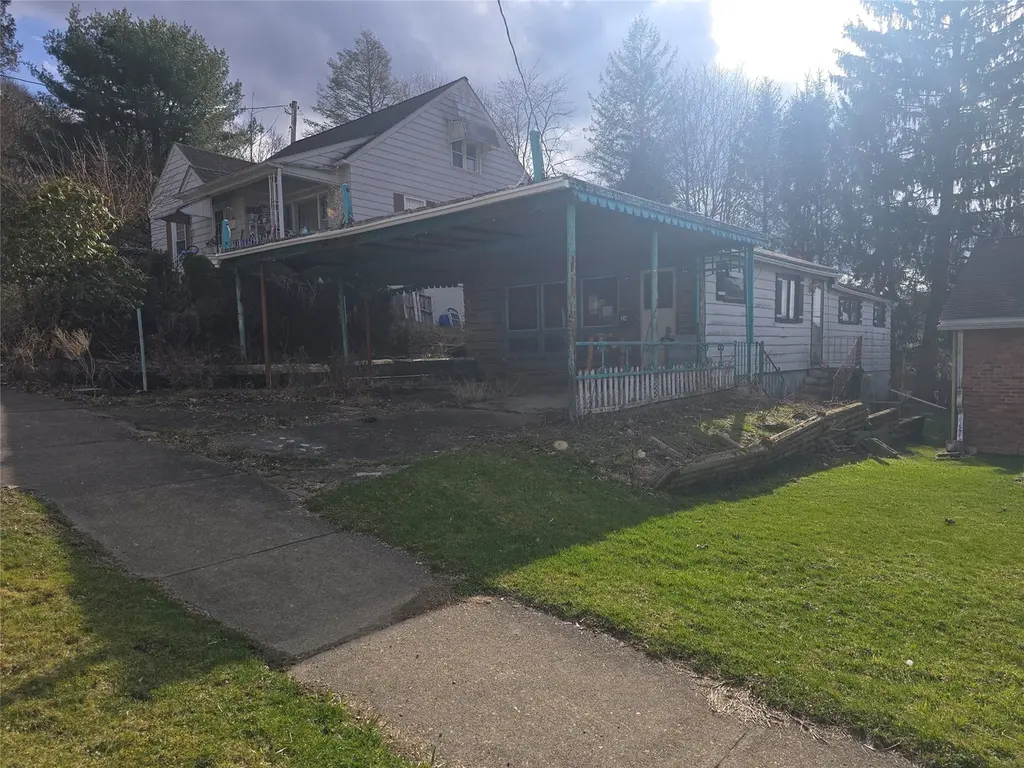
24 Medford St · Binghamton, NY
Flood risk 1/10 · Minimal
- FEMA flood zone
- X
- Chance of flooding over 30 yrs
- 0.0%
- Est. flood insurance / yr
- $507 – $1,088
Fire risk 1/10 · Minimal
- Est. fire insurance / yr
- $691 – $1,283
Heat risk 3/10 · Minor
- Hot days now (above 92°F)
- 7 days/yr
- Hot days in 30 yrs
- 16 days/yr
Wind risk 2/10 · Minimal
- Chance of severe wind over 30 yrs
- 2.0%
Air-quality risk 2/10 · Minimal
- Unhealthy air days now
- 0 days/yr
- Unhealthy air days in 30 yrs
- 1 days/yr
Risk factors via First Street. Map © Google.
Why this score? — see what drove the B+ grade
The composite is a weighted blend of 9 inputs, each scored 0–100. Each bar is that input's sub-score; the figure is the points it added to the 100-point composite (weight × sub-score).
- Cash flow +30.0/30.0
- 1% rule +10.0/10.0
- DSCR +10.0/10.0
- Appreciation +10.0/10.0
- ARV discount +7.5/15.0
- Livability +3.9/5.0
- Schools +3.0/10.0
- Rent growth +2.5/5.0
- Condition / age +2.5/5.0
$40,000
🖨 Deal sheet (PDF) 📄 Offer letter ✓ Due diligence
Listing remarks
Lots of potential! Roll up your sleeves with this Diamond in the rough that has 3 BRs/ 1 BA, Hard wood floors, 1st floor laundry, 2-car carport. Located on a charming well cared for street. Hold Harmless must be signed prior to all showings. Cash only buyers. Being sold as-is.
Key facts
- 4,585 sq ft lot
- Built 1964
- Listed 5 days
Property features AI
Exterior
- Parking: Carport
- Utilities: Public water; Public sewer; Cable available
- Home design: Single-family residence; One story
- Construction: Aluminum siding
- Exterior features: Level lot; Lot dimensions approximately 35 x 131
Interior
- Kitchen: Range; Free-standing range; Refrigerator; Electric water heater
- Flooring: Hardwood; Vinyl
- Bathrooms: 1 full bathroom
- Heating & cooling: Forced air heating
- Interior features: Range; Electric water heater; Free-standing range; Refrigerator
Neighborhood map
What this means for you Summary
Snapshot
- This is a 3-bed/1.0-bath single-family listed at $40k.
Deal economics
- At list price, monthly cash flow is $764 ($9k/yr) — positive.
- The deal already cash-flows at list — no discount required.
- Meets the 1% rule at list price ($1k rent vs $40k).
- Cap rate 29.2% vs local median 6.4% in Binghamton — top-decile yield for the area; either an underpriced asset or a hidden risk that comps aren't pricing in. Stress-test before assuming the spread holds.
Location & tenants
- Location reads 78/100 on livability (#174 in NY, #2,710 nationally) — a middle-class / working-renter tenant base. Strengths: amenities A+, commute A+, cost of living A+; Watch: crime F, employment F.
- Binghamton City School District (urban): math 30% / reading 44% proficiency, ranked #557 of 590 in NY (top 94%) — families likely to look elsewhere, expect single-tenant / working-renter base with shorter leases; 61% free/reduced lunch — lower-income household profile, screen leases tightly.
- Zoned schools: Benjamin Franklin Elementary School (math 17% / reading 32%, grade F, #1,846 of 2,108 statewide, top 91%, 399 students, 75% FRL); Binghamton High School (math 71% / reading 79%, grade A-, #631 of 1,100 statewide, top 58%, 1,341 students, 69% FRL).
- Zoned-school proficiency averages 50% at this address vs 37% district-wide (+13 pts) — the actual schools serving this property are materially stronger than the Binghamton City School District average implies; a family-tenant draw the district grade alone would hide.
- Market conditions: 112 active listings in the ZIP; 13 comparable units currently listed for rent nearby; rentals lingering (median 45d on market — plan ~5-8 weeks vacancy on turnover, expect pricing pressure); 62% of comp listings sitting > 30 days — soft ceiling on asking rent; 340 units permitted in Broome County in 2024 (269 in 5+ unit buildings).
Forward outlook
- In year one you build about $4k of equity ($277 loan paydown + $4k appreciation (10.0% local appreciation)).
- Broome County population projected at -13% by 2050 — secular population decline; favor cash flow + early exit over multi-decade hold.
- At projected returns (10.0% appreciation + 3.0% rent growth), your $11k cash investment doubles in ~1 year — after that, you're playing with house money.
- By year 7, paydown + projected appreciation supports a ~$31k cash-out refi (75% LTV) — recoverable capital for the next deal without selling this one.
Negotiation context
- Only 5 days on market — expect competitive offers; lowballing is unlikely to land.
- Current owner paid $24k; list at $40k implies a 63% gain — meaningful room to come down on a strong offer.
Questions for the listing agent
- Built in 1964 — when were the roof, HVAC, electrical panel, plumbing, and water heater last replaced?
- Is there a deadline driving the sale (1031 exchange, divorce, estate, relocation)? That informs how much negotiation room exists.
- Schools are D-rated, which usually means shorter tenancies and higher turnover. Who's the typical renter profile here, and what's been the actual vacancy rate?
- Crime grade is F in this area — have there been break-ins, vandalism, or insurance claims at this property in the last 3 years? What carrier currently insures it and at what premium?
- What's the average days-on-market for RENTAL listings here right now (not sales)? A rising rental-DOM trend means longer vacancies and softer asking-rent achievability than the comps imply.
- What's the recent tenant-quality profile in this submarket — average credit score on applications, eviction rate, late-payment / NSF rate, and stable-employment percentage? A property-management company in the area should have these aggregated.
- How much new for-sale + rental construction is in the pipeline within 1–3 miles? Heavy new supply typically softens prices + rents 12–24 months out; constrained supply supports both.
Investment metrics
- 1% rule
- 3.29% ✓
- Cap rate
- 29.23%
- Cash-on-cash
- 81.91%
- DSCR
- 4.64
- GRM
- 2.5
CMA / ARV
- ARV (median comp)
- $121,618
- List price
- $40,000
- Delta
- -67.11%
- Verdict
- UNDERPRICED
- Comps
- 20 within 1.0 mi
Show comp detail 8 sales within ~0.75 mi
| Address | Dist | Beds/Ba | Sqft | Sold | Price | $/sf | Match |
|---|---|---|---|---|---|---|---|
| 5 Macon St | 0.16mi | 3/1.0 | 875 (-9%) | 7mo | $130,000 | $149 | 72 |
| 8 Montour St | 0.08mi | 2/1.0 (-1) | 874 (-9%) | 12mo | $93,000 | $106 | 66 |
| 8 Gates St | 0.27mi | 3/1.0 | 1,034 (+8%) | 18mo | $120,000 | $116 | 59 |
| 89 & 91 Evans Street St | 0.63mi | 3/1.0 | 1,043 (+9%) | 1mo | $101,000 | $97 | 55 |
| 58 Burr Ave | 0.37mi | 2/1.0 (-1) | 852 (-11%) | 8mo | $45,500 | $53 | 52 |
| 54 Second St | 0.58mi | 2/1.0 (-1) | 900 (-6%) | 12mo | $83,000 | $92 | 47 |
| 50 Powers Rd | 0.53mi | 4/1.0 (+1) | 1,008 (+5%) | 20mo | $70,000 | $69 | 45 |
| 5 Espial Dr | 0.65mi | 2/1.0 (-1) | 924 (-4%) | 22mo | $110,000 | $119 | 40 |
Match score weights: distance 35% · size 25% · config 20% · recency 20%. Top-matched comps best support the ARV.
Projected returns pro-forma
10.0% appreciation · 3.0% rent growth · sell at horizon
- IRR
- 91.7%
- Equity multiple
- 7.29×
- Total profit
- $70,496
- Equity at exit
- $36,035
- IRR
- 86.5%
- Equity multiple
- 16.12×
- Total profit
- $169,349
- Equity at exit
- $77,711
Cash invested: $11,200 (down + closing). Projections, not guarantees.
Landlord ↔ Tenant lean methodology
- Overall (STATE)
- 15 Strongly Tenant-Friendly
- State New York
- 15 Strongly Tenant-Friendly · D+10
- County
- — inherits STATE
- City
- — inherits STATE
ZIP-level market 13903
- Home prices YoY
- 4.3%
- Active inventory
- 112
- Price-to-rent
- 2.5×
Monthly cashflow live
- Estimated rent
- $1,318 high interval (Pro) →
- Mortgage (P&I)
- −$210
- Tax est. 1.5%
- −$50 /mo · $600/yr
- Insurance
- −$17
- HOA
- −$0
- Vacancy / Maint / Mgmt
- −$277
- Net cashflow
- $764
Break-even live
Sensitivity live
| Price | -10% $792 | -5% $778 | +0% $764 | +5% $751 | +10% $737 |
|---|---|---|---|---|---|
| Rent | -10% $660 | -5% $712 | +0% $764 | +5% $817 | +10% $869 |
| Rate | -1.0pp $785 | -0.5pp $775 | base $764 | +0.5pp $754 | +1.0pp $744 |
UW: 25.0% down · 7.5% · 30yr · 1.5% tax · 5.0% vac · 8.0% maint · 8.0% mgmt
Financing live
Cash to close
- Down payment
- $10,000
- Closing costs
- $1,200
- Reserves months
- —
- Total cash needed
- —
Loan-product check · same deal, 3 products live
Conventional
25% down · 7.5% · 30yr
- Down + closing
- —
- Monthly P&I
- —
- Monthly cashflow
- —
- DSCR
- —
- Eligible?
- —
Personal DTI + credit; lowest rate.
DSCR
20% down · 8.5% · 30yr
- Down + closing
- —
- Monthly P&I
- —
- Monthly cashflow
- —
- DSCR
- —
- Eligible?
- —
No personal income docs; deal must DSCR.
Hard money
10% down · 12.0% · 12mo
- Down + closing
- —
- Monthly P&I
- —
- Monthly cashflow
- —
- DSCR
- —
- Eligible?
- —
Short-term bridge; refi at stabilization.
Rent comps 13 comps
| Address | Beds | Baths | Sqft | Rent | $/sqft | DOM | Units | Dist |
|---|---|---|---|---|---|---|---|---|
| 37 Bigelow St Unit 1 Binghamton, NY | 3.0 | 1.5 | 854 | $1,500 | $1.76 | 15d | 1 | 0.71mi |
| 27 Tompkins St Unit 9 Binghamton, NY | 2.0 | 1.0 | 950 | $950 | $1.00 | 45d | 1 | 0.74mi |
| 27 Tompkins St Unit 10 Binghamton, NY | 2.0 | 1.0 | 950 | $1,050 | $1.11 | 22d | 1 | 0.74mi |
| 231 Conklin Ave #2 Binghamton, NY | 3.0 | 1.0 | 700 | $1,350 | $1.93 | 45d | 1 | 0.75mi |
| 147 E Frederick St Binghamton, NY | 2.0 | 1.0 | 800 | $1,200 | $1.50 | 15d | 1 | 1.08mi |
| 198 Court St Unit 6 Binghamton, NY | 2.0 | 1.0 | 550 | $1,350 | $2.45 | 45d | 1 | 1.23mi |
| 198 Court St Unit 10 Binghamton, NY | 2.0 | 1.0 | 700 | $1,200 | $1.71 | 22d | 1 | 1.23mi |
| 198 Court St Unit 11 Binghamton, NY | 2.0 | 1.0 | 550 | $1,300 | $2.36 | 45d | 1 | 1.23mi |
| 198 Court St Unit 10 Binghamton, NY | 2.0 | 1.0 | 550 | $1,250 | $2.27 | 45d | 1 | 1.23mi |
| 198 Court St Unit 6 Binghamton, NY | 2.0 | 1.0 | 700 | $1,350 | $1.93 | 22d | 1 | 1.23mi |
| 26 Doubleday St Binghamton, NY | 2.0 | 1.0 | 1000 | $1,350 | $1.35 | 45d | 1 | 1.31mi |
| 26 Doubleday St #2 Binghamton, NY | 2.0 | 1.0 | 850 | $1,400 | $1.65 | 46d | 1 | 1.31mi |
| 1 Euclid Ave Unit 1 Binghamton, NY | 3.0 | 1.0 | 1100 | $1,500 | $1.36 | 45d | 1 | 1.42mi |
Listing history 3 events
-
2026-05-11status Pending 277-char remark
-
2026-05-06$40,000 Active 277-char remark
-
2001-01-30soldstatus $24,500
ⓘ Source: listings_history table (triggers on properties + properties_extension) + one-shot
backfill from property_details.listing_events for pre-trigger history.
Climate risk First Street
- Flood 1/10 Low FEMA zone X · 0% chance over 30 yrs
- Wildfire 1/10 Low
- Heat 3/10 Moderate 7 d/yr ≥92°F today · 16 d/yr by 30 yrs out
- Wind 2/10 Low 2% chance of damaging wind over 30 yrs
- Air quality 2/10 Low 0 unhealthy d/yr today · 1 by 30 yrs out
Nearby sold comps map
Loading sold comps map…
Walkable amenities ~0.75 mi
Loading nearby amenities…
Taxation est. · year 1
- Rental income
- $15,812
- − Mortgage interest
- −$2,241
- − Property taxes
- −$600
- − Insurance
- −$200
- − Repairs & maintenance
- −$1,265
- − Management
- −$1,265
- − Depreciation
- −$1,164
- Taxable income
- $9,077
- Est. tax owed @ 24.0%
- −$2,179
- After-tax cash flow
- $6,995/yr
For passive investors: Depreciation is non-cash, so a rental often shows a tax loss while cash-flowing — sheltering income. Rental losses are passive: they offset passive income freely, and up to $25,000/yr can offset ordinary (W-2) income if you actively participate and your MAGI is under $100k (phasing out to $0 by $150k); unused losses carry forward. On sale, claimed depreciation is recaptured at up to 25%, and gains may owe capital-gains tax (a 1031 exchange can defer both). Figures are a year-1 estimate at your 24.0% rate — not tax advice; consult a CPA.
Schools (NCES district)
- District
- Binghamton City School District
- NCES district ID
- 3604870
- Math proficiency
- 30% ▬ 0.00%
- Reading proficiency
- 44% ▲ 15.00%
- Median HH income
- $30,475
- Composite
- 30.09/100
- National rank
- #6342
- State rank
- #557 of 590 in NY
Livability — Binghamton
- Score
- 78/100
- State rank
- #174
- US rank
- #2710
Category grades
Schools grade is shown separately in the Schools card above.
Census & demographics
- Census place
- Binghamton, NY
- County
- Broome County · 126,805 people
- City population
- 65,170
- Metro
- Binghamton, NY
- Population (ZIP)
- 17,569
- Household income
- $66,278
- Rent vs Own
- Severe rent burden
- 602.0
Population outlook (Broome County) Hauer SSP2
- Today (2025)
- 187,989 people
- By 2030
- 183,066 · -2.6%
- By 2040
- 172,228 · -8.4%
- By 2050
- 163,161 · -13.2%
- By 2075
- 153,641 · -18.3%
- By 2100
- 140,851 · -25.1%
Race, ethnicity, and origin ACS 2023
- Neighborhood character
- Predominantly White (80%)
- Race & ethnicity
- White 80% Black 9% Two or more races 6% Hispanic / Latino 4% Asian 1%
- Common ancestry
- Romanian 6% Slovak 2% Scotch-Irish 2%
- Foreign-born
- 5% · Canada
- Languages at home
- 94% English-only · Spanish 2% Other Indo-European 1% Arabic 1%
Political lean MEDSL · Broome
- 2024 margin
- Toss-up / Even · D 50.2% · R 49.8%
- 2008→2024 swing
- -7.6pp toward R · 2008: 8.0pp · 2024: 0.4pp
- All cycles
- 2024: D+0.4 2020: D+3.5 2016: R+3.7 2012: D+4.6 2008: D+8.0
Not yet ingested
- Civics
- —
Market trends
- HPI YoY
- ▲ 11.68%
- Current HPI
- 286.1001
- Rent YoY
- —
- Metro
- Binghamton, NY
- State GDP YoY
- ▲ 2.60%
- F500 in state
- 92
Industry mix (Fortune 500 HQ in NY)
| Industry | F500 HQs | Revenue |
|---|---|---|
| Financial Services | 10 | $950B |
|
||
| Consumer Goods | 9 | $162B |
|
||
| Insurance | 4 | $225B |
|
||
| Telecommunications | 2 | $144B |
|
||
| Pharmaceuticals | 2 | $112B |
|
||
| Media / Entertainment | 2 | $69B |
|
||
Price history
+63.3% since first listed3 events — show timeline
- 2026-05-11 Pending — GBAOR
- 2026-05-06 Listed $40,000 GBAOR
- 2001-01-30 Sold (Public Records) $24,500 Public Records
Property tax history
+8.0%/yrLatest (2025): $3,480 · +0.9% YoY. Source: county tax records.
Cash-flow waterfall
monthlySold comps — $/sqft
last 12 mo · ≤1 miLoading sold comps…