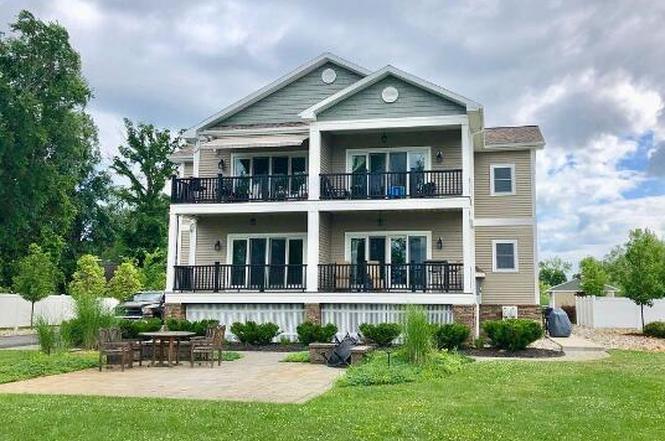
 Fourplex
103B Point Breeze Rd · Saratoga Springs, NY
Flood risk 6/10 · Moderate
- FEMA flood zone
- AE
- Chance of flooding over 30 yrs
- 0.67%
- Est. flood insurance / yr
- $2,026 – $9,024
Fire risk 1/10 · Minimal
- Est. fire insurance / yr
- $691 – $1,283
Heat risk 3/10 · Minor
- Hot days now (above 96°F)
- 7 days/yr
- Hot days in 30 yrs
- 16 days/yr
Wind risk 3/10 · Minor
- Chance of severe wind over 30 yrs
- 4.0%
Air-quality risk 1/10 · Minimal
- Unhealthy air days now
- 0 days/yr
- Unhealthy air days in 30 yrs
- 0 days/yr
Risk factors via First Street. Map © Google.
Why this score? — see what drove the D grade
The composite is a weighted blend of 9 inputs, each scored 0–100. Each bar is that input's sub-score; the figure is the points it added to the 100-point composite (weight × sub-score).
- Cash flow +11.9/30.0
- ARV discount +7.5/15.0
- Schools +6.1/10.0
- Rent growth +4.8/5.0
- Livability +4.1/5.0
- DSCR +3.5/10.0
- 1% rule +3.4/10.0
- Condition / age +2.5/5.0
- Appreciation +0.0/10.0
$1,200,000
🖨 Deal sheet (PDF) 📄 Offer letter ✓ Due diligence
Multi-family units
County records classify this as Multi-Family (2-4 Unit). Listing-text estimate: 4 units. confirmed
Listing remarks MLS
Sold Before Print
Key facts
- Saratoga lake views
- Direct lake access
- Granite countertops
Tags
Neighborhood map
What this means for you Summary
Snapshot
- This is a 4 × 2-bed/1.0-bath units multifamily listed at $1.20M.
Deal economics
- At list price, monthly cash flow is $-773 ($-9k/yr) — negative. Per door: $-193/mo.
- To cash-flow at today's rent, offer at most $1.09M (9.3% below list).
- To meet the 1% rule (rent ≥ 1% of price), the offer needs to be $1.01M (15.8% below list).
- Recommended offer: $1.01M (15.8% below list) — sets the bar for 1% rule.
- Cap rate 6.0% vs local median 2.0% in Saratoga Springs — top-decile yield for the area; either an underpriced asset or a hidden risk that comps aren't pricing in. Stress-test before assuming the spread holds.
Location & tenants
- Location reads 82/100 on livability (#83 in NY, #1,284 nationally) — a professional / high-income tenant draw. Strengths: employment A+, housing A+, health & safety A; Watch: amenities D+, cost of living F.
- Saratoga Springs City SD (suburban): math 67% / reading 72% proficiency, ranked #138 of 590 in NY (top 23%) — acceptable for families but not a draw, mixed tenant base, ~2y average lease; only 15% free/reduced lunch — higher-income household profile.
- Zoned schools: Caroline Street Elementary School (math 87% / reading 77%, grade A+, #138 of 2,108 statewide, top 8%, 357 students, 29% FRL); Maple Avenue Middle School (math 46% / reading 69%, grade B, #187 of 729 statewide, top 26%, 1,392 students, 27% FRL); Saratoga Springs High School (math 98% / reading 92%, grade A+, #83 of 1,100 statewide, top 8%, 1,947 students, 26% FRL).
- Market conditions: Rents rising fast (+9.2%/yr); 474 active listings in the ZIP; solid renter incomes; 1,132 units permitted in Saratoga County in 2024 (378 in 5+ unit buildings).
- At $10,102/mo this rent would consume 119% of the median local household income ($102k/yr) (locally 1424% of renters already pay >50% of income on rent) — very limited rent-growth headroom before tenants either downsize or default.
Forward outlook
- Local home prices are declining (-3.0%/yr); year-one equity from $8k of loan paydown is wiped out by about $36k of value loss. Plan a longer hold.
- Saratoga County population projected at +4% by 2050 — modest demand growth; plan on rents tracking national, not racing it.
Negotiation context
- Only 7 days on market — expect competitive offers; lowballing is unlikely to land.
- 2 sale attempts since 5y ago with the ask held roughly flat each time — persistent listings suggest the price (not the market) is what's stuck; bring a comps-based counter.
- Current owner paid $800k; list at $1.20M implies a 50% gain — meaningful room to come down on a strong offer.
Risks & watch-outs
- Watch-outs: flood insurance adds $460/mo.
- Climate carrying-cost: in FEMA flood zone AE (mandatory federal flood insurance) — expect insurance premiums to compound above CPI over the hold.
Questions for the listing agent
- What do current leases actually rent for vs. the listed asking? Can we see a recent rent roll and the last 12 months of T-12 income?
- Can we see the unit-by-unit rent roll, current vacancy, and any below-market leases? What's the average tenancy length?
- What capital expenditures (roof, boiler, parking lot, exteriors) have been made in the last 5 years, and what's planned in the next 2?
- What's the actual annual flood-insurance premium (NFIP or private), and is the property in a SFHA with mandatory coverage?
- Is there a deadline driving the sale (1031 exchange, divorce, estate, relocation)? That informs how much negotiation room exists.
- Schools are A-rated — typically a magnet for longer-tenancy family renters. What's the average tenant stay here, and is there a school-zone premium baked into asking?
- The area grade is low — what's the realistic commute time and amenity access for the typical tenant pool here? Any planned neighborhood developments (good or bad) we should know about?
- What's the average days-on-market for RENTAL listings here right now (not sales)? A rising rental-DOM trend means longer vacancies and softer asking-rent achievability than the comps imply.
- What's the recent tenant-quality profile in this submarket — average credit score on applications, eviction rate, late-payment / NSF rate, and stable-employment percentage? A property-management company in the area should have these aggregated.
- How much new apartment / multifamily construction is in the pipeline within 1–3 miles? Heavy new supply (>2% of stock underway) typically softens rents 12–24 months out; light construction supports rent growth.
Investment metrics
- 1% rule
- 0.84% ✗
- Cap rate
- 5.98%
- Cash-on-cash
- -1.12%
- DSCR
- 0.95
- GRM
- 9.9
CMA / ARV
No comps found within radius.
Projected returns pro-forma
-3.0% appreciation · 8.0% rent growth · sell at horizon
- IRR
- -15.1%
- Equity multiple
- 0.43×
- Total profit
- $-189,847
- Equity at exit
- $178,924
- IRR
- 0.6%
- Equity multiple
- 1.05×
- Total profit
- $16,062
- Equity at exit
- $103,754
Cash invested: $336,000 (down + closing). Projections, not guarantees.
Landlord ↔ Tenant lean methodology
- Overall (STATE)
- 15 Strongly Tenant-Friendly
- State New York
- 15 Strongly Tenant-Friendly · D+10
- County
- — inherits STATE
- City
- — inherits STATE
ZIP-level market 12866
- Home prices YoY
- -31.8%
- Rents YoY
- 9.2%
- Active inventory
- 474
- Price-to-rent
- 39.6×
Monthly cashflow live
- Estimated rent
- $10,102 medium interval (Pro) →
- Mortgage (P&I)
- −$6,293
- Tax est. 1.5%
- −$1,500 /mo · $18,000/yr
- Insurance
- −$500
- Flood insurance flood zone
- −$460 /mo · $5,525/yr
- HOA
- −$0
- Vacancy / Maint / Mgmt
- −$2,121
- Net cashflow
- $-773
Break-even live
Sensitivity live
| Price | -10% $57 | -5% $-358 | +0% $-773 | +5% $-1,187 | +10% $-1,602 |
|---|---|---|---|---|---|
| Rent | -10% $-1,571 | -5% $-1,172 | +0% $-773 | +5% $-374 | +10% $25 |
| Rate | -1.0pp $-168 | -0.5pp $-468 | base $-773 | +0.5pp $-1,084 | +1.0pp $-1,400 |
4-unit breakdown (identical units grouped — click to expand)
| Units | Beds | Baths | Est. rent |
|---|---|---|---|
| 4× units | 2 | 1 | $10,100 |
| #1 | 2 | 1 | $2,525 |
| #2 | 2 | 1 | $2,525 |
| #3 | 2 | 1 | $2,525 |
| #4 | 2 | 1 | $2,525 |
| Total (4 units) | $10,102 | ||
UW: 25.0% down · 7.5% · 30yr · 1.5% tax · 5.0% vac · 8.0% maint · 8.0% mgmt
Financing live
Cash to close
- Down payment
- $300,000
- Closing costs
- $36,000
- Reserves months
- —
- Total cash needed
- —
Loan-product check · same deal, 3 products live
Conventional
25% down · 7.5% · 30yr
- Down + closing
- —
- Monthly P&I
- —
- Monthly cashflow
- —
- DSCR
- —
- Eligible?
- —
Personal DTI + credit; lowest rate.
DSCR
20% down · 8.5% · 30yr
- Down + closing
- —
- Monthly P&I
- —
- Monthly cashflow
- —
- DSCR
- —
- Eligible?
- —
No personal income docs; deal must DSCR.
Hard money
10% down · 12.0% · 12mo
- Down + closing
- —
- Monthly P&I
- —
- Monthly cashflow
- —
- DSCR
- —
- Eligible?
- —
Short-term bridge; refi at stabilization.
Listing history 4 events
-
2026-02-26status Pending
-
2026-02-19$1,200,000 Active
-
2021-06-22soldstatus $800,000 17-char remark
Show marketing remark (17 chars)
Sold Before Print
-
2021-06-22$800,000 17-char remark
Show marketing remark (17 chars)
Sold Before Print
ⓘ Source: listings_history table (triggers on properties + properties_extension) + one-shot
backfill from property_details.listing_events for pre-trigger history.
Climate risk First Street
- Flood 6/10 Major FEMA zone AE · 67% chance over 30 yrs
- Wildfire 1/10 Low
- Heat 3/10 Moderate 7 d/yr ≥96°F today · 16 d/yr by 30 yrs out
- Wind 3/10 Moderate 4% chance of damaging wind over 30 yrs
- Air quality 1/10 Low 0 unhealthy d/yr today · 0 by 30 yrs out
Nearby sold comps map
Loading sold comps map…
Walkable amenities ~0.75 mi
Loading nearby amenities…
Taxation est. · year 1
- Rental income
- $121,224
- − Mortgage interest
- −$67,219
- − Property taxes
- −$18,000
- − Insurance
- −$11,525
- − Repairs & maintenance
- −$9,698
- − Management
- −$9,698
- − Depreciation
- −$34,909
- Taxable loss
- −$29,825
- Est. tax savings @ 24.0%
- +$7,158
- After-tax cash flow
- $-2,115/yr
For passive investors: Depreciation is non-cash, so a rental often shows a tax loss while cash-flowing — sheltering income. Rental losses are passive: they offset passive income freely, and up to $25,000/yr can offset ordinary (W-2) income if you actively participate and your MAGI is under $100k (phasing out to $0 by $150k); unused losses carry forward. On sale, claimed depreciation is recaptured at up to 25%, and gains may owe capital-gains tax (a 1031 exchange can defer both). Figures are a year-1 estimate at your 24.0% rate — not tax advice; consult a CPA.
Schools (NCES district)
- District
- Saratoga Springs City SD
- NCES district ID
- 3625770
- Math proficiency
- 67% ▼ -10.00%
- Reading proficiency
- 72% ▲ 6.00%
- Median HH income
- $69,864
- Composite
- 60.83/100
- National rank
- #818
- State rank
- #138 of 590 in NY
Livability — Saratoga Springs
- Score
- 82/100
- State rank
- #83
- US rank
- #1284
Category grades
Schools grade is shown separately in the Schools card above.
Census & demographics
- County
- Saratoga County · 166,192 people
- City population
- 40,057
- Metro
- Albany-Schenectady-Troy, NY
- Population (ZIP)
- 40,057
- Household income
- $101,901
- Rent vs Own
- Severe rent burden
- 1424.0
Population outlook (Saratoga County) Hauer SSP2
- Today (2025)
- 238,889 people
- By 2030
- 243,681 · +2.0%
- By 2040
- 249,118 · +4.3%
- By 2050
- 248,638 · +4.1%
- By 2075
- 241,675 · +1.2%
- By 2100
- 213,150 · -10.8%
Race, ethnicity, and origin ACS 2023
- Neighborhood character
- Predominantly White (87%)
- Race & ethnicity
- White 87% Two or more races 5% Hispanic / Latino 4% Asian 2% Black 2%
- Common ancestry
- Romanian 6% Lithuanian 5% Slovak 2%
- Foreign-born
- 6% · Canada, South Korea, China
- Languages at home
- 92% English-only · Spanish 2% German/W. Germanic 1% Korean 1%
Political lean MEDSL · Saratoga
- 2024 margin
- Toss-up / Even · D 50.9% · R 49.1%
- 2008→2024 swing
- -1.6pp toward R · 2008: 3.4pp · 2024: 1.8pp
- All cycles
- 2024: D+1.8 2020: D+5.4 2016: R+4.4 2012: D+2.1 2008: D+3.4
Not yet ingested
- Civics
- —
Market trends
- HPI YoY
- ▼ -178.78%
- Current HPI
- 382.7429
- Rent YoY
- ▲ 9.15%
- Metro
- Albany-Schenectady-Troy, NY
- State GDP YoY
- ▲ 2.60%
- F500 in state
- 92
Industry mix (Fortune 500 HQ in NY)
| Industry | F500 HQs | Revenue |
|---|---|---|
| Financial Services | 10 | $950B |
|
||
| Consumer Goods | 9 | $162B |
|
||
| Insurance | 4 | $225B |
|
||
| Telecommunications | 2 | $144B |
|
||
| Pharmaceuticals | 2 | $112B |
|
||
| Media / Entertainment | 2 | $69B |
|
||
Price history
+50.0% since first listed4 events — show timeline
- 2026-02-26 Pending — Global MLS
- 2026-02-19 Listed $1,200,000 Global MLS
- 2021-06-22 Listed $800,000 Global MLS
- 2021-06-22 Sold (MLS) $800,000 Global MLS
Cash-flow waterfall
monthlySold comps — $/sqft
last 12 mo · ≤1 miLoading sold comps…