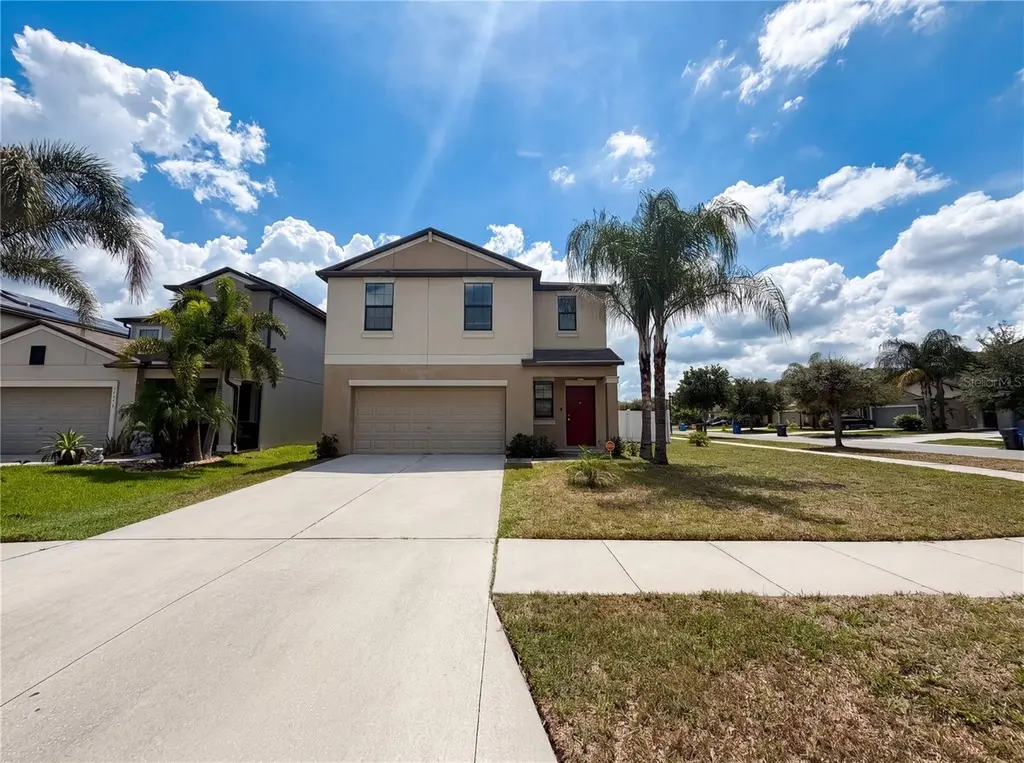
11126 Hudson Hills Ln · Riverview, FL
Flood risk 1/10 · Minimal
- FEMA flood zone
- X (unshaded)
- Chance of flooding over 30 yrs
- 0.0%
- Est. flood insurance / yr
- $507 – $1,088
Fire risk 5/10 · Moderate
- Est. fire insurance / yr
- $947 – $1,759
Heat risk 10/10 · Severe
- Hot days now (above 109°F)
- 7 days/yr
- Hot days in 30 yrs
- 27 days/yr
Wind risk 9/10 · Severe
- Chance of severe wind over 30 yrs
- 99.0%
Air-quality risk 3/10 · Minor
- Unhealthy air days now
- 3 days/yr
- Unhealthy air days in 30 yrs
- 3 days/yr
Risk factors via First Street. Map © Google.
Why this score? — see what drove the D grade
The composite is a weighted blend of 9 inputs, each scored 0–100. Each bar is that input's sub-score; the figure is the points it added to the 100-point composite (weight × sub-score).
- Cash flow +10.0/30.0
- ARV discount +7.5/15.0
- Appreciation +4.3/10.0
- Schools +4.2/10.0
- Livability +4.0/5.0
- 1% rule +3.3/10.0
- DSCR +2.8/10.0
- Rent growth +2.8/5.0
- Condition / age +2.5/5.0
$330,000
🖨 Deal sheet (PDF) 📄 Offer letter ✓ Due diligence
Listing remarks MLS
Under Construction - At 1,870 square feet, four bedrooms and two and a half bathrooms, the Atlanta is a two-story dream home. The cook in the family will love the kitchen with ample counter space, plenty of cabinets and a large pantry for storage. A huge living and dining room space along with a half bathroom round out the first floor. Upstairs you will find the master suite, three other bedrooms as well as a loft, perfect for family game nights. The second floor laundry room provides convenience for the entire family. “Interior images shown are different from the actual model being built. “
Key facts
- Central island
- Welcoming patio
- 7,579 sq ft lot
Tags
Property features AI
Finance
- Other: Living area approximately 1,870 (public records)
- Financial info: CDD present; Lease restrictions apply
- HOA & community: HOA managed by Inframark, LLC; HOA fee $133 annually (about $11.08/month); Association approval required; Pets allowed; Association fees required
Exterior
- Parking: Driveway; Attached 2-car garage
- Security: Owned security system
- Utilities: Public water; Public sewer; Electricity available; Natural gas available
- Home design: Single-family residence; One level; Faces west; Residential zoning (PD)
- Construction: Block and stucco construction; Shingle roof; Slab foundation; Built on approximately 0.17 acres
- Exterior features: Asphalt road access; Other exterior features
Interior
- Kitchen: Dishwasher; Microwave; Other appliances
- Bedrooms: 4 bedrooms
- Flooring: Laminate flooring; Tile flooring
- Bathrooms: 2 full baths; 1 half bath
- Heating & cooling: Central heating; Central air
- Interior features: Ceiling fans; Stone countertops; Central heating; Central air
- Laundry & utility: Laundry room on upper level
Neighborhood map
What this means for you Summary
Snapshot
- This is a 4-bed/3.0-bath single-family listed at $330k.
Deal economics
- At list price, monthly cash flow is $-200 ($-2k/yr) — negative.
- To cash-flow at today's rent, offer at most $295k (10.7% below list).
- To meet the 1% rule (rent ≥ 1% of price), the offer needs to be $275k (16.8% below list).
- Recommended offer: $275k (16.8% below list) — sets the bar for 1% rule.
Location & tenants
- Location reads 79/100 on livability (#134 in FL, #2,000 nationally) — a middle-class / working-renter tenant base. Strengths: housing A+, health & safety A+, employment B+; Watch: amenities F.
- Hillsborough (suburban): math 47% / reading 50% proficiency, ranked #41 of 73 in FL (top 56%) — families likely to look elsewhere, expect single-tenant / working-renter base with shorter leases.
- Zoned schools: Belmont Elementary School (math 42% / reading 45%, grade F, #1,345 of 2,144 statewide, top 64%, 987 students, 44% FRL); East Bay High School (math 24% / reading 35%, grade F, #447 of 667 statewide, top 68%, 1,995 students, 51% FRL) — zoned schools at 47% FRL track the district average.
- Zoned-school proficiency averages 36% at this address vs 48% district-wide (-12 pts) — the specific schools serving this property underperform the Hillsborough average; the district grade overstates school quality for this exact location.
- Market conditions: Rents rising (+1.2%/yr); 463 active listings in the ZIP; 40 comparable units currently listed for rent nearby; rentals at typical pace (median 17d on market — plan ~3-4 weeks tenant-placement turnaround); high-income renter base; 9,053 units permitted in Hillsborough County in 2024 (4,555 in 5+ unit buildings).
Forward outlook
- Local home prices are declining (-1.4%/yr); year-one equity from $2k of loan paydown is wiped out by about $5k of value loss. Plan a longer hold.
- Hillsborough County population projected at +37% by 2050 — long-run rental-demand tailwind backs the buy-and-hold thesis.
Negotiation context
- Only 12 days on market — expect competitive offers; lowballing is unlikely to land.
- 2 sale attempts since 8y ago with the ask held roughly flat each time — persistent listings suggest the price (not the market) is what's stuck; bring a comps-based counter.
- Current owner paid $212k; list at $330k implies a 55% gain — meaningful room to come down on a strong offer.
Risks & watch-outs
- Climate carrying-cost: severe wind risk, 99% chance of damaging wind over 30y; moderate wildfire risk; extreme-heat days projected 7→27/yr by 2055 (HVAC capex compounding) — expect insurance premiums to compound above CPI over the hold.
Questions for the listing agent
- What do current leases actually rent for vs. the listed asking? Can we see a recent rent roll and the last 12 months of T-12 income?
- What does the HOA fee cover, when was the last increase, and are there any pending special assessments or reserve-fund shortfalls?
- Is there a deadline driving the sale (1031 exchange, divorce, estate, relocation)? That informs how much negotiation room exists.
- Schools are B-rated — typically a magnet for longer-tenancy family renters. What's the average tenant stay here, and is there a school-zone premium baked into asking?
- The area grade is low — what's the realistic commute time and amenity access for the typical tenant pool here? Any planned neighborhood developments (good or bad) we should know about?
- What's the average days-on-market for RENTAL listings here right now (not sales)? A rising rental-DOM trend means longer vacancies and softer asking-rent achievability than the comps imply.
- What's the recent tenant-quality profile in this submarket — average credit score on applications, eviction rate, late-payment / NSF rate, and stable-employment percentage? A property-management company in the area should have these aggregated.
- How much new for-sale + rental construction is in the pipeline within 1–3 miles? Heavy new supply typically softens prices + rents 12–24 months out; constrained supply supports both.
Investment metrics
- 1% rule
- 0.83% ✗
- Cap rate
- 5.57%
- Cash-on-cash
- -2.60%
- DSCR
- 0.88
- GRM
- 10.0
CMA / ARV
No comps found within radius.
Projected returns pro-forma
-1.42% appreciation · 1.18% rent growth · sell at horizon
- IRR
- -12.9%
- Equity multiple
- 0.47×
- Total profit
- $-48,652
- Equity at exit
- $73,040
- IRR
- -7.8%
- Equity multiple
- 0.38×
- Total profit
- $-57,332
- Equity at exit
- $71,192
Cash invested: $92,400 (down + closing). Projections, not guarantees.
Landlord ↔ Tenant lean methodology
- Overall (STATE)
- 87 Strongly Landlord-Friendly
- State Florida
- 87 Strongly Landlord-Friendly · R+3
- County
- — inherits STATE
- City
- — inherits STATE
ZIP-level market 33579
- Home prices YoY
- -0.6%
- Rents YoY
- 1.2%
- Active inventory
- 463
- Price-to-rent
- 10.0×
Monthly cashflow live
- Estimated rent
- $2,746 high interval (Pro) →
- Mortgage (P&I)
- −$1,731
- Tax from tax record
- −$490 /mo · $5,884/yr
- Insurance
- −$138
- HOA
- −$11
- Vacancy / Maint / Mgmt
- −$577
- Net cashflow
- $-200
Break-even live
Sensitivity live
| Price | -10% $-13 | -5% $-107 | +0% $-200 | +5% $-293 | +10% $-387 |
|---|---|---|---|---|---|
| Rent | -10% $-417 | -5% $-309 | +0% $-200 | +5% $-92 | +10% $17 |
| Rate | -1.0pp $-34 | -0.5pp $-116 | base $-200 | +0.5pp $-286 | +1.0pp $-373 |
UW: 25.0% down · 7.5% · 30yr · 1.5% tax · 5.0% vac · 8.0% maint · 8.0% mgmt
Financing live
Cash to close
- Down payment
- $82,500
- Closing costs
- $9,900
- Reserves months
- —
- Total cash needed
- —
Loan-product check · same deal, 3 products live
Conventional
25% down · 7.5% · 30yr
- Down + closing
- —
- Monthly P&I
- —
- Monthly cashflow
- —
- DSCR
- —
- Eligible?
- —
Personal DTI + credit; lowest rate.
DSCR
20% down · 8.5% · 30yr
- Down + closing
- —
- Monthly P&I
- —
- Monthly cashflow
- —
- DSCR
- —
- Eligible?
- —
No personal income docs; deal must DSCR.
Hard money
10% down · 12.0% · 12mo
- Down + closing
- —
- Monthly P&I
- —
- Monthly cashflow
- —
- DSCR
- —
- Eligible?
- —
Short-term bridge; refi at stabilization.
Rent comps 40 comps
| Address | Beds | Baths | Sqft | Rent | $/sqft | DOM | Units | Dist |
|---|---|---|---|---|---|---|---|---|
| 11201 Hudson Hills Ln Riverview, FL | 5.0 | 2.5 | 2254 | $2,450 | $1.09 | 16d | 1 | 0.04mi |
| 13924 Arbor Pines Dr Riverview, FL | 4.0 | 2.5 | 1920 | $2,545 | $1.33 | 26d | 1 | 0.09mi |
| 14217 Poke Ridge Dr Riverview, FL | 3.0 | 2.5 | 1913 | $2,511 | $1.31 | 7d | 1 | 0.15mi |
| 14207 Poke Ridge Dr Riverview, FL | 3.0 | 3.0 | 1897 | $2,350 | $1.24 | 26d | 1 | 0.17mi |
| 14207 Poke Ridge Dr Riverview, FL | 3.0 | 2.5 | 1897 | $2,600 | $1.37 | 1d | 1 | 0.17mi |
| 11167 Leland Groves Dr Riverview, FL | 5.0 | 3.0 | 2526 | $3,500 | $1.39 | 26d | 1 | 0.38mi |
| 11176 Leland Groves Dr Riverview, FL | 4.0 | 2.5 | 2318 | $2,700 | $1.16 | 7d | 1 | 0.41mi |
| 14525 Scottburgh Glen Dr Wimauma, FL | 3.0 | 2.0 | 1704 | $3,300 | $1.94 | 24d | 1 | 0.70mi |
| 10614 Shady Branch Dr Riverview, FL | 4.0 | 2.5 | 2482 | $2,286 | $0.92 | 16d | 1 | 0.73mi |
| 14010 Hollow Leaf Pl Riverview, FL | 3.0 | 2.0 | 1670 | $2,195 | $1.31 | 12d | 1 | 0.81mi |
| 11510 Harlan Eddy Ct Riverview, FL | 4.0 | 2.0 | 2351 | $2,700 | $1.15 | 26d | 1 | 0.83mi |
| 13655 Artesa Bell Dr Riverview, FL | 4.0 | 3.0 | 2351 | $3,000 | $1.28 | 0d | 1 | 0.87mi |
| 14435 Barley Field Dr Wimauma, FL | 4.0 | 2.0 | 2046 | $2,231 | $1.09 | 16d | 1 | 0.89mi |
| 14437 Barley Field Dr Wimauma, FL | 4.0 | 2.5 | 2280 | $2,296 | $1.01 | 26d | 1 | 0.89mi |
| 11164 Golden Silence Dr Riverview, FL | 3.0 | 2.0 | 1930 | $2,050 | $1.06 | 26d | 1 | 0.91mi |
| 10405 Apollo Manor Cir Riverview, FL | 1.0–3.0 | 1.0–2.0 | 1116 | $3,163 | $2.83 | 1d | 30 | 1.01mi |
| 11211 Flora Springs Dr Riverview, FL | 5.0 | 3.0 | 2320 | $2,723 | $1.17 | 26d | 1 | 1.01mi |
| 13625 Silver Charm Ct Riverview, FL | 4.0 | 2.5 | 1907 | $2,350 | $1.23 | 26d | 1 | 1.01mi |
| 10805 Australian Pine Dr Riverview, FL | 3.0 | 2.0 | 1897 | $2,350 | $1.24 | 26d | 1 | 1.02mi |
| 10237 Carloway Hills Dr Wimauma, FL | 4.0 | 2.5 | 1914 | $2,526 | $1.32 | 1d | 1 | 1.02mi |
| 11025 Golden Silence Dr Riverview, FL | 3.0 | 2.5 | 1785 | $2,210 | $1.24 | 16d | 1 | 1.04mi |
| 11009 Golden Silence Dr Riverview, FL | 4.0 | 2.5 | 2154 | $2,800 | $1.30 | 26d | 1 | 1.05mi |
| 14339 Easy Goer St Ruskin, FL | 3.0 | 2.5 | 1701 | $2,350 | $1.38 | 24d | 1 | 1.09mi |
| 14471 Stagedoor Johnny Pl Ruskin, FL | 1.0–3.0 | 1.0–2.0 | 1138 | $2,344 | $2.06 | 0d | 20 | 1.09mi |
| 10438 Carloway Hills Dr Wimauma, FL | 4.0 | 3.0 | 1860 | $2,500 | $1.34 | 26d | 1 | 1.10mi |
| 14452 Easy Goer St Ruskin, FL | 3.0 | 2.5 | 1701 | $2,250 | $1.32 | 14d | 1 | 1.10mi |
| 14409 Easy Goer St Ruskin, FL | 3.0 | 2.5 | 1666 | $1,800 | $1.08 | 26d | 1 | 1.11mi |
| 14442 Editors Note St Ruskin, FL | 3.0 | 2.5 | 1701 | $2,100 | $1.23 | 7d | 1 | 1.12mi |
| 14906 Imperial Purple Ln Wimauma, FL | 3.0 | 2.0 | 1771 | $2,250 | $1.27 | 20d | 1 | 1.14mi |
| 14906 Imperial Purple Ln Wimauma, FL | 3.0 | 2.0 | 1561 | $2,250 | $1.44 | 7d | 1 | 1.14mi |
| 10925 Subtle Trail Dr Riverview, FL | 3.0 | 2.0 | 1716 | $2,000 | $1.17 | 26d | 1 | 1.15mi |
| 13465 Fladgate Mark Dr Riverview, FL | 4.0 | 2.0 | 1544 | $2,045 | $1.32 | 1d | 1 | 1.18mi |
| 13465 Fladgate Mark Dr Riverview, FL | 4.0 | 2.0 | 1544 | $2,045 | $1.32 | 7d | 1 | 1.18mi |
| 10610 Opus Dr Riverview, FL | 3.0 | 2.0 | 1292 | $1,999 | $1.55 | 4d | 1 | 1.19mi |
| 10401 Opus Dr Riverview, FL | 3.0 | 2.0 | 1341 | $2,095 | $1.56 | 7d | 1 | 1.20mi |
| 10206 Stedfast Ct Ruskin, FL | 3.0 | 2.0 | 2051 | $2,650 | $1.29 | 26d | 1 | 1.22mi |
| 10220 Newminster Loop Ruskin, FL | 4.0 | 2.5 | 2483 | $2,315 | $0.93 | 16d | 1 | 1.25mi |
| 11110 Cherrywood Ln Riverview, FL | 3.0 | 2.0 | 1264 | $2,045 | $1.62 | 7d | 1 | 1.28mi |
| 11105 Cherrywood Ln Riverview, FL | 4.0 | 2.0 | 1364 | $2,110 | $1.55 | 26d | 1 | 1.30mi |
| 13423 Beechberry Dr Riverview, FL | 4.0 | 2.5 | 2322 | $2,795 | $1.20 | 0d | 1 | 1.32mi |
HOA detail
- Monthly dues
- $11 · $132/yr
Listing history 9 events
-
2026-06-21days on market $330,000 Active 12 DOM
-
2026-06-18days on market $330,000 Active 9 DOM
-
2026-06-17days on market $330,000 Active 8 DOM
-
2026-06-16days on market $330,000 Active 7 DOM
-
2026-06-15days on market $330,000 Active 6 DOM
-
2026-06-13days on market $330,000 Active 4 DOM
-
2026-06-13days on market $330,000 Active 3 DOM
-
2026-06-10remarks 495-char remark
-
2026-06-10$330,000 Active 1 DOM
ⓘ Source: listings_history table (triggers on properties + properties_extension) + one-shot
backfill from property_details.listing_events for pre-trigger history.
Tax reassessment forecast FL · Resets to sale price
- Current annual tax
- $5,884 · $490/mo
- Projected year-2 tax
- $5,884 · $490/mo
- Expected delta
- $0/yr ($0/mo · 0.0%)
ⓘ Screening estimate from a state-policy table — verify with the county assessor before closing.
Climate risk First Street
- Flood 1/10 Low FEMA zone X (unshaded) · 0% chance over 30 yrs
- Wildfire 5/10 Major
- Heat 10/10 Extreme 7 d/yr ≥109°F today · 27 d/yr by 30 yrs out
- Wind 9/10 Extreme 99% chance of damaging wind over 30 yrs
- Air quality 3/10 Moderate 3 unhealthy d/yr today · 3 by 30 yrs out
Nearby sold comps map
Loading sold comps map…
Walkable amenities ~0.75 mi
Loading nearby amenities…
Taxation est. · year 1
- Rental income
- $32,952
- − Mortgage interest
- −$18,485
- − Property taxes
- −$5,884
- − Insurance
- −$1,650
- − Repairs & maintenance
- −$2,636
- − Management
- −$2,636
- − HOA
- −$132
- − Depreciation
- −$9,600
- Taxable loss
- −$8,071
- Est. tax savings @ 24.0%
- +$1,937
- After-tax cash flow
- $-463/yr
For passive investors: Depreciation is non-cash, so a rental often shows a tax loss while cash-flowing — sheltering income. Rental losses are passive: they offset passive income freely, and up to $25,000/yr can offset ordinary (W-2) income if you actively participate and your MAGI is under $100k (phasing out to $0 by $150k); unused losses carry forward. On sale, claimed depreciation is recaptured at up to 25%, and gains may owe capital-gains tax (a 1031 exchange can defer both). Figures are a year-1 estimate at your 24.0% rate — not tax advice; consult a CPA.
Schools (NCES district)
- District
- Hillsborough
- NCES district ID
- 1200870
- Math proficiency
- 47% ▼ -8.00%
- Reading proficiency
- 50% ▼ -4.00%
- Median HH income
- $50,622
- Composite
- 41.6/100
- National rank
- #3435
- State rank
- #41 of 73 in FL
Livability — Riverview
- Score
- 79/100
- State rank
- #134
- US rank
- #2000
Category grades
Schools grade is shown separately in the Schools card above.
Census & demographics
- Census place
- Riverview, FL
- County
- Hillsborough County · 1,540,968 people
- City population
- 137,988
- Metro
- Tampa-St. Petersburg-Clearwater, FL
- Population (ZIP)
- 49,470
- Household income
- $116,134
- Rent vs Own
- Severe rent burden
- 258.0
Population outlook (Hillsborough County) Hauer SSP2
- Today (2025)
- 1,607,022 people
- By 2030
- 1,733,968 · +7.9%
- By 2040
- 1,979,565 · +23.2%
- By 2050
- 2,203,427 · +37.1%
- By 2075
- 2,667,893 · +66.0%
- By 2100
- 2,891,558 · +79.9%
Race, ethnicity, and origin ACS 2023
- Neighborhood character
- Highly diverse neighborhood (Simpson 0.71)
- Race & ethnicity
- White 42% Hispanic / Latino 25% Black 24% Two or more races 19% Asian 5%
- Hispanic origin (detail)
- Mexican 3% Puerto Rican 12% Cuban 3% Dominican 1%
- Common ancestry
- Hispanic 1% British 1% Romanian 1%
- Foreign-born
- 17% · Canada, Jamaica, China
- Languages at home
- 73% English-only · Spanish 19% Other Indo-European 2% French/Haitian/Cajun 1%
Political lean MEDSL · Hillsborough
- 2024 margin
- Toss-up / Even · D 47.8% · R 50.9% · Other 1.3%
- 2008→2024 swing
- -10.2pp toward R · 2008: 7.1pp · 2024: -3.1pp
- All cycles
- 2024: R+3.1 2020: D+6.9 2016: D+6.8 2012: D+6.7 2008: D+7.1
Not yet ingested
- Civics
- —
Market trends
- HPI YoY
- ▼ -1.42%
- Current HPI
- 240.5825
- Rent YoY
- ▲ 1.18%
- Metro
- Tampa-St. Petersburg-Clearwater, FL
- State GDP YoY
- ▲ 3.28%
- F500 in state
- 36
Industry mix (Fortune 500 HQ in FL)
| Industry | F500 HQs | Revenue |
|---|---|---|
| Industrial Technology | 2 | $29B |
|
||
| Insurance | 2 | $17B |
|
||
| Retail | 1 | $60B |
|
||
| Technology Distribution | 1 | $58B |
|
||
| Homebuilding | 1 | $35B |
|
||
| Technology Manufacturing | 1 | $35B |
|
||
Price history
+58.7% since first listed6 events — show timeline
- 2026-06-09 Listed $330,000 Stellar MLS as Distributed by MLS Grid
- 2019-01-23 Sold (MLS) $212,340 Stellar MLS as Distributed by MLS Grid
- 2018-11-20 Price Changed $212,340 Stellar MLS as Distributed by MLS Grid
- 2018-11-20 Pending — Stellar MLS as Distributed by MLS Grid
- 2018-09-19 Price Changed $211,940 Stellar MLS as Distributed by MLS Grid
- 2018-09-12 Listed $207,890 Stellar MLS as Distributed by MLS Grid
Property tax history
+16.8%/yrLatest (2025): $5,884 · +6.1% YoY. Source: county tax records.
Cash-flow waterfall
monthlySold comps — $/sqft
last 12 mo · ≤1 miLoading sold comps…