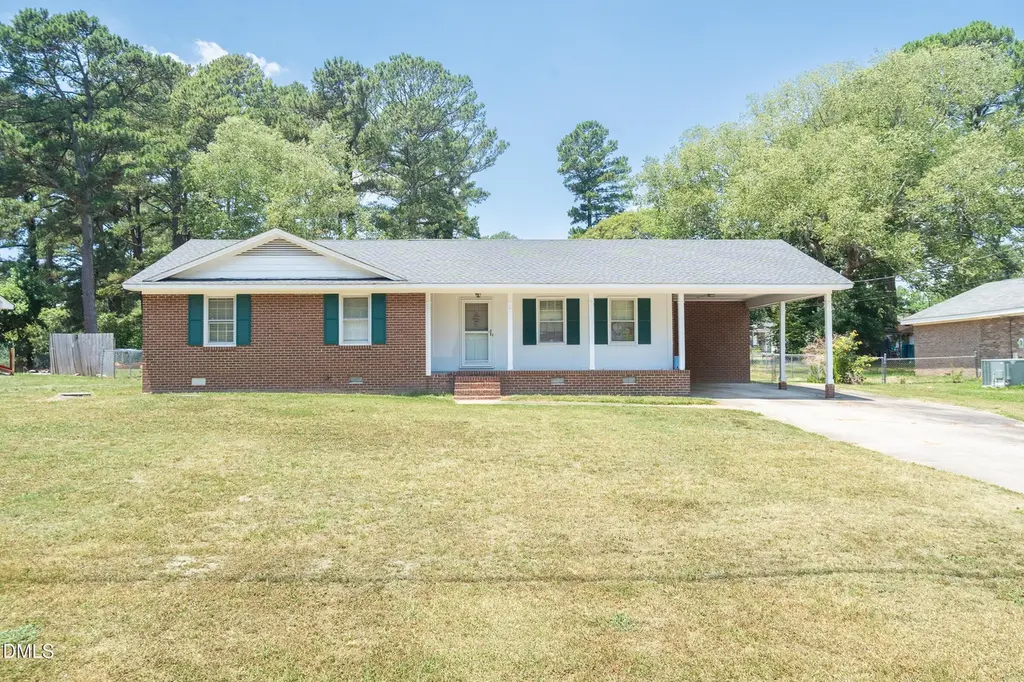
3011 Eliza Pl N · Wilson, NC
Flood risk 4/10 · Minor
- FEMA flood zone
- X (shaded)
- Chance of flooding over 30 yrs
- 0.2%
- Est. flood insurance / yr
- $507 – $1,088
Fire risk 3/10 · Minor
- Est. fire insurance / yr
- $906 – $1,684
Heat risk 7/10 · Major
- Hot days now (above 108°F)
- 7 days/yr
- Hot days in 30 yrs
- 16 days/yr
Wind risk 6/10 · Moderate
- Chance of severe wind over 30 yrs
- 65.0%
Air-quality risk 2/10 · Minimal
- Unhealthy air days now
- 2 days/yr
- Unhealthy air days in 30 yrs
- 2 days/yr
Risk factors via First Street. Map © Google.
Why this score? — see what drove the C grade
The composite is a weighted blend of 9 inputs, each scored 0–100. Each bar is that input's sub-score; the figure is the points it added to the 100-point composite (weight × sub-score).
- Cash flow +21.0/30.0
- ARV discount +15.0/15.0
- DSCR +6.7/10.0
- 1% rule +4.8/10.0
- Schools +3.3/10.0
- Livability +3.2/5.0
- Rent growth +2.5/5.0
- Condition / age +2.5/5.0
- Appreciation +0.0/10.0
$175,000
🖨 Deal sheet 📄 Offer letter ✓ Due diligence
Listing remarks MLS
Brick Ranch with 3 Bedrooms in New Hope School District. Formal Dining Room, cozy Living Room with gas log fireplace, Roomy Kitchen with lots of storage, 2 stoves, and tile backsplash. Master Bedroom with Full Bath en suite. 2 more Guest Rooms and another Full Bath. Screened Porch and Deck overlooking tremendous fenced Back Yard. Portion of property is in flood plain. Current owners are not required to have flood insurance.
Key facts
- Flexible floor plan
- Classic brick ranch
- Large lot
Tags
Property features AI
Finance
- Other: Lot approximately 0.41 acres
- HOA & community: No homeowners association
Exterior
- Parking: Carport (1 space)
- Utilities: Public water; Public sewer
- Home design: Single-story house; One level
- Construction: Brick construction; Shingle roof; Built as a house
- Exterior features: Fenced backyard; Back yard fencing
Interior
- Kitchen: Electric range; Refrigerator
- Bedrooms: 3 bedrooms total; 1 main-level bedroom
- Flooring: Hardwood; Plank
- Bathrooms: 2 full bathrooms
- Heating & cooling: No heating; Central air; Ceiling fan(s)
- Interior features: Electric range; Refrigerator; Hardwood and plank flooring
Neighborhood map
What this means for you Summary
Snapshot
- This is a 3-bed/2.0-bath single-family listed at $175k.
Deal economics
- At list price, monthly cash flow is $247 ($3k/yr) — positive.
- The deal already cash-flows at list — no discount required.
- To meet the 1% rule (rent ≥ 1% of price), the offer needs to be $171k (2.2% below list).
- Recommended offer: $171k (2.2% below list) — sets the bar for 1% rule.
- Cap rate 8.0% vs local median 3.4% in Wilson — top-decile yield for the area; either an underpriced asset or a hidden risk that comps aren't pricing in. Stress-test before assuming the spread holds.
Location & tenants
- Location reads 64/100 on livability (#374 in NC) — a middle-class / working-renter tenant base. Strengths: cost of living A+, housing A+, health & safety A; Watch: schools F, crime F, amenities F.
- Wilson County Schools (rural): math 38% / reading 40% proficiency, ranked #119 of 178 in NC (top 67%) — families likely to look elsewhere, expect single-tenant / working-renter base with shorter leases.
- Market conditions: 161 active listings in the ZIP; solid renter incomes; 580 units permitted in Wilson County in 2024 (168 in 5+ unit buildings).
Forward outlook
- Local home prices are declining (-3.0%/yr); year-one equity from $1k of loan paydown is wiped out by about $5k of value loss. Plan a longer hold.
- Wilson County population projected to shrink 5% by 2050 — rents likely to lag national; underwrite the cash flow, not the appreciation.
Negotiation context
- Only 6 days on market — expect competitive offers; lowballing is unlikely to land.
- 2 sale attempts since 5y ago with the ask held roughly flat each time — persistent listings suggest the price (not the market) is what's stuck; bring a comps-based counter.
Risks & watch-outs
- Climate carrying-cost: major wind risk, 65% chance of damaging wind over 30y; extreme-heat days projected 7→16/yr by 2055 (HVAC capex compounding) — expect insurance premiums to compound above CPI over the hold.
Questions for the listing agent
- Built in 1975 — when were the roof, HVAC, electrical panel, plumbing, and water heater last replaced?
- Is there a deadline driving the sale (1031 exchange, divorce, estate, relocation)? That informs how much negotiation room exists.
- Schools are F-rated, which usually means shorter tenancies and higher turnover. Who's the typical renter profile here, and what's been the actual vacancy rate?
- Crime grade is F in this area — have there been break-ins, vandalism, or insurance claims at this property in the last 3 years? What carrier currently insures it and at what premium?
- What's the average days-on-market for RENTAL listings here right now (not sales)? A rising rental-DOM trend means longer vacancies and softer asking-rent achievability than the comps imply.
- What's the recent tenant-quality profile in this submarket — average credit score on applications, eviction rate, late-payment / NSF rate, and stable-employment percentage? A property-management company in the area should have these aggregated.
- How much new for-sale + rental construction is in the pipeline within 1–3 miles? Heavy new supply typically softens prices + rents 12–24 months out; constrained supply supports both.
Investment metrics
- 1% rule
- 0.98% ✗
- Cap rate
- 7.99%
- Cash-on-cash
- 6.05%
- DSCR
- 1.27
- GRM
- 8.5
CMA / ARV
- ARV (on-the-fly)
- $280,922
- Comps found
- 12
Show comp detail 12 sales within ~0.75 mi
| Address | Dist | Beds/Ba | Sqft | Sold | Price | $/sf | Match |
|---|---|---|---|---|---|---|---|
| 3719 Lightwater Ln | 0.34mi | 3/2.0 | 1,441 (+1%) | 8mo | $286,500 | $199 | 76 |
| 3806 Lightwater Ln | 0.42mi | 3/2.0 | 1,383 (-3%) | 1mo | $286,000 | $207 | 75 |
| 3804 Lightwater Ln N | 0.41mi | 3/2.0 | 1,471 (+3%) | 3mo | $249,900 | $170 | 73 |
| 3828 Valleyfield Ln | 0.39mi | 3/2.0 | 1,500 (+5%) | 2mo | $328,000 | $219 | 72 |
| 3831 Bucklin Dr NE | 0.46mi | 3/2.0 | 1,365 (-4%) | 5mo | $257,000 | $188 | 67 |
| 3811 Valleyfield Ln | 0.50mi | 3/2.0 | 1,368 (-4%) | 3mo | $270,000 | $197 | 67 |
| 3809 Valleyfield Ln | 0.51mi | 3/2.0 | 1,352 (-5%) | 6mo | $277,500 | $205 | 63 |
| 3842 Bucklin Dr N | 0.40mi | 3/2.0 | 1,528 (+7%) | 8mo | $279,900 | $183 | 62 |
| 3825 Valleyfield Ln | 0.42mi | 3/2.0 | 1,574 (+10%) | 4mo | $334,900 | $213 | 60 |
| 3530 Shadow Ridge Rd N | 0.63mi | 3/2.0 | 1,516 (+6%) | 5mo | $240,000 | $158 | 56 |
| 3535 Shadow Ridge Rd N | 0.68mi | 3/2.0 | 1,570 (+10%) | 1mo | $269,900 | $172 | 51 |
| 3610 Shadow Ridge Rd N | 0.66mi | 3/2.0 | 1,623 (+14%) | 2mo | $282,000 | $174 | 44 |
Match score weights: distance 35% · size 25% · config 20% · recency 20%. Top-matched comps best support the ARV.
Projected returns pro-forma
-3.0% appreciation · 3.0% rent growth · sell at horizon
- IRR
- -7.0%
- Equity multiple
- 0.74×
- Total profit
- $-12,674
- Equity at exit
- $26,093
- IRR
- 2.6%
- Equity multiple
- 1.18×
- Total profit
- $9,052
- Equity at exit
- $15,131
Cash invested: $49,000 (down + closing). Projections, not guarantees.
Landlord ↔ Tenant lean methodology
- Overall (STATE)
- 85 Strongly Landlord-Friendly
- State North Carolina
- 85 Strongly Landlord-Friendly · R+3
- County
- — inherits STATE
- City
- — inherits STATE
ZIP-level market 27896
- Active inventory
- 161
- Price-to-rent
- 8.5×
Monthly cashflow live
- Estimated rent
- $1,711 medium interval (Pro) →
- Mortgage (P&I)
- −$918
- Tax from tax record
- −$114 /mo · $1,370/yr
- Insurance
- −$73
- HOA
- −$0
- Vacancy / Maint / Mgmt
- −$359
- Net cashflow
- $247
Break-even live
UW: 25.0% down · 7.5% · 30yr · 1.5% tax · 5.0% vac · 8.0% maint · 8.0% mgmt
Financing live
Cash to close
- Down payment
- $43,750
- Closing costs
- $5,250
- Reserves months
- —
- Total cash needed
- —
Loan-product check · same deal, 3 products live
Conventional
25% down · 7.5% · 30yr
- Down + closing
- —
- Monthly P&I
- —
- Monthly cashflow
- —
- DSCR
- —
- Eligible?
- —
Personal DTI + credit; lowest rate.
DSCR
20% down · 8.5% · 30yr
- Down + closing
- —
- Monthly P&I
- —
- Monthly cashflow
- —
- DSCR
- —
- Eligible?
- —
No personal income docs; deal must DSCR.
Hard money
10% down · 12.0% · 12mo
- Down + closing
- —
- Monthly P&I
- —
- Monthly cashflow
- —
- DSCR
- —
- Eligible?
- —
Short-term bridge; refi at stabilization.
Listing history 7 events
-
2026-06-19days on market $175,000 Active 6 DOM
-
2026-06-18days on market $175,000 Active 5 DOM
-
2026-06-17days on market $175,000 Active 4 DOM
-
2026-06-16days on market $175,000 Active 3 DOM
-
2026-06-15days on market $175,000 Active 2 DOM
-
2026-06-14remarks 699-char remark
-
2026-06-14$175,000 Active 1 DOM
ⓘ Source: listings_history table (triggers on properties + properties_extension) + one-shot
backfill from property_details.listing_events for pre-trigger history.
Tax reassessment forecast NC · Resets to sale price
- Current annual tax
- $1,370 · $114/mo
- Projected year-2 tax
- $1,435 · $120/mo
- Expected delta
- +$65/yr (+$5/mo · 4.8%)
ⓘ Screening estimate from a state-policy table — verify with the county assessor before closing.
Climate risk First Street
- Flood 4/10 Moderate FEMA zone X (shaded) · 20% chance over 30 yrs
- Wildfire 3/10 Moderate
- Heat 7/10 Severe 7 d/yr ≥108°F today · 16 d/yr by 30 yrs out
- Wind 6/10 Major 65% chance of damaging wind over 30 yrs
- Air quality 2/10 Low 2 unhealthy d/yr today · 2 by 30 yrs out
Nearby sold comps map
Loading sold comps map…
Walkable amenities ~0.75 mi
Loading nearby amenities…
Taxation est. · year 1
- Rental income
- $20,531
- − Mortgage interest
- −$9,803
- − Property taxes
- −$1,370
- − Insurance
- −$875
- − Repairs & maintenance
- −$1,643
- − Management
- −$1,643
- − Depreciation
- −$5,091
- Taxable income
- $108
- Est. tax owed @ 24.0%
- −$26
- After-tax cash flow
- $2,936/yr
For passive investors: Depreciation is non-cash, so a rental often shows a tax loss while cash-flowing — sheltering income. Rental losses are passive: they offset passive income freely, and up to $25,000/yr can offset ordinary (W-2) income if you actively participate and your MAGI is under $100k (phasing out to $0 by $150k); unused losses carry forward. On sale, claimed depreciation is recaptured at up to 25%, and gains may owe capital-gains tax (a 1031 exchange can defer both). Figures are a year-1 estimate at your 24.0% rate — not tax advice; consult a CPA.
Schools (NCES district)
- District
- Wilson County Schools
- NCES district ID
- 3705020
- Math proficiency
- 38% ▲ 2.00%
- Reading proficiency
- 40% ▼ -1.00%
- Median HH income
- $39,342
- Composite
- 32.64/100
- National rank
- #5665
- State rank
- #119 of 178 in NC
Livability — Wilson
- Score
- 64/100
- State rank
- #374
- US rank
- #14674
Category grades
Schools grade is shown separately in the Schools card above.
Census & demographics
- County
- Wilson County · 57,967 people
- City population
- 57,967
- Metro
- Wilson, NC
- Population (ZIP)
- 19,455
- Household income
- $75,696
- Rent vs Own
- Severe rent burden
- 311.0
Population outlook (Wilson County) Hauer SSP2
- Today (2025)
- 82,765 people
- By 2030
- 82,492 · -0.3%
- By 2040
- 81,054 · -2.1%
- By 2050
- 78,610 · -5.0%
- By 2075
- 71,865 · -13.2%
- By 2100
- 62,792 · -24.1%
Race, ethnicity, and origin ACS 2023
- Neighborhood character
- Diverse neighborhood (Simpson 0.56)
- Race & ethnicity
- White 61% Black 24% Hispanic / Latino 9% Two or more races 5% Asian 3%
- Hispanic origin (detail)
- Mexican 6%
- Common ancestry
- Italian 1% Slovak 1% Serbian 1%
- Foreign-born
- 7% · Canada, Vietnam, Jamaica
- Languages at home
- 89% English-only · Spanish 8% Vietnamese 1% Other Asian/Pacific 1%
Political lean MEDSL · Wilson
- 2024 margin
- Toss-up / Even · D 49.8% · R 49.4%
- 2008→2024 swing
- -5.7pp toward R · 2008: 6.1pp · 2024: 0.4pp
- All cycles
- 2024: D+0.4 2020: D+2.9 2016: D+5.6 2012: D+7.3 2008: D+6.1
Not yet ingested
- Civics
- —
Market trends
- HPI YoY
- ▼ -164.90%
- Current HPI
- 173.5082
- Rent YoY
- —
- Metro
- Wilson, NC
- State GDP YoY
- ▲ 3.28%
- F500 in state
- 26
Industry mix (Fortune 500 HQ in NC)
| Industry | F500 HQs | Revenue |
|---|---|---|
| Financial Services | 2 | $213B |
|
||
| Retail | 2 | $95B |
|
||
| Industrial Conglomerate | 1 | $38B |
|
||
| Metals / Steel | 1 | $35B |
|
||
| Utilities | 1 | $30B |
|
||
| Industrial Machinery | 1 | $19B |
|
||
Price history
+82.3% since first listed5 events — show timeline
- 2026-06-13 Listed $175,000 TMLS
- 2021-08-06 Sold (Public Records) $165,000 Public Records
- 2021-08-06 Sold (MLS) $165,000 Hive MLS
- 2021-06-22 Listed $149,900 Hive MLS
- 2011-09-09 Sold (Public Records) $96,000 Public Records
Property tax history
+2.7%/yrLatest (2025): $1,370 · -0.0% YoY. Source: county tax records.
Cash-flow waterfall
monthlySold comps — $/sqft
last 12 mo · ≤1 miLoading sold comps…