 Multi-family
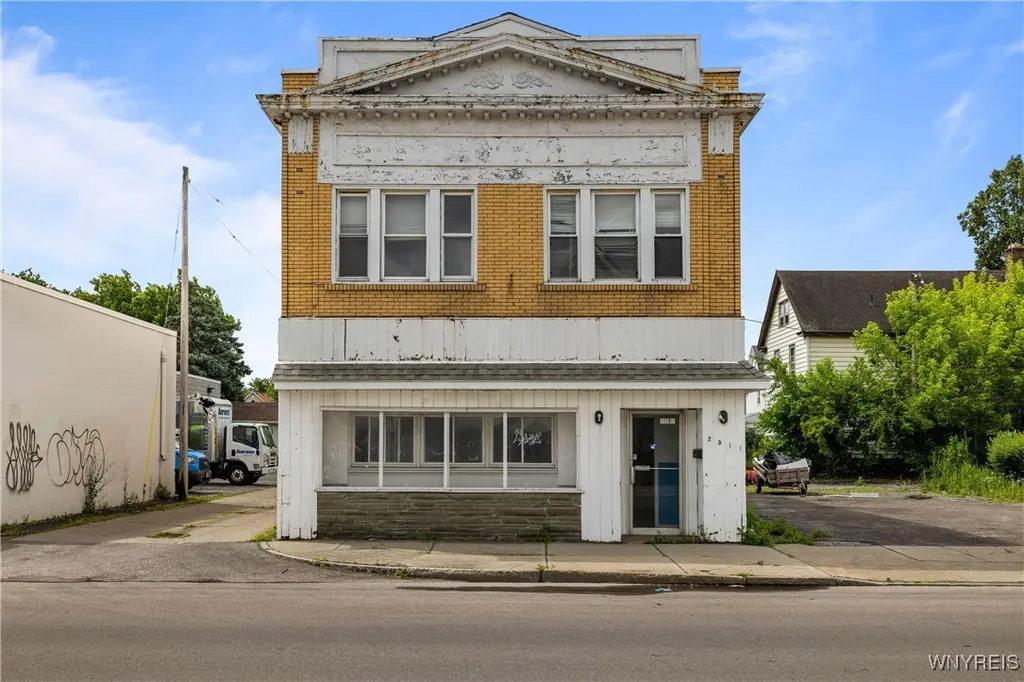
2511 Pine Ave · Niagara Falls, NY
Flood risk No data
- FEMA flood zone
- —
- Chance of flooding over 30 yrs
- —
- Est. flood insurance / yr
- —
Fire risk No data
- Est. fire insurance / yr
- —
Heat risk No data
- Hot days now (above threshold)
- —
- Hot days in 30 yrs
- —
Wind risk No data
- Chance of severe wind over 30 yrs
- —
Air-quality risk No data
- Unhealthy air days now
- —
- Unhealthy air days in 30 yrs
- —
Risk factors via First Street. Map © Google.
Why this score? — see what drove the A grade
The composite is a weighted blend of 9 inputs, each scored 0–100. Each bar is that input's sub-score; the figure is the points it added to the 100-point composite (weight × sub-score).
- Cash flow +30.0/30.0
- ARV discount +15.0/15.0
- 1% rule +10.0/10.0
- DSCR +10.0/10.0
- Appreciation +10.0/10.0
- Rent growth +4.7/5.0
- Livability +3.0/5.0
- Schools +2.5/10.0
- Condition / age +2.5/5.0
$219,000
🖨 Deal sheet 📄 Offer letter ✓ Due diligence
Multi-family units
County records classify this as Multi-Family (2-4 Unit). Listing-text estimate: 1 unit. estimate disagrees with records
Listing remarks MLS
Discover the potential of this solid brick mixed-use property on busy Pine Avenue in Niagara Falls, NY. The front retail or office space offers excellent visibility and steady foot traffic, making it ideal for a business looking for strong exposure. Behind the storefront are four residential units, including two studio apartments and two one-bedroom apartments, creating consistent rental income opportunities. This sale also includes the adjacent vacant lot at 2509 Pine Ave (APN 291100-159-026-0001-008-000). The lot offers 40 feet of frontage and 84 feet of depth, totaling 3,360 sq ft, and is paved with blacktop, providing valuable off-street parking and added convenience for both commercial and residential use. With a prime location surrounded by established businesses and local amenities, this property presents a strong investment opportunity for buyers seeking a versatile, income-producing asset in the heart of the Pine Avenue corridor.
Key facts
- 2,436 sq ft lot
- Built 1925
- Listed 163 days
Neighborhood map
What this means for you Summary
Snapshot
- This is a 3-bed/?-bath multifamily listed at $219k.
Deal economics
- At list price, monthly cash flow is $2k ($25k/yr) — positive.
- The deal already cash-flows at list — no discount required.
- Meets the 1% rule at list price ($5k rent vs $219k).
- Recommended offer: $193k (12.0% below list) — sets the bar for market timing.
- Cap rate 17.7% vs local median 7.7% in Niagara Falls — top-decile yield for the area; either an underpriced asset or a hidden risk that comps aren't pricing in. Stress-test before assuming the spread holds.
Location & tenants
- Location reads 60/100 on livability (#956 in NY) — a middle-class / working-renter tenant base. Strengths: cost of living A+, housing A+; Watch: schools F, crime F, amenities F.
- Niagara Falls City School District (urban): math 26% / reading 34% proficiency, ranked #578 of 590 in NY (top 98%) — families likely to look elsewhere, expect single-tenant / working-renter base with shorter leases; 66% free/reduced lunch — lower-income household profile, screen leases tightly.
- Market conditions: Rents rising fast (+8.8%/yr); 164 active listings in the ZIP; lower-income renter base — watch delinquency; 167 units permitted in Niagara County in 2024 (0 in 5+ unit buildings).
- At $4,555/mo this rent would consume 158% of the median local household income ($35k/yr) (locally 954% of renters already pay >50% of income on rent) — very limited rent-growth headroom before tenants either downsize or default.
Forward outlook
- In year one you build about $23k of equity ($2k loan paydown + $22k appreciation (10.0% local appreciation)).
- Niagara County population projected at -19% by 2050 — secular population decline; favor cash flow + early exit over multi-decade hold.
- At projected returns (10.0% appreciation + 8.0% rent growth), your $61k cash investment doubles in ~2 years — after that, you're playing with house money.
- By year 2, paydown + projected appreciation supports a ~$38k cash-out refi (75% LTV) — recoverable capital for the next deal without selling this one.
Negotiation context
- It's been on market 163 days — a 12% lower offer ($193k) is reasonable based on typical stale-listing flexibility.
- 6 sale attempts since 14y ago with the ask held roughly flat each time — persistent listings suggest the price (not the market) is what's stuck; bring a comps-based counter.
Risks & watch-outs
- Watch-outs: built in 1925 — expect roof / HVAC / electrical / plumbing capex.
Questions for the listing agent
- It's been on market 163 days. Have you received any prior offers? Is the seller open to a 12% concession, seller financing, or rate buy-down credit?
- Built in 1925 — when were the roof, HVAC, electrical panel, plumbing, and water heater last replaced?
- Why hasn't it sold? Are there any deal-killer items the seller is aware of (foundation, flood, title, zoning, code violations)?
- Is there a deadline driving the sale (1031 exchange, divorce, estate, relocation)? That informs how much negotiation room exists.
- Schools are F-rated, which usually means shorter tenancies and higher turnover. Who's the typical renter profile here, and what's been the actual vacancy rate?
- Crime grade is F in this area — have there been break-ins, vandalism, or insurance claims at this property in the last 3 years? What carrier currently insures it and at what premium?
- What's the average days-on-market for RENTAL listings here right now (not sales)? A rising rental-DOM trend means longer vacancies and softer asking-rent achievability than the comps imply.
- What's the recent tenant-quality profile in this submarket — average credit score on applications, eviction rate, late-payment / NSF rate, and stable-employment percentage? A property-management company in the area should have these aggregated.
- How much new apartment / multifamily construction is in the pipeline within 1–3 miles? Heavy new supply (>2% of stock underway) typically softens rents 12–24 months out; light construction supports rent growth.
Investment metrics
- 1% rule
- 2.08% ✓
- Cap rate
- 17.72%
- Cash-on-cash
- 40.80%
- DSCR
- 2.82
- GRM
- 4.0
CMA / ARV
- ARV (median comp)
- $308,317
- List price
- $219,000
- Delta
- -28.97%
- Verdict
- UNDERPRICED
- Comps
- 20 within 1.0 mi
Show comp detail 1 sale within ~0.75 mi
| Address | Dist | Beds/Ba | Sqft | Sold | Price | $/sf | Match |
|---|---|---|---|---|---|---|---|
| 742 19th St | 0.40mi | 3/2.5 | 4,275 (-11%) | 6mo | $115,000 | $27 | 57 |
Match score weights: distance 35% · size 25% · config 20% · recency 20%. Top-matched comps best support the ARV.
Projected returns pro-forma
10.0% appreciation · 8.0% rent growth · sell at horizon
- IRR
- 59.4%
- Equity multiple
- 5.50×
- Total profit
- $276,208
- Equity at exit
- $197,293
- IRR
- 55.0%
- Equity multiple
- 13.54×
- Total profit
- $768,731
- Equity at exit
- $425,469
Cash invested: $61,320 (down + closing). Projections, not guarantees.
Landlord ↔ Tenant lean methodology
- Overall (STATE)
- 15 Strongly Tenant-Friendly
- State New York
- 15 Strongly Tenant-Friendly · D+10
- County
- — inherits STATE
- City
- — inherits STATE
ZIP-level market 14301
- Home prices YoY
- 6.2%
- Rents YoY
- 8.8%
- Active inventory
- 164
- Price-to-rent
- 16.0×
Monthly cashflow live
- Estimated rent
- $4,555 high interval (Pro) →
- Mortgage (P&I)
- −$1,148
- Tax est. 1.5%
- −$274 /mo · $3,285/yr
- Insurance
- −$91
- HOA
- −$0
- Vacancy / Maint / Mgmt
- −$957
- Net cashflow
- $2,085
Break-even live
4-unit breakdown (identical units grouped — click to expand)
| Units | Beds | Baths | Est. rent |
|---|---|---|---|
| 4× units | 1 | 1 | $4,556 |
| #1 | 1 | 1 | $1,139 |
| #2 | 1 | 1 | $1,139 |
| #3 | 1 | 1 | $1,139 |
| #4 | 1 | 1 | $1,139 |
| Total (4 units) | $4,555 | ||
UW: 25.0% down · 7.5% · 30yr · 1.5% tax · 5.0% vac · 8.0% maint · 8.0% mgmt
Financing live
Cash to close
- Down payment
- $54,750
- Closing costs
- $6,570
- Reserves months
- —
- Total cash needed
- —
Loan-product check · same deal, 3 products live
Conventional
25% down · 7.5% · 30yr
- Down + closing
- —
- Monthly P&I
- —
- Monthly cashflow
- —
- DSCR
- —
- Eligible?
- —
Personal DTI + credit; lowest rate.
DSCR
20% down · 8.5% · 30yr
- Down + closing
- —
- Monthly P&I
- —
- Monthly cashflow
- —
- DSCR
- —
- Eligible?
- —
No personal income docs; deal must DSCR.
Hard money
10% down · 12.0% · 12mo
- Down + closing
- —
- Monthly P&I
- —
- Monthly cashflow
- —
- DSCR
- —
- Eligible?
- —
Short-term bridge; refi at stabilization.
Listing history 24 events
-
2026-06-18days on market $219,000 Active 163 DOM
-
2026-06-17days on market $219,000 Active 162 DOM
-
2026-06-16days on market $219,000 Active 161 DOM
-
2026-06-15days on market $219,000 Active 160 DOM
-
2026-06-13days on market $219,000 Active 158 DOM
-
2026-06-13days on market $219,000 Active 157 DOM
-
2026-06-10days on market $219,000 Active 155 DOM
-
2026-06-09days on market $219,000 Active 154 DOM
-
2026-06-08days on market $219,000 Active 153 DOM
-
2026-06-07days on market $219,000 Active 152 DOM
-
2026-06-03days on market $219,000 Active 148 DOM
-
2026-06-02days on market $219,000 Active 147 DOM
-
2026-06-01days on market $219,000 Active 146 DOM
-
2026-05-31days on market $219,000 Active 145 DOM
-
2026-01-06$219,000 Active 952-char remark
Show marketing remark (952 chars)
Discover the potential of this solid brick mixed-use property on busy Pine Avenue in Niagara Falls, NY. The front retail or office space offers excellent visibility and steady foot traffic, making it ideal for a business looking for strong exposure. Behind the storefront are four residential units, including two studio apartments and two one-bedroom apartments, creating consistent rental income opportunities. This sale also includes the adjacent vacant lot at 2509 Pine Ave (APN 291100-159-026-0001-008-000). The lot offers 40 feet of frontage and 84 feet of depth, totaling 3,360 sq ft, and is paved with blacktop, providing valuable off-street parking and added convenience for both commercial and residential use. With a prime location surrounded by established businesses and local amenities, this property presents a strong investment opportunity for buyers seeking a versatile, income-producing asset in the heart of the Pine Avenue corridor.
-
2025-12-03$214,900 Active
-
2025-10-08price $215,000
-
2025-06-20$225,000 Active
-
2025-04-15historical
-
2025-02-21price $230,000
-
2025-01-09$250,000 Active
-
2015-11-18historical
-
2015-07-24$195,000 Active
-
2012-07-09$200,000
ⓘ Source: listings_history table (triggers on properties + properties_extension) + one-shot
backfill from property_details.listing_events for pre-trigger history.
Nearby sold comps map
Loading sold comps map…
Walkable amenities ~0.75 mi
Loading nearby amenities…
Taxation est. · year 1
- Rental income
- $54,660
- − Mortgage interest
- −$12,267
- − Property taxes
- −$3,285
- − Insurance
- −$1,095
- − Repairs & maintenance
- −$4,373
- − Management
- −$4,373
- − Depreciation
- −$6,371
- Taxable income
- $22,896
- Est. tax owed @ 24.0%
- −$5,495
- After-tax cash flow
- $19,525/yr
For passive investors: Depreciation is non-cash, so a rental often shows a tax loss while cash-flowing — sheltering income. Rental losses are passive: they offset passive income freely, and up to $25,000/yr can offset ordinary (W-2) income if you actively participate and your MAGI is under $100k (phasing out to $0 by $150k); unused losses carry forward. On sale, claimed depreciation is recaptured at up to 25%, and gains may owe capital-gains tax (a 1031 exchange can defer both). Figures are a year-1 estimate at your 24.0% rate — not tax advice; consult a CPA.
Schools (NCES district)
- District
- Niagara Falls City School District
- NCES district ID
- 3620820
- Math proficiency
- 26% ▼ -10.00%
- Reading proficiency
- 34% ▲ 3.00%
- Median HH income
- $32,488
- Composite
- 24.5/100
- National rank
- #7655
- State rank
- #578 of 590 in NY
Livability — Niagara Falls
- Score
- 60/100
- State rank
- #956
- US rank
- #18749
Category grades
Schools grade is shown separately in the Schools card above.
Census & demographics
- Census place
- Niagara Falls, NY
- County
- Niagara County · 157,377 people
- City population
- 62,983
- Metro
- Buffalo-Cheektowaga, NY
- Population (ZIP)
- 10,923
- Household income
- $34,549
- Rent vs Own
- Severe rent burden
- 954.0
Population outlook (Niagara County) Hauer SSP2
- Today (2025)
- 204,149 people
- By 2030
- 197,900 · -3.1%
- By 2040
- 182,239 · -10.7%
- By 2050
- 165,198 · -19.1%
- By 2075
- 129,416 · -36.6%
- By 2100
- 96,222 · -52.9%
Race, ethnicity, and origin ACS 2023
- Neighborhood character
- Diverse neighborhood (Simpson 0.58)
- Race & ethnicity
- White 59% Black 25% Two or more races 8% Hispanic / Latino 8% Asian 2%
- Hispanic origin (detail)
- Puerto Rican 3% Cuban 2%
- Common ancestry
- Romanian 6% Slovak 2% Lithuanian 1%
- Foreign-born
- 5% · Canada, China, Dominican Republic
- Languages at home
- 90% English-only · Spanish 6% Other Indo-European 3% Chinese 1%
Political lean MEDSL · Niagara
- 2024 margin
- R (+14.9) · D 42.5% · R 57.5%
- 2008→2024 swing
- -15.9pp toward R · 2008: 1.0pp · 2024: -14.9pp
- All cycles
- 2024: R+14.9 2020: R+9.7 2016: R+19.0 2012: D+0.6 2008: D+1.0
Not yet ingested
- Civics
- —
Market trends
- HPI YoY
- ▲ 15.41%
- Current HPI
- 266.1457
- Rent YoY
- ▲ 8.79%
- Metro
- Buffalo-Cheektowaga, NY
- State GDP YoY
- ▲ 2.60%
- F500 in state
- 92
Industry mix (Fortune 500 HQ in NY)
| Industry | F500 HQs | Revenue |
|---|---|---|
| Financial Services | 10 | $950B |
|
||
| Consumer Goods | 9 | $162B |
|
||
| Insurance | 4 | $225B |
|
||
| Telecommunications | 2 | $144B |
|
||
| Pharmaceuticals | 2 | $112B |
|
||
| Media / Entertainment | 2 | $69B |
|
||
Price history
+9.5% since first listed10 events — show timeline
- 2026-01-06 Listed $219,000 WNYREIS
- 2025-12-03 Listed $214,900 WNYREIS
- 2025-10-08 Price Changed $215,000 WNYREIS
- 2025-06-20 Listed $225,000 WNYREIS
- 2025-04-15 Listing Removed — WNYREIS
- 2025-02-21 Price Changed $230,000 WNYREIS
- 2025-01-09 Listed $250,000 WNYREIS
- 2015-11-18 Listing Removed — WNYREIS
- 2015-07-24 Listed $195,000 WNYREIS
- 2012-07-09 Listed $200,000 WNYREIS
Cash-flow waterfall
monthlySold comps — $/sqft
last 12 mo · ≤1 miLoading sold comps…