2430 Manor Valley Ln · Sienna, TX
Flood risk 4/10 · Minor
- FEMA flood zone
- X
- Chance of flooding over 30 yrs
- 0.24%
- Est. flood insurance / yr
- $507 – $1,088
Fire risk 4/10 · Minor
- Est. fire insurance / yr
- $1,222 – $2,270
Heat risk 9/10 · Severe
- Hot days now (above 111°F)
- 7 days/yr
- Hot days in 30 yrs
- 23 days/yr
Wind risk 9/10 · Severe
- Chance of severe wind over 30 yrs
- 99.0%
Air-quality risk 2/10 · Minimal
- Unhealthy air days now
- 2 days/yr
- Unhealthy air days in 30 yrs
- 2 days/yr
Risk factors via First Street. Map © Google.
Why this score? — see what drove the C+ grade
The composite is a weighted blend of 9 inputs, each scored 0–100. Each bar is that input's sub-score; the figure is the points it added to the 100-point composite (weight × sub-score).
- Cash flow +22.1/30.0
- ARV discount +8.1/15.0
- DSCR +7.1/10.0
- 1% rule +6.9/10.0
- Schools +4.5/10.0
- Appreciation +4.2/10.0
- Rent growth +2.5/5.0
- Livability +2.5/5.0
- Condition / age +2.5/5.0
$394,800
🖨 Deal sheet 📄 Offer letter ✓ Due diligence
Listing remarks MLS
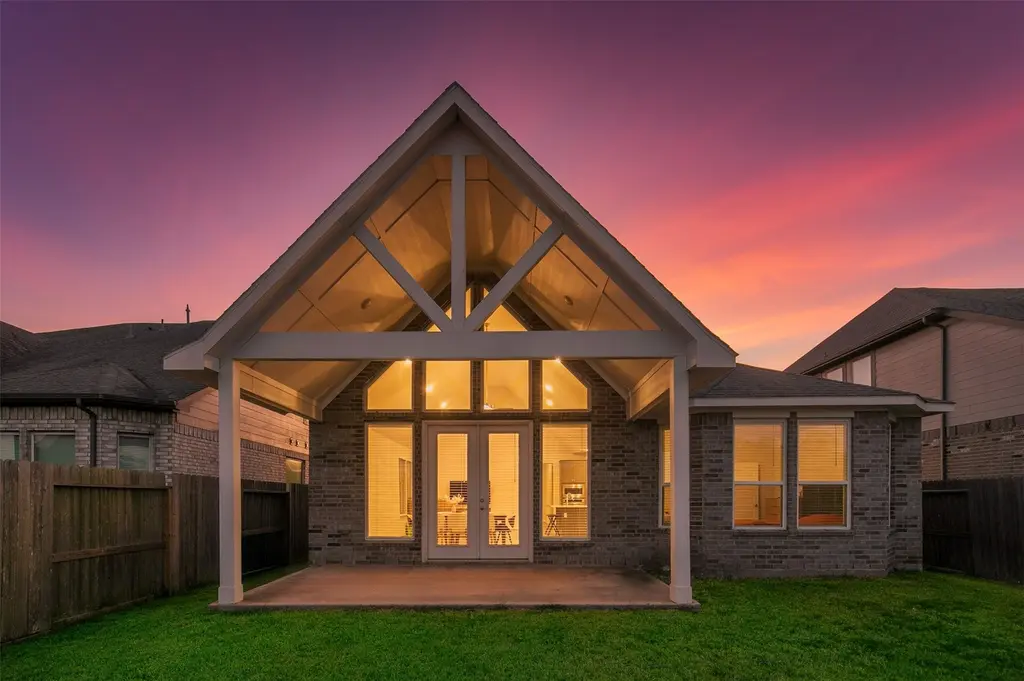
Discover this stunning single-story home that offers privacy and elegance, featuring a charming brick wall at the backyard, providing a peaceful backdrop without back neighbors. The residence boasts three spacious bedrooms and two modern bathrooms, designed with comfort and functionality in mind. The front elevation is truly picturesque, showcasing attractive architectural details that enhance curb appeal and create a welcoming first impression. Inside, you'll find a thoughtfully planned layout that maximizes space and flow, making the home feel much larger than its actual size. Large windows and high ceilings invite abundant natural light, further amplifying the sense of openness. Step outside to a versatile outdoor space, perfect for summer barbecues, outdoor dining, or simply relaxing in your own tranquil oasis. This home combines beauty, practicality, and a prime location, making it an exceptional place to call home.
Key facts
- Front elevation
- Brick wall
- One story home
Tags
Neighborhood map
What this means for you Summary
Snapshot
- This is a 3-bed/2.0-bath single-family listed at $395k.
Deal economics
- At list price, monthly cash flow is $633 ($8k/yr) — positive.
- The deal already cash-flows at list — no discount required.
- Meets the 1% rule at list price ($5k rent vs $395k).
- Recommended offer: $347k (12.0% below list) — sets the bar for market timing.
- Cap rate 8.2% vs local median 3.3% in Sienna — top-decile yield for the area; either an underpriced asset or a hidden risk that comps aren't pricing in. Stress-test before assuming the spread holds.
Location & tenants
- Location reads: area grade C — affects rentability + tenant quality, not the cash-flow math above.
- Fort Bend ISD (suburban): math 44% / reading 53% proficiency, ranked #140 of 826 in TX (top 17%) — families likely to look elsewhere, expect single-tenant / working-renter base with shorter leases.
- Market conditions: Rents soft (-0.1%/yr); 1215 active listings in the ZIP; 3 comparable units currently listed for rent nearby; rentals at typical pace (median 22d on market — plan ~3-4 weeks tenant-placement turnaround); high-income renter base; 12,093 units permitted in Fort Bend County in 2024 (815 in 5+ unit buildings).
- This rent runs 44% of the median local income ($129k/yr) — at the standard rent-burdened threshold; future hikes will face affordability resistance.
Forward outlook
- Local home prices are declining (-1.7%/yr); year-one equity from $3k of loan paydown is wiped out by about $7k of value loss. Plan a longer hold.
- Fort Bend County population projected at +75% by 2050 — long-run rental-demand tailwind backs the buy-and-hold thesis.
Negotiation context
- It's been on market 246 days — a 12% lower offer ($347k) is reasonable based on typical stale-listing flexibility.
- 2 sale attempts since 6y ago with the ask held roughly flat each time — persistent listings suggest the price (not the market) is what's stuck; bring a comps-based counter.
Risks & watch-outs
- Climate carrying-cost: severe wind risk, 99% chance of damaging wind over 30y; extreme-heat days projected 7→23/yr by 2055 (HVAC capex compounding) — expect insurance premiums to compound above CPI over the hold.
Questions for the listing agent
- It's been on market 246 days. Have you received any prior offers? Is the seller open to a 12% concession, seller financing, or rate buy-down credit?
- What does the HOA fee cover, when was the last increase, and are there any pending special assessments or reserve-fund shortfalls?
- Why hasn't it sold? Are there any deal-killer items the seller is aware of (foundation, flood, title, zoning, code violations)?
- Is there a deadline driving the sale (1031 exchange, divorce, estate, relocation)? That informs how much negotiation room exists.
- What's the average days-on-market for RENTAL listings here right now (not sales)? A rising rental-DOM trend means longer vacancies and softer asking-rent achievability than the comps imply.
- What's the recent tenant-quality profile in this submarket — average credit score on applications, eviction rate, late-payment / NSF rate, and stable-employment percentage? A property-management company in the area should have these aggregated.
- How much new for-sale + rental construction is in the pipeline within 1–3 miles? Heavy new supply typically softens prices + rents 12–24 months out; constrained supply supports both.
Investment metrics
- 1% rule
- 1.19% ✓
- Cap rate
- 8.22%
- Cash-on-cash
- 6.87%
- DSCR
- 1.31
- GRM
- 7.0
CMA / ARV
- ARV (median comp)
- $400,076
- List price
- $394,800
- Delta
- -1.32%
- Verdict
- FAIR
- Comps
- 20 within 1.0 mi
Show comp detail 3 sales within ~0.75 mi
| Address | Dist | Beds/Ba | Sqft | Sold | Price | $/sf | Match |
|---|---|---|---|---|---|---|---|
| 2210 Ironwood Pass Dr | 0.29mi | 4/2.0 (+1) | 1,790 (+8%) | 9mo | $335,000 | $187 | 60 |
| 1807 Meadow Trl | 0.72mi | 3/2.0 | 1,752 (+6%) | 23mo | $375,000 | $214 | 38 |
| 8731 Arbor Trail Dr | 0.71mi | 3/2.0 | 1,826 (+10%) | 16mo | $320,000 | $175 | 36 |
Match score weights: distance 35% · size 25% · config 20% · recency 20%. Top-matched comps best support the ARV.
Projected returns pro-forma
-1.67% appreciation · 0.0% rent growth · sell at horizon
- IRR
- -3.3%
- Equity multiple
- 0.87×
- Total profit
- $-14,594
- Equity at exit
- $82,801
- IRR
- 0.9%
- Equity multiple
- 1.07×
- Total profit
- $7,704
- Equity at exit
- $76,694
Cash invested: $110,544 (down + closing). Projections, not guarantees.
Landlord ↔ Tenant lean methodology
- Overall (STATE)
- 87 Strongly Landlord-Friendly
- State Texas
- 87 Strongly Landlord-Friendly · R+5
- County
- — inherits STATE
- City
- — inherits STATE
ZIP-level market 77459
- Home prices YoY
- -0.8%
- Rents YoY
- -0.1%
- Active inventory
- 1215
- Price-to-rent
- 7.0×
Monthly cashflow live
- Estimated rent
- $4,687 medium interval (Pro) →
- Mortgage (P&I)
- −$2,070
- Tax from tax record
- −$732 /mo · $8,787/yr
- Insurance
- −$164
- HOA
- −$102
- Vacancy / Maint / Mgmt
- −$984
- Net cashflow
- $633
Break-even live
UW: 25.0% down · 7.5% · 30yr · 1.5% tax · 5.0% vac · 8.0% maint · 8.0% mgmt
Financing live
Cash to close
- Down payment
- $98,700
- Closing costs
- $11,844
- Reserves months
- —
- Total cash needed
- —
Loan-product check · same deal, 3 products live
Conventional
25% down · 7.5% · 30yr
- Down + closing
- —
- Monthly P&I
- —
- Monthly cashflow
- —
- DSCR
- —
- Eligible?
- —
Personal DTI + credit; lowest rate.
DSCR
20% down · 8.5% · 30yr
- Down + closing
- —
- Monthly P&I
- —
- Monthly cashflow
- —
- DSCR
- —
- Eligible?
- —
No personal income docs; deal must DSCR.
Hard money
10% down · 12.0% · 12mo
- Down + closing
- —
- Monthly P&I
- —
- Monthly cashflow
- —
- DSCR
- —
- Eligible?
- —
Short-term bridge; refi at stabilization.
Rent comps 3 comps
| Address | Beds | Baths | Sqft | Rent | $/sqft | DOM | Units | Dist |
|---|---|---|---|---|---|---|---|---|
| 2142 Ironwood Pass Dr Missouri City, TX | 4.0 | 3.0 | 2140 | $6,000 | $2.80 | 1d | 1 | 0.32mi |
| 8719 Fox Trail Dr Missouri City, TX | 4.0 | 3.5 | 2143 | $6,000 | $2.80 | 22d | 1 | 0.57mi |
| 1714 Forest Mist Dr Missouri City, TX | 3.0 | 3.0 | 1979 | $3,000 | $1.52 | 43d | 1 | 1.33mi |
HOA detail
- Monthly dues
- $102 · $1,224/yr
Listing history 16 events
-
2026-06-18days on market $394,800 Active 246 DOM
-
2026-06-17days on market $394,800 Active 245 DOM
-
2026-06-16days on market $394,800 Active 244 DOM
-
2026-06-15days on market $394,800 Active 243 DOM
-
2026-06-13days on market $394,800 Active 241 DOM
-
2026-06-09days on market $394,800 Active 237 DOM
-
2026-06-07days on market $394,800 Active 235 DOM
-
2026-06-04days on market $394,800 Active 232 DOM
-
2026-06-03days on market $394,800 Active 231 DOM
-
2026-06-02days on market $394,800 Active 230 DOM
-
2026-06-01days on market $394,800 Active 229 DOM
-
2026-05-31days on market $394,800 Active 228 DOM
-
2025-10-15$394,800 Active 934-char remark
Show marketing remark (934 chars)
Discover this stunning single-story home that offers privacy and elegance, featuring a charming brick wall at the backyard, providing a peaceful backdrop without back neighbors. The residence boasts three spacious bedrooms and two modern bathrooms, designed with comfort and functionality in mind. The front elevation is truly picturesque, showcasing attractive architectural details that enhance curb appeal and create a welcoming first impression. Inside, you'll find a thoughtfully planned layout that maximizes space and flow, making the home feel much larger than its actual size. Large windows and high ceilings invite abundant natural light, further amplifying the sense of openness. Step outside to a versatile outdoor space, perfect for summer barbecues, outdoor dining, or simply relaxing in your own tranquil oasis. This home combines beauty, practicality, and a prime location, making it an exceptional place to call home.
-
2020-09-25soldstatus Sold 233-char remark
Show marketing remark (233 chars)
Beautiful one story home with no back neighbors, just a brick wall. 3 bedrooms and 2 bathrooms with the most beautiful front elevation! Great layout that feels much bigger than it is. Great open plan with room to entertain and enjoy!
-
2020-08-25status Pending 233-char remark
Show marketing remark (233 chars)
Beautiful one story home with no back neighbors, just a brick wall. 3 bedrooms and 2 bathrooms with the most beautiful front elevation! Great layout that feels much bigger than it is. Great open plan with room to entertain and enjoy!
-
2020-06-19$295,990 Active 233-char remark
Show marketing remark (233 chars)
Beautiful one story home with no back neighbors, just a brick wall. 3 bedrooms and 2 bathrooms with the most beautiful front elevation! Great layout that feels much bigger than it is. Great open plan with room to entertain and enjoy!
ⓘ Source: listings_history table (triggers on properties + properties_extension) + one-shot
backfill from property_details.listing_events for pre-trigger history.
Tax reassessment forecast TX · Resets to sale price
- Current annual tax
- $8,787 · $732/mo
- Projected year-2 tax
- $8,787 · $732/mo
- Expected delta
- $0/yr ($0/mo · 0.0%)
ⓘ Screening estimate from a state-policy table — verify with the county assessor before closing.
Climate risk First Street
- Flood 4/10 Moderate FEMA zone X · 24% chance over 30 yrs
- Wildfire 4/10 Moderate
- Heat 9/10 Extreme 7 d/yr ≥111°F today · 23 d/yr by 30 yrs out
- Wind 9/10 Extreme 99% chance of damaging wind over 30 yrs
- Air quality 2/10 Low 2 unhealthy d/yr today · 2 by 30 yrs out
Nearby sold comps map
Loading sold comps map…
Walkable amenities ~0.75 mi
Loading nearby amenities…
Taxation est. · year 1
- Rental income
- $56,240
- − Mortgage interest
- −$22,115
- − Property taxes
- −$8,787
- − Insurance
- −$1,974
- − Repairs & maintenance
- −$4,499
- − Management
- −$4,499
- − HOA
- −$1,224
- − Depreciation
- −$11,485
- Taxable income
- $1,656
- Est. tax owed @ 24.0%
- −$398
- After-tax cash flow
- $7,202/yr
For passive investors: Depreciation is non-cash, so a rental often shows a tax loss while cash-flowing — sheltering income. Rental losses are passive: they offset passive income freely, and up to $25,000/yr can offset ordinary (W-2) income if you actively participate and your MAGI is under $100k (phasing out to $0 by $150k); unused losses carry forward. On sale, claimed depreciation is recaptured at up to 25%, and gains may owe capital-gains tax (a 1031 exchange can defer both). Figures are a year-1 estimate at your 24.0% rate — not tax advice; consult a CPA.
Schools (NCES district)
- District
- Fort Bend ISD
- NCES district ID
- 4819650
- Math proficiency
- 44% ▼ -15.00%
- Reading proficiency
- 53% ▼ -4.00%
- Median HH income
- $82,360
- Composite
- 44.61/100
- National rank
- #2779
- State rank
- #140 of 826 in TX
Livability — Sienna
No livability data for this city. (Only ~50 U.S. cities are tracked.)
Census & demographics
- Census place
- Sienna, TX
- County
- Fort Bend County · 836,777 people
- Metro
- Houston-The Woodlands-Sugar Land, TX
- Population (ZIP)
- 84,221
- Household income
- $129,151
- Rent vs Own
- Severe rent burden
- 1004.0
Population outlook (Fort Bend County) Hauer SSP2
- Today (2025)
- 1,004,526 people
- By 2030
- 1,153,104 · +14.8%
- By 2040
- 1,453,718 · +44.7%
- By 2050
- 1,753,781 · +74.6%
- By 2075
- 2,455,772 · +144.5%
- By 2100
- 2,930,528 · +191.7%
Race, ethnicity, and origin ACS 2023
- Neighborhood character
- Highly diverse neighborhood (Simpson 0.75)
- Race & ethnicity
- White 34% Black 26% Asian 22% Hispanic / Latino 13% Two or more races 10%
- Hispanic origin (detail)
- Mexican 7%
- Common ancestry
- Lithuanian 2% Slovak 1% Italian 1%
- Foreign-born
- 21% · Canada, China, Vietnam
- Languages at home
- 73% English-only · Other Asian/Pacific 8% Spanish 7% Other Indo-European 5%
Political lean MEDSL · Fort Bend
- 2024 margin
- Toss-up / Even · D 49.5% · R 47.9% · Other 2.6%
- 2008→2024 swing
- +4.0pp toward D · 2008: -2.4pp · 2024: 1.6pp
- All cycles
- 2024: D+1.6 2020: D+10.6 2016: D+6.6 2012: R+6.8 2008: R+2.4
Not yet ingested
- Civics
- —
Market trends
- HPI YoY
- ▼ -1.67%
- Current HPI
- 212.3573
- Rent YoY
- ▼ -0.15%
- Metro
- Houston-The Woodlands-Sugar Land, TX
- State GDP YoY
- ▲ 3.95%
- F500 in state
- 110
Industry mix (Fortune 500 HQ in TX)
| Industry | F500 HQs | Revenue |
|---|---|---|
| Energy | 16 | $1,198B |
|
||
| Technology | 5 | $198B |
|
||
| Engineering / Construction | 4 | $72B |
|
||
| Energy Services | 3 | $60B |
|
||
| Utilities | 3 | $41B |
|
||
| Healthcare | 2 | $330B |
|
||
Price history
+33.4% since first listed4 events — show timeline
- 2025-10-15 Listed $394,800 HARMLS
- 2020-09-25 Sold (MLS) — HARMLS
- 2020-08-25 Pending — HARMLS
- 2020-06-19 Listed $295,990 HARMLS
Property tax history
+46.8%/yrLatest (2025): $8,787 · +8.2% YoY. Source: county tax records.
Cash-flow waterfall
monthlySold comps — $/sqft
last 12 mo · ≤1 miLoading sold comps…