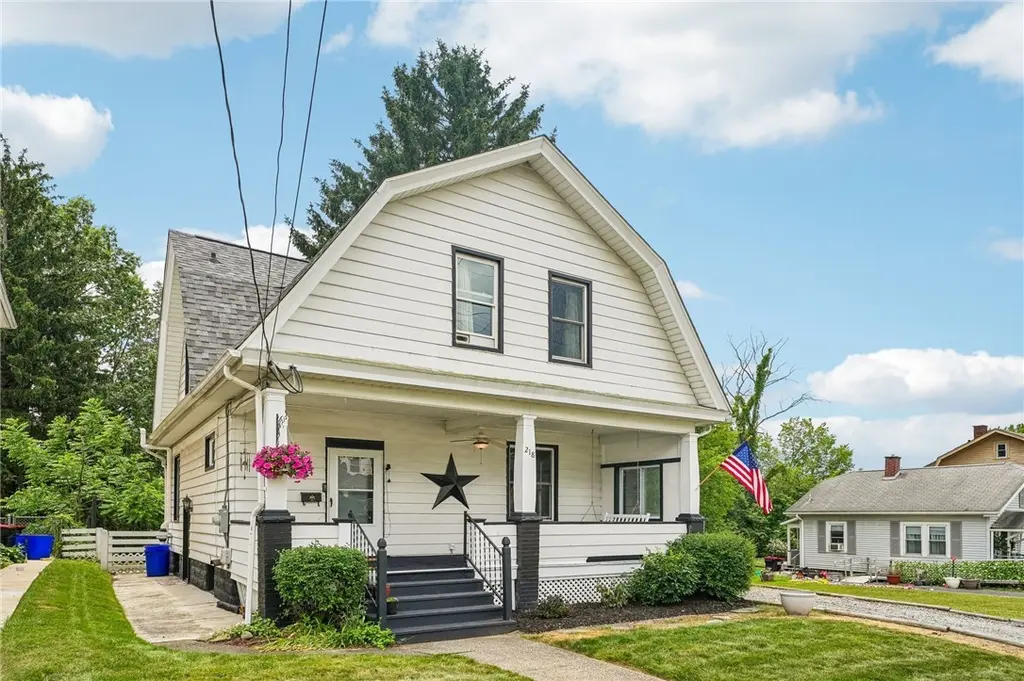
218 E Hillcrest Ave · New Castle, PA
Flood risk 1/10 · Minimal
- FEMA flood zone
- X (unshaded)
- Chance of flooding over 30 yrs
- 0.0%
- Est. flood insurance / yr
- $473 – $860
Fire risk 1/10 · Minimal
- Est. fire insurance / yr
- $511 – $949
Heat risk 3/10 · Minor
- Hot days now (above 96°F)
- 7 days/yr
- Hot days in 30 yrs
- 17 days/yr
Wind risk 1/10 · Minimal
- Chance of severe wind over 30 yrs
- —
Air-quality risk 2/10 · Minimal
- Unhealthy air days now
- 1 days/yr
- Unhealthy air days in 30 yrs
- 3 days/yr
Risk factors via First Street. Map © Google.
Why this score? — see what drove the C+ grade
The composite is a weighted blend of 9 inputs, each scored 0–100. Each bar is that input's sub-score; the figure is the points it added to the 100-point composite (weight × sub-score).
- Cash flow +25.0/30.0
- ARV discount +15.0/15.0
- DSCR +8.1/10.0
- 1% rule +6.6/10.0
- Livability +4.1/5.0
- Rent growth +2.5/5.0
- Condition / age +2.5/5.0
- Schools +1.1/10.0
- Appreciation +0.0/10.0
$138,900
🖨 Deal sheet 📄 Offer letter ✓ Due diligence
Listing remarks MLS
This well-appointed North Hill home, boasts 3 bedrooms and is conveniently located near shopping, schools, & restaurants. Built in the early 1900's, the home boasts deep rich oak trim throughout, a gas fireplace in the living room, hardwood flooring, and built-in cupboards in the dining area and kitchen. The ceiling height is approx. 9' and there are 5 ceiling fans throughout. The grand entry measures 13' x 11' and a solid oak staircase leads to the upper level bedrooms. The home is over 1500 SF. A Rheem high efficiency - gas forced air furnace heats the home. Owner is also furnishing two window air conditioners for summer cooling. An upgraded 200 amp electrical service provides ample residential power. The home has Pella Replacement windows throughout . All kitchen appliances go, as does a freezer chest, dehumidifier & washer/dryer in the basement. Front porch measures 7' x 23' and a large 14' x 18' converted garage makes for perfect storage and garden shed.
Key facts
- Covered front porch
- Gambrel roof
- Original trim
Tags
Property features AI
Exterior
- Parking: Off-street parking for 2 vehicles
- Utilities: Public water; Public sewer
- Home design: Two-story resale home
- Construction: Asphalt roof
- Exterior features: Aluminum siding; Lot dimensions approximately 40 x 127
Interior
- Kitchen: Kitchen on main level (approx. 13x12); Dishwasher; Microwave; Refrigerator; Stove
- Bedrooms: Upper-level bedrooms: 3 total (examples include 11x10 and 15x10)
- Flooring: Hardwood; Vinyl; Carpet
- Bathrooms: One full bathroom
- Heating & cooling: Gas forced-air heating; Wall/window cooling units
- Interior features: Pantry; Multi-pane windows with screens; Full basement with interior entry; Gas fireplace (one)
- Laundry & utility: Washer and Dryer; Laundry room in basement
Neighborhood map
What this means for you Summary
Snapshot
- This is a 3-bed/1.0-bath single-family listed at $139k.
Deal economics
- At list price, monthly cash flow is $302 ($4k/yr) — positive.
- The deal already cash-flows at list — no discount required.
- Meets the 1% rule at list price ($2k rent vs $139k).
Location & tenants
- Location reads 82/100 on livability (#137 in PA, #1,120 nationally) — a professional / high-income tenant draw. Strengths: crime A+, commute A+, cost of living A+; Watch: amenities F, employment F.
- New Castle Area SD (town): math 9% / reading 19% proficiency, ranked #519 of 539 in PA (top 96%) — low school quality limits family demand, transient renter base, plan for 1-2y turnover; 66% free/reduced lunch — lower-income household profile, screen leases tightly.
- Market conditions: 105 active listings in the ZIP; 51 units permitted in Lawrence County in 2024 (0 in 5+ unit buildings).
Forward outlook
- Local home prices are declining (-3.0%/yr); year-one equity from $960 of loan paydown is wiped out by about $4k of value loss. Plan a longer hold.
- Lawrence County population projected at -25% by 2050 — secular population decline; favor cash flow + early exit over multi-decade hold.
Negotiation context
- Only 6 days on market — expect competitive offers; lowballing is unlikely to land.
- 3 sale attempts since 10y ago with the ask held roughly flat each time — persistent listings suggest the price (not the market) is what's stuck; bring a comps-based counter.
- Current owner paid $56k; list at $139k implies a 146% gain — meaningful room to come down on a strong offer.
Risks & watch-outs
- Watch-outs: built in 1910 — expect roof / HVAC / electrical / plumbing capex.
Questions for the listing agent
- Built in 1910 — when were the roof, HVAC, electrical panel, plumbing, and water heater last replaced?
- Is there a deadline driving the sale (1031 exchange, divorce, estate, relocation)? That informs how much negotiation room exists.
- What's the average days-on-market for RENTAL listings here right now (not sales)? A rising rental-DOM trend means longer vacancies and softer asking-rent achievability than the comps imply.
- What's the recent tenant-quality profile in this submarket — average credit score on applications, eviction rate, late-payment / NSF rate, and stable-employment percentage? A property-management company in the area should have these aggregated.
- How much new for-sale + rental construction is in the pipeline within 1–3 miles? Heavy new supply typically softens prices + rents 12–24 months out; constrained supply supports both.
Investment metrics
- 1% rule
- 1.16% ✓
- Cap rate
- 8.90%
- Cash-on-cash
- 9.31%
- DSCR
- 1.41
- GRM
- 7.2
CMA / ARV
- ARV (on-the-fly)
- $173,568
- Comps found
- 12
Show comp detail 12 sales within ~0.75 mi
| Address | Dist | Beds/Ba | Sqft | Sold | Price | $/sf | Match |
|---|---|---|---|---|---|---|---|
| 116 E Euclid Ave | 0.34mi | 3/1.0 | 1,481 (-4%) | 1mo | $167,500 | $113 | 77 |
| 232 E Meyer Ave | 0.23mi | 3/2.0 | 1,598 (+4%) | 2mo | $205,000 | $128 | 77 |
| 313 Norwood Ave | 0.17mi | 3/1.0 | 1,344 (-12%) | 2mo | $147,000 | $109 | 69 |
| 106 W Elizabeth St | 0.45mi | 3/1.0 | 1,440 (-6%) | 1mo | $235,000 | $163 | 68 |
| 212 E Garfield Ave | 0.45mi | 3/1.5 | 1,450 (-6%) | 0mo | $103,200 | $71 | 67 |
| 2303 Delaware Ave | 0.44mi | 4/2.0 (+1) | 1,504 (-2%) | 2mo | $216,000 | $144 | 66 |
| 407 E Fairfield Ave | 0.52mi | 3/1.5 | 1,447 (-6%) | 3mo | $180,000 | $124 | 61 |
| 142 E Garfield Ave | 0.45mi | 3/1.0 | 1,359 (-12%) | 3mo | $150,000 | $110 | 57 |
| 414 E Edgewood Ave | 0.40mi | 4/1.5 (+1) | 1,706 (+11%) | 0mo | $125,000 | $73 | 55 |
| 212 E Meyer Ave | 0.22mi | 2/2.5 (-1) | 1,316 (-14%) | 0mo | $138,000 | $105 | 55 |
| 210 E Garfield Ave | 0.45mi | 4/1.5 (+1) | 1,722 (+12%) | 1mo | $195,000 | $113 | 51 |
| 216 W Northview Ave | 0.62mi | 3/2.0 | 1,760 (+15%) | 0mo | $239,000 | $136 | 43 |
Match score weights: distance 35% · size 25% · config 20% · recency 20%. Top-matched comps best support the ARV.
Projected returns pro-forma
-3.0% appreciation · 3.0% rent growth · sell at horizon
- IRR
- -2.2%
- Equity multiple
- 0.92×
- Total profit
- $-3,264
- Equity at exit
- $20,710
- IRR
- 7.5%
- Equity multiple
- 1.57×
- Total profit
- $22,028
- Equity at exit
- $12,010
Cash invested: $38,892 (down + closing). Projections, not guarantees.
Landlord ↔ Tenant lean methodology
- Overall (STATE)
- 62 Landlord-Friendly
- State Pennsylvania
- 62 Landlord-Friendly · EVEN
- County
- — inherits STATE
- City
- — inherits STATE
ZIP-level market 16105
- Home prices YoY
- -26.5%
- Active inventory
- 105
- Price-to-rent
- 7.2×
Monthly cashflow live
- Estimated rent
- $1,614 medium interval (Pro) →
- Mortgage (P&I)
- −$728
- Tax from tax record
- −$187 /mo · $2,248/yr
- Insurance
- −$58
- HOA
- −$0
- Vacancy / Maint / Mgmt
- −$339
- Net cashflow
- $302
Break-even live
UW: 25.0% down · 7.5% · 30yr · 1.5% tax · 5.0% vac · 8.0% maint · 8.0% mgmt
Financing live
Cash to close
- Down payment
- $34,725
- Closing costs
- $4,167
- Reserves months
- —
- Total cash needed
- —
Loan-product check · same deal, 3 products live
Conventional
25% down · 7.5% · 30yr
- Down + closing
- —
- Monthly P&I
- —
- Monthly cashflow
- —
- DSCR
- —
- Eligible?
- —
Personal DTI + credit; lowest rate.
DSCR
20% down · 8.5% · 30yr
- Down + closing
- —
- Monthly P&I
- —
- Monthly cashflow
- —
- DSCR
- —
- Eligible?
- —
No personal income docs; deal must DSCR.
Hard money
10% down · 12.0% · 12mo
- Down + closing
- —
- Monthly P&I
- —
- Monthly cashflow
- —
- DSCR
- —
- Eligible?
- —
Short-term bridge; refi at stabilization.
Listing history 7 events
-
2026-06-19days on market $138,900 Active 6 DOM
-
2026-06-18days on market $138,900 Active 5 DOM
-
2026-06-17days on market $138,900 Active 4 DOM
-
2026-06-16days on market $138,900 Active 3 DOM
-
2026-06-15days on market $138,900 Active 2 DOM
-
2026-06-14remarks 699-char remark
-
2026-06-14$138,900 Active 1 DOM
ⓘ Source: listings_history table (triggers on properties + properties_extension) + one-shot
backfill from property_details.listing_events for pre-trigger history.
Tax reassessment forecast PA · Partial reset (capped growth)
- Current annual tax
- $2,248 · $187/mo
- Projected year-2 tax
- $2,248 · $187/mo
- Expected delta
- $0/yr ($0/mo · 0.0%)
ⓘ Screening estimate from a state-policy table — verify with the county assessor before closing.
Climate risk First Street
- Flood 1/10 Low FEMA zone X (unshaded) · 0% chance over 30 yrs
- Wildfire 1/10 Low
- Heat 3/10 Moderate 7 d/yr ≥96°F today · 17 d/yr by 30 yrs out
- Wind 1/10 Low
- Air quality 2/10 Low 1 unhealthy d/yr today · 3 by 30 yrs out
Nearby sold comps map
Loading sold comps map…
Walkable amenities ~0.75 mi
Loading nearby amenities…
Taxation est. · year 1
- Rental income
- $19,371
- − Mortgage interest
- −$7,781
- − Property taxes
- −$2,248
- − Insurance
- −$694
- − Repairs & maintenance
- −$1,550
- − Management
- −$1,550
- − Depreciation
- −$4,041
- Taxable income
- $1,508
- Est. tax owed @ 24.0%
- −$362
- After-tax cash flow
- $3,258/yr
For passive investors: Depreciation is non-cash, so a rental often shows a tax loss while cash-flowing — sheltering income. Rental losses are passive: they offset passive income freely, and up to $25,000/yr can offset ordinary (W-2) income if you actively participate and your MAGI is under $100k (phasing out to $0 by $150k); unused losses carry forward. On sale, claimed depreciation is recaptured at up to 25%, and gains may owe capital-gains tax (a 1031 exchange can defer both). Figures are a year-1 estimate at your 24.0% rate — not tax advice; consult a CPA.
Schools (NCES district)
- District
- New Castle Area SD
- NCES district ID
- 4216620
- Math proficiency
- 9% ▼ -13.00%
- Reading proficiency
- 19% ▼ -23.00%
- Median HH income
- $30,967
- Composite
- 11.08/100
- National rank
- #9736
- State rank
- #519 of 539 in PA
Livability — New Castle
- Score
- 82/100
- State rank
- #137
- US rank
- #1120
Category grades
Schools grade is shown separately in the Schools card above.
Census & demographics
- Census place
- New Castle, PA
- City population
- 30,767
- Population (ZIP)
- 15,195
Population outlook (Lawrence County) Hauer SSP2
- Today (2025)
- 81,781 people
- By 2030
- 77,978 · -4.7%
- By 2040
- 69,522 · -15.0%
- By 2050
- 61,344 · -25.0%
- By 2075
- 45,027 · -44.9%
- By 2100
- 31,305 · -61.7%
Race, ethnicity, and origin ACS 2023
- Neighborhood character
- Predominantly White (93%)
- Race & ethnicity
- White 93% Black 3% Hispanic / Latino 2% Two or more races 1%
- Common ancestry
- Romanian 9% Serbian 3% Lithuanian 3%
- Foreign-born
- 2% · Canada
- Languages at home
- 96% English-only · Other Indo-European 1% Spanish 1% German/W. Germanic 1%
Political lean MEDSL · Lawrence
- 2024 margin
- Solid R (+33.8) · D 32.8% · R 66.5%
- 2008→2024 swing
- -28.7pp toward R · 2008: -5.1pp · 2024: -33.8pp
- All cycles
- 2024: R+33.8 2020: R+29.6 2016: R+28.1 2012: R+9.0 2008: R+5.1
Not yet ingested
- Civics
- —
Market trends
- HPI YoY
- ▼ -62.26%
- Current HPI
- 173.0332
- Rent YoY
- —
- Metro
- —
- State GDP YoY
- ▲ 1.68%
- F500 in state
- 34
Industry mix (Fortune 500 HQ in PA)
| Industry | F500 HQs | Revenue |
|---|---|---|
| Healthcare | 2 | $309B |
|
||
| Insurance | 2 | $27B |
|
||
| Telecommunications / Media | 1 | $124B |
|
||
| Industrial Distribution | 1 | $22B |
|
||
| Financial Services | 1 | $20B |
|
||
| Chemicals / Materials | 1 | $18B |
|
||
Price history
+296.9% since first listed17 events — show timeline
- 2026-06-12 Listed $138,900 West Penn MLS
- 2020-06-24 Sold (Public Records) $56,500 Public Records
- 2020-06-22 Sold (MLS) $56,500 West Penn MLS
- 2020-06-11 Pending — West Penn MLS
- 2020-05-31 Contingent — West Penn MLS
- 2020-04-30 Listed $65,000 West Penn MLS
- 2017-07-17 Sold (Public Records) $64,500 Public Records
- 2017-07-17 Sold (Public Records) $64,500 Public Records
- 2017-07-17 Sold (MLS) $64,500 West Penn MLS
- 2017-07-11 Pending — West Penn MLS
- 2017-07-03 Contingent — West Penn MLS
- 2017-05-05 Price Changed $68,500 West Penn MLS
- 2016-09-12 Price Changed $69,900 West Penn MLS
- 2016-09-02 Price Changed $72,900 West Penn MLS
- 2016-07-09 Listed $74,900 West Penn MLS
- 2003-12-19 Sold (Public Records) $68,000 Public Records
- 2003-10-15 Sold (Public Records) $35,000 Public Records
Property tax history
+1.3%/yrLatest (2026): $2,248 · +2.0% YoY. Source: county tax records.
Cash-flow waterfall
monthlySold comps — $/sqft
last 12 mo · ≤1 miLoading sold comps…