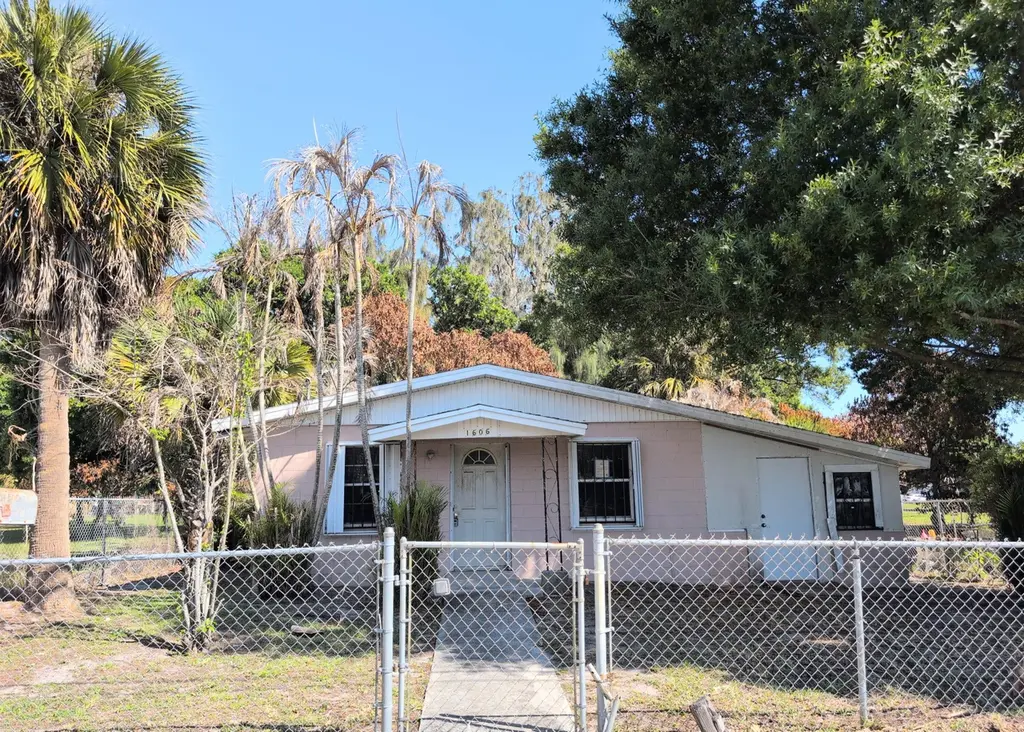
1606 Avenue H · Fort Pierce, FL
Flood risk 1/10 · Minimal
- FEMA flood zone
- X (unshaded)
- Chance of flooding over 30 yrs
- 0.0%
- Est. flood insurance / yr
- $507 – $1,088
Fire risk 1/10 · Minimal
- Est. fire insurance / yr
- $947 – $1,759
Heat risk 10/10 · Severe
- Hot days now (above 106°F)
- 7 days/yr
- Hot days in 30 yrs
- 26 days/yr
Wind risk 10/10 · Severe
- Chance of severe wind over 30 yrs
- 99.0%
Air-quality risk 2/10 · Minimal
- Unhealthy air days now
- 2 days/yr
- Unhealthy air days in 30 yrs
- 2 days/yr
Risk factors via First Street. Map © Google.
Why this score? — see what drove the B+ grade
The composite is a weighted blend of 9 inputs, each scored 0–100. Each bar is that input's sub-score; the figure is the points it added to the 100-point composite (weight × sub-score).
- Cash flow +29.2/30.0
- ARV discount +15.0/15.0
- DSCR +10.0/10.0
- 1% rule +8.0/10.0
- Rent growth +4.0/5.0
- Livability +3.8/5.0
- Schools +3.7/10.0
- Condition / age +2.5/5.0
- Appreciation +0.0/10.0
$129,900
🖨 Deal sheet 📄 Offer letter ✓ Due diligence
Listing remarks
Bring your vision to this high-potential investment opportunity at 1606 Avenue H. While the current 2-bedroom home requires a full renovation, the oversized 6,960 sq. ft. lot offers rare depth and space for expansion or a complete rebuild. The solid concrete block construction provides a sturdy foundation for your next project. Ideally located in the heart of Fort Pierce, you are less than 10 minutes from the vibrant Downtown waterfront, city marina, and pristine South Causeway beaches. Nature lovers will appreciate the quick access to Savannas Recreation Area and the Fort Pierce Inlet State Park. With no HOA restrictions, this property is perfect for an investor looking to capitalize on th
Key facts
- No hoa restrictions
- Oversized lot
- 6,960 sq ft lot
Tags
Property features AI
Finance
- Other: Pets allowed with no restrictions
- Financial info: No investor or income/expense details listed
- HOA & community: No HOA information listed
Exterior
- Parking: No covered parking (no carport); Parking total listed as 0
- Security: No security features listed
- Utilities: Public water; Public sewer; No additional utilities listed
- Home design: Single family residence; One story; Faces south; Resale property
- Construction: Stucco construction; Built as single-story; Building area approximately 1,012 total; living area approximately 914
- Exterior features: Not waterfront; Shingle roof
Interior
- Kitchen: Electric water heater
- Bedrooms: One bedroom on the main level
- Flooring: Other flooring
- Bathrooms: One full bathroom
- Heating & cooling: Electric heating; Wall/window cooling unit(s)
- Interior features: No notable interior features listed; Unfurnished
- Laundry & utility: No laundry/utility details listed
Neighborhood map
What this means for you Summary
Snapshot
- This is a 2-bed/1.0-bath single-family listed at $130k.
Deal economics
- At list price, monthly cash flow is $454 ($5k/yr) — positive.
- The deal already cash-flows at list — no discount required.
- Meets the 1% rule at list price ($2k rent vs $130k).
- Recommended offer: $122k (6.0% below list) — sets the bar for market timing.
- Cap rate 10.5% vs local median 3.7% in Fort Pierce — top-decile yield for the area; either an underpriced asset or a hidden risk that comps aren't pricing in. Stress-test before assuming the spread holds.
Location & tenants
- Location reads 76/100 on livability (#226 in FL, #3,360 nationally) — a middle-class / working-renter tenant base. Strengths: commute A+, cost of living A+, housing A+; Watch: crime D+, schools D, amenities F.
- St. Lucie (urban): math 40% / reading 48% proficiency, ranked #51 of 73 in FL (top 70%) — families likely to look elsewhere, expect single-tenant / working-renter base with shorter leases.
- Market conditions: Rents rising fast (+5.9%/yr); 165 active listings in the ZIP; 40 comparable units currently listed for rent nearby; rentals at typical pace (median 24d on market — plan ~3-4 weeks tenant-placement turnaround); lower-income renter base — watch delinquency; 4,868 units permitted in St. Lucie County in 2024 (268 in 5+ unit buildings).
- At $1,692/mo this rent would consume 67% of the median local household income ($30k/yr) (locally 1995% of renters already pay >50% of income on rent) — very limited rent-growth headroom before tenants either downsize or default.
Forward outlook
- Local home prices are declining (-3.0%/yr); year-one equity from $898 of loan paydown is wiped out by about $4k of value loss. Plan a longer hold.
- St. Lucie County population projected at +20% by 2050 — long-run rental-demand tailwind backs the buy-and-hold thesis.
- At projected returns (-3.0% appreciation + 5.9% rent growth), your $36k cash investment doubles in ~7 years — after that, you're playing with house money.
Negotiation context
- It's been on market 75 days — a 6% lower offer ($122k) is reasonable based on typical stale-listing flexibility.
- Current owner paid $8k; list at $130k implies a 1565% gain — meaningful room to come down on a strong offer.
Risks & watch-outs
- Climate carrying-cost: severe wind risk, 99% chance of damaging wind over 30y; extreme-heat days projected 7→26/yr by 2055 (HVAC capex compounding) — expect insurance premiums to compound above CPI over the hold.
Questions for the listing agent
- It's been on market 75 days. Have you received any prior offers? Is the seller open to a 6% concession, seller financing, or rate buy-down credit?
- Built in 1962 — when were the roof, HVAC, electrical panel, plumbing, and water heater last replaced?
- Why hasn't it sold? Are there any deal-killer items the seller is aware of (foundation, flood, title, zoning, code violations)?
- Is there a deadline driving the sale (1031 exchange, divorce, estate, relocation)? That informs how much negotiation room exists.
- Schools are D-rated, which usually means shorter tenancies and higher turnover. Who's the typical renter profile here, and what's been the actual vacancy rate?
- Crime grade is D in this area — have there been break-ins, vandalism, or insurance claims at this property in the last 3 years? What carrier currently insures it and at what premium?
- What's the average days-on-market for RENTAL listings here right now (not sales)? A rising rental-DOM trend means longer vacancies and softer asking-rent achievability than the comps imply.
- What's the recent tenant-quality profile in this submarket — average credit score on applications, eviction rate, late-payment / NSF rate, and stable-employment percentage? A property-management company in the area should have these aggregated.
- How much new for-sale + rental construction is in the pipeline within 1–3 miles? Heavy new supply typically softens prices + rents 12–24 months out; constrained supply supports both.
Investment metrics
- 1% rule
- 1.30% ✓
- Cap rate
- 10.49%
- Cash-on-cash
- 14.97%
- DSCR
- 1.67
- GRM
- 6.4
CMA / ARV
- ARV (on-the-fly)
- $162,692
- Comps found
- 7
Show comp detail 7 sales within ~0.75 mi
| Address | Dist | Beds/Ba | Sqft | Sold | Price | $/sf | Match |
|---|---|---|---|---|---|---|---|
| 709 N 20th St | 0.29mi | 2/2.0 | 864 (-6%) | 2mo | $93,000 | $108 | 72 |
| 1202 Avenue L | 0.40mi | 2/1.0 | 864 (-6%) | 13mo | $153,750 | $178 | 61 |
| 210 N 22nd St | 0.71mi | 3/1.0 (+1) | 912 (-0%) | 2mo | $224,900 | $247 | 60 |
| 805 N 27th St | 0.71mi | 3/1.0 (+1) | 925 (+1%) | 1mo | $165,000 | $178 | 59 |
| 1903 Avenue O | 0.46mi | 3/1.0 (+1) | 816 (-11%) | 12mo | $180,000 | $221 | 46 |
| 1605 N 17th St | 0.45mi | 2/1.0 | 782 (-14%) | 15mo | $174,900 | $224 | 42 |
| 507 N 24th St | 0.59mi | 3/1.0 (+1) | 994 (+9%) | 15mo | $170,000 | $171 | 40 |
Match score weights: distance 35% · size 25% · config 20% · recency 20%. Top-matched comps best support the ARV.
Projected returns pro-forma
-3.0% appreciation · 5.94% rent growth · sell at horizon
- IRR
- 8.8%
- Equity multiple
- 1.36×
- Total profit
- $13,025
- Equity at exit
- $19,369
- IRR
- 20.4%
- Equity multiple
- 2.95×
- Total profit
- $71,093
- Equity at exit
- $11,231
Cash invested: $36,372 (down + closing). Projections, not guarantees.
Landlord ↔ Tenant lean methodology
- Overall (STATE)
- 87 Strongly Landlord-Friendly
- State Florida
- 87 Strongly Landlord-Friendly · R+3
- County
- — inherits STATE
- City
- — inherits STATE
ZIP-level market 34950
- Home prices YoY
- -20.2%
- Rents YoY
- 5.9%
- Active inventory
- 165
- Price-to-rent
- 6.4×
Monthly cashflow live
- Estimated rent
- $1,692 high interval (Pro) →
- Mortgage (P&I)
- −$681
- Tax from tax record
- −$148 /mo · $1,774/yr
- Insurance
- −$54
- HOA
- −$0
- Vacancy / Maint / Mgmt
- −$355
- Net cashflow
- $454
Break-even live
UW: 25.0% down · 7.5% · 30yr · 1.5% tax · 5.0% vac · 8.0% maint · 8.0% mgmt
Financing live
Cash to close
- Down payment
- $32,475
- Closing costs
- $3,897
- Reserves months
- —
- Total cash needed
- —
Loan-product check · same deal, 3 products live
Conventional
25% down · 7.5% · 30yr
- Down + closing
- —
- Monthly P&I
- —
- Monthly cashflow
- —
- DSCR
- —
- Eligible?
- —
Personal DTI + credit; lowest rate.
DSCR
20% down · 8.5% · 30yr
- Down + closing
- —
- Monthly P&I
- —
- Monthly cashflow
- —
- DSCR
- —
- Eligible?
- —
No personal income docs; deal must DSCR.
Hard money
10% down · 12.0% · 12mo
- Down + closing
- —
- Monthly P&I
- —
- Monthly cashflow
- —
- DSCR
- —
- Eligible?
- —
Short-term bridge; refi at stabilization.
Rent comps 40 comps
| Address | Beds | Baths | Sqft | Rent | $/sqft | DOM | Units | Dist |
|---|---|---|---|---|---|---|---|---|
| 1405 Avenue G Apt A Fort Pierce, FL | 3.0 | 2.0 | 1064 | $2,200 | $2.07 | 23d | 1 | 0.21mi |
| 1604 Avenue E Fort Pierce, FL | 2.0 | 1.0 | 713 | $1,350 | $1.89 | 14d | 1 | 0.21mi |
| 1617 Avenue E Fort Pierce, FL | 3.0 | 1.0 | 1100 | $1,800 | $1.64 | 23d | 1 | 0.24mi |
| 907 N 20th St Apt B Fort Pierce, FL | 3.0 | 1.0 | 980 | $1,800 | $1.84 | 23d | 1 | 0.25mi |
| 1225 Avenue K Fort Pierce, FL | 3.0 | 1.0 | 837 | $1,700 | $2.03 | 23d | 1 | 0.32mi |
| 1220 Avenue L Unit A Fort Pierce, FL | 3.0 | 1.0 | 850 | $1,700 | $2.00 | 23d | 1 | 0.34mi |
| 1607 Avenue D Fort Pierce, FL | 3.0 | 2.0 | 1029 | $1,700 | $1.65 | 14d | 1 | 0.36mi |
| 1601 N 17th St Fort Pierce, FL | 2.0 | 1.0 | 996 | $1,650 | $1.66 | 23d | 1 | 0.40mi |
| 434 N 17th St Fort Pierce, FL | 2.0 | 1.0 | 712 | $1,500 | $2.11 | 23d | 1 | 0.40mi |
| 1127 E Avenue Unit A Fort Pierce, FL | 2.0 | 1.0 | 784 | $1,800 | $2.30 | 21d | 1 | 0.45mi |
| 508 Means Ct Unit A Fort Pierce, FL | 1.0 | 1.0 | 826 | $775 | $0.94 | 23d | 1 | 0.45mi |
| 508 Means Ct Fort Pierce, FL | 3.0 | 3.0 | 826 | $1,950 | $2.36 | 14d | 1 | 0.45mi |
| 529 N 11th St Fort Pierce, FL | 2.0 | 2.0 | 634 | $1,200 | $1.89 | 21d | 1 | 0.50mi |
| 2202 N AVE Unit A Fort Pierce, FL | 2.0 | 1.0 | 585 | $1,500 | $2.56 | 23d | 1 | 0.51mi |
| 1408 N 23rd St Fort Pierce, FL | 3.0 | 1.0 | 1110 | $1,900 | $1.71 | 14d | 1 | 0.51mi |
| 1710 N 21st St Fort Pierce, FL | 3.0 | 1.0 | 968 | $2,100 | $2.17 | 14d | 1 | 0.58mi |
| 701 N 9th St Unit B Fort Pierce, FL | 2.0 | 2.0 | 740 | $1,395 | $1.89 | 23d | 1 | 0.59mi |
| 321 N 11th St Unit C Fort Pierce, FL | 1.0 | 1.0 | 650 | $950 | $1.46 | 23d | 1 | 0.63mi |
| 136 N 15th St Unit C Fort Pierce, FL | 2.0 | 1.0 | 688 | $1,375 | $2.00 | 23d | 1 | 0.66mi |
| 1610 N 25th St Unit 1 Fort Pierce, FL | 2.0 | 1.0 | 740 | $1,600 | $2.16 | 14d | 1 | 0.68mi |
| 1610 N 25th St Unit 10 Fort Pierce, FL | 2.0 | 1.0 | 740 | $1,600 | $2.16 | 23d | 1 | 0.68mi |
| 1610 N 25th St Unit 13 Fort Pierce, FL | 2.0 | 1.0 | 740 | $1,550 | $2.09 | 23d | 1 | 0.68mi |
| 205 N 22nd St Fort Pierce, FL | 2.0 | 1.0 | 1050 | $1,500 | $1.43 | 23d | 1 | 0.75mi |
| 2804 Avenue J Fort Pierce, FL | 3.0 | 1.0 | 816 | $2,000 | $2.45 | 14d | 1 | 0.76mi |
| 505 N 27th St Fort Pierce, FL | 3.0 | 1.0 | 879 | $2,660 | $3.03 | 23d | 1 | 0.77mi |
| 1310 Atlantic Ave Unit B Fort Pierce, FL | 1.0 | 1.0 | 700 | $1,550 | $2.21 | 14d | 1 | 0.82mi |
| 1310 Atlantic Ave Unit B Fort Pierce, FL | 1.0 | 1.0 | 700 | $1,620 | $2.31 | 23d | 1 | 0.82mi |
| 312 N 27th St Fort Pierce, FL | 2.0 | 1.0 | 868 | $1,600 | $1.84 | 23d | 1 | 0.86mi |
| 2017 N 3rd St Fort Pierce, FL | 1.0 | 1.0 | 600 | $1,650 | $2.75 | 23d | 1 | 0.92mi |
| 1406 Citrus Ave Fort Pierce, FL | 2.0 | 1.0 | 930 | $1,600 | $1.72 | 14d | 1 | 0.92mi |
| 2908 Dunbar St Fort Pierce, FL | 2.0 | 1.0 | 942 | $1,300 | $1.38 | 21d | 1 | 0.92mi |
| 204 N 28th St Fort Pierce, FL | 3.0 | 2.0 | 1000 | $1,550 | $1.55 | 23d | 1 | 0.97mi |
| 804 Orange Ave Unit B Fort Pierce, FL | 2.0 | 1.0 | 700 | $1,350 | $1.93 | 14d | 1 | 0.97mi |
| 804 Orange Ave Unit B Fort Pierce, FL | 2.0 | 1.0 | 700 | $1,450 | $2.07 | 23d | 1 | 0.97mi |
| 1002 Boston Ave Fort Pierce, FL | 2.0 | 1.0 | 809 | $2,000 | $2.47 | 23d | 1 | 0.97mi |
| 127 S 10th St Fort Pierce, FL | 2.0 | 1.0 | 809 | $1,800 | $2.22 | 23d | 1 | 0.97mi |
| 3002 Avenue Q Fort Pierce, FL | 2.0 | 1.0 | 864 | $1,900 | $2.20 | 23d | 1 | 1.03mi |
| 1910 Juanita Ave Fort Pierce, FL | 3.0 | 2.0 | 1100 | $2,000 | $1.82 | 14d | 1 | 1.07mi |
| 510 Texas Ct Fort Pierce, FL | 2.0 | 1.0 | 750 | $1,400 | $1.87 | 23d | 1 | 1.10mi |
| 3101 Avenue T Fort Pierce, FL | 2.0 | 2.0 | 1064 | $1,980 | $1.86 | 23d | 1 | 1.16mi |
Listing history 18 events
-
2026-06-18days on market $129,900 Active 75 DOM
-
2026-06-17days on market $129,900 Active 74 DOM
-
2026-06-16days on market $129,900 Active 73 DOM
-
2026-06-15days on market $129,900 Active 72 DOM
-
2026-06-14days on market $129,900 Active 70 DOM
-
2026-06-13days on market $129,900 Active 69 DOM
-
2026-06-10days on market $129,900 Active 67 DOM
-
2026-06-09days on market $129,900 Active 66 DOM
-
2026-06-08days on market $129,900 Active 65 DOM
-
2026-06-07days on market $129,900 Active 64 DOM
-
2026-06-05days on market $129,900 Active 61 DOM
-
2026-06-03days on market $129,900 Active 60 DOM
-
2026-06-02days on market $129,900 Active 59 DOM
-
2026-06-01days on market $129,900 Active 58 DOM
-
2026-05-31days on market $129,900 Active 57 DOM
-
2026-05-30days on market $129,900 Active 56 DOM
-
2026-04-02$129,900 Active
-
1977-06-01soldstatus $7,800
ⓘ Source: listings_history table (triggers on properties + properties_extension) + one-shot
backfill from property_details.listing_events for pre-trigger history.
Tax reassessment forecast FL · Resets to sale price
- Current annual tax
- $1,774 · $148/mo
- Projected year-2 tax
- $1,774 · $148/mo
- Expected delta
- $0/yr ($0/mo · 0.0%)
ⓘ Screening estimate from a state-policy table — verify with the county assessor before closing.
Climate risk First Street
- Flood 1/10 Low FEMA zone X (unshaded) · 0% chance over 30 yrs
- Wildfire 1/10 Low
- Heat 10/10 Extreme 7 d/yr ≥106°F today · 26 d/yr by 30 yrs out
- Wind 10/10 Extreme 99% chance of damaging wind over 30 yrs
- Air quality 2/10 Low 2 unhealthy d/yr today · 2 by 30 yrs out
Nearby sold comps map
Loading sold comps map…
Walkable amenities ~0.75 mi
Loading nearby amenities…
Taxation est. · year 1
- Rental income
- $20,309
- − Mortgage interest
- −$7,276
- − Property taxes
- −$1,774
- − Insurance
- −$650
- − Repairs & maintenance
- −$1,625
- − Management
- −$1,625
- − Depreciation
- −$3,779
- Taxable income
- $3,581
- Est. tax owed @ 24.0%
- −$859
- After-tax cash flow
- $4,587/yr
For passive investors: Depreciation is non-cash, so a rental often shows a tax loss while cash-flowing — sheltering income. Rental losses are passive: they offset passive income freely, and up to $25,000/yr can offset ordinary (W-2) income if you actively participate and your MAGI is under $100k (phasing out to $0 by $150k); unused losses carry forward. On sale, claimed depreciation is recaptured at up to 25%, and gains may owe capital-gains tax (a 1031 exchange can defer both). Figures are a year-1 estimate at your 24.0% rate — not tax advice; consult a CPA.
Schools (NCES district)
- District
- St. Lucie
- NCES district ID
- 1201770
- Math proficiency
- 40% ▼ -11.00%
- Reading proficiency
- 48% ▼ -4.00%
- Median HH income
- $44,737
- Composite
- 37.28/100
- National rank
- #4449
- State rank
- #51 of 73 in FL
Livability — Fort Pierce
- Score
- 76/100
- State rank
- #226
- US rank
- #3360
Category grades
Schools grade is shown separately in the Schools card above.
Census & demographics
- Census place
- Fort Pierce, FL
- County
- Saint Lucie County · 337,150 people
- City population
- 78,556
- Metro
- Port St. Lucie, FL
- Population (ZIP)
- 17,461
- Household income
- $30,400
- Rent vs Own
- Severe rent burden
- 1995.0
Population outlook (St. Lucie County) Hauer SSP2
- Today (2025)
- 338,016 people
- By 2030
- 355,687 · +5.2%
- By 2040
- 385,521 · +14.1%
- By 2050
- 406,106 · +20.1%
- By 2075
- 441,054 · +30.5%
- By 2100
- 436,885 · +29.2%
Race, ethnicity, and origin ACS 2023
- Neighborhood character
- Majority Black (63%)
- Race & ethnicity
- Black 63% Hispanic / Latino 19% White 17% Two or more races 10%
- Hispanic origin (detail)
- Mexican 10% Puerto Rican 2% Cuban 1%
- Common ancestry
- Hispanic 17% Portuguese 1%
- Foreign-born
- 23% · Canada
- Languages at home
- 69% English-only · Spanish 14% French/Haitian/Cajun 12% Other Indo-European 4%
Political lean MEDSL · St. Lucie
- 2024 margin
- Lean R (+9.1) · D 45.1% · R 54.2%
- 2008→2024 swing
- -21.2pp toward R · 2008: 12.1pp · 2024: -9.1pp
- All cycles
- 2024: R+9.1 2020: R+1.6 2016: R+2.5 2012: D+7.9 2008: D+12.1
Not yet ingested
- Civics
- —
Market trends
- HPI YoY
- ▼ -97.20%
- Current HPI
- 384.8532
- Rent YoY
- ▲ 5.94%
- Metro
- Port St. Lucie, FL
- State GDP YoY
- ▲ 3.28%
- F500 in state
- 36
Industry mix (Fortune 500 HQ in FL)
| Industry | F500 HQs | Revenue |
|---|---|---|
| Industrial Technology | 2 | $29B |
|
||
| Insurance | 2 | $17B |
|
||
| Retail | 1 | $60B |
|
||
| Technology Distribution | 1 | $58B |
|
||
| Homebuilding | 1 | $35B |
|
||
| Technology Manufacturing | 1 | $35B |
|
||
Price history
+1565.4% since first listed2 events — show timeline
- 2026-04-02 Listed $129,900 Beaches MLS
- 1977-06-01 Sold (Public Records) $7,800 Public Records
Property tax history
+37.4%/yrLatest (2025): $1,774 · +6.2% YoY. Source: county tax records.
Cash-flow waterfall
monthlySold comps — $/sqft
last 12 mo · ≤1 miLoading sold comps…