 🏗️ New Construction
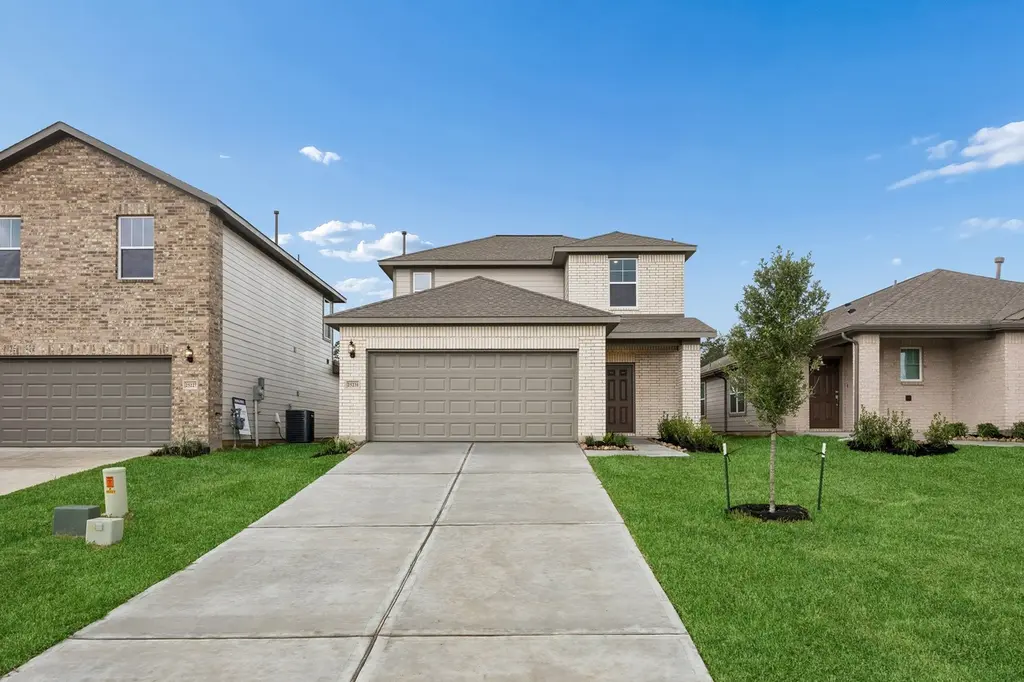
25231 Leather Leaf Ct · Todd Mission, TX
Flood risk No data
- FEMA flood zone
- —
- Chance of flooding over 30 yrs
- —
- Est. flood insurance / yr
- —
Fire risk No data
- Est. fire insurance / yr
- —
Heat risk No data
- Hot days now (above threshold)
- —
- Hot days in 30 yrs
- —
Wind risk No data
- Chance of severe wind over 30 yrs
- —
Air-quality risk No data
- Unhealthy air days now
- —
- Unhealthy air days in 30 yrs
- —
Risk factors via First Street. Map © Google.
Why this score? — see what drove the D- grade
The composite is a weighted blend of 9 inputs, each scored 0–100. Each bar is that input's sub-score; the figure is the points it added to the 100-point composite (weight × sub-score).
- Cash flow +10.5/30.0
- ARV discount +7.5/15.0
- Schools +3.9/10.0
- Livability +3.4/5.0
- 1% rule +3.3/10.0
- DSCR +3.0/10.0
- Rent growth +2.6/5.0
- Condition / age +2.5/5.0
- Appreciation +0.0/10.0
$252,000
🖨 Deal sheet 📄 Offer letter ✓ Due diligence
Listing remarks
MLS# 86171298 - Built by Imagination Homes - Ready Now! ~ Imagination Homes proudly presents The Stanza floorplan! This spacious two-story home offers 4 bedrooms, 2.5 bathrooms, a 2-car garage, and 1,927 SF of thoughtfully designed living space. The first floor features a bright open-concept layout connecting the family room, dining area, and kitchen—perfect for everyday living and entertaining. The kitchen includes a central island, oversized pantry, and convenient access to the utility room. A powder bath near the entry is ideal for guests. The private first-floor primary suite offers a relaxing retreat with a large bedroom, two walk-in closets, and an en-suite bath with dual vaniti
Key facts
- Central island
- Dual vanities
- En-suite bath
Tags
Property features AI
Finance
- HOA & community: Association managed by Inframark; Annual association fee of $550
Exterior
- Parking: Attached garage; 2 garage spaces
- Security: Smoke detector(s)
- Utilities: Public water; Public sewer
- Home design: Residential property; New construction; Faces north; One-story entry with additional upstairs bedrooms (two-story overall)
- Construction: Built in 2026; Brick and cement siding exterior; Composition roof; Slab foundation
- Exterior features: Fully fenced private yard; Back yard fencing; Subdivision lot
Interior
- Kitchen: Dishwasher; Disposal; Gas oven; Gas range; Microwave; Quartz counters; Kitchen island; Pantry; Walk-in pantry
- Bedrooms: Primary bedroom on the first floor (approx. 15 x 13); Bedroom on the second floor (approx. 10 x 11); Bedroom on the second floor (approx. 10 x 11); Bedroom on the second floor (approx. 10 x 10)
- Flooring: Carpet; Plank; Vinyl
- Bathrooms: 2 full bathrooms; 1 half bathroom
- Heating & cooling: Central heating (gas); Central electric air conditioning
- Interior features: Insulated doors; Double vanity; Kitchen island; Kitchen/family room combo; Bath in primary bedroom; Pantry; Quartz counters; Soaking tub; Separate shower; Tub/shower; Walk-in pantry; Kitchen/dining combo; Loft; Low emissivity windows; ENERGY STAR qualified appliances
- Laundry & utility: Washer hookup; Electric dryer hookup
Neighborhood map
What this means for you Summary
Snapshot
- This is a 4-bed/2.5-bath single-family listed at $252k.
Deal economics
- At list price, monthly cash flow is $-130 ($-2k/yr) — negative.
- To cash-flow at today's rent, offer at most $239k (5.1% below list).
- To meet the 1% rule (rent ≥ 1% of price), the offer needs to be $215k (14.7% below list).
- Recommended offer: $215k (14.7% below list) — sets the bar for 1% rule.
- Cap rate 5.7% vs local median 2.9% in Todd Mission — top-decile yield for the area; either an underpriced asset or a hidden risk that comps aren't pricing in. Stress-test before assuming the spread holds.
Location & tenants
- Location reads 67/100 on livability (#549 in TX) — a middle-class / working-renter tenant base. Strengths: employment A+, cost of living A+, housing A+; Watch: amenities F, commute F, health & safety F.
- Magnolia ISD (rural): math 42% / reading 45% proficiency, ranked #247 of 826 in TX (top 30%) — families likely to look elsewhere, expect single-tenant / working-renter base with shorter leases.
- Zoned schools: Magnolia West H S (math 41% / reading 53%, grade D-, #591 of 1,632 statewide, top 38%, 2,208 students, 52% FRL).
- Market conditions: Rents flat; 2283 active listings in the ZIP; 1 comparable units currently listed for rent nearby; high-income renter base; 13,259 units permitted in Montgomery County in 2024 (1,402 in 5+ unit buildings).
Forward outlook
- Local home prices are declining (-3.0%/yr); year-one equity from $2k of loan paydown is wiped out by about $8k of value loss. Plan a longer hold.
- Montgomery County population projected at +65% by 2050 — long-run rental-demand tailwind backs the buy-and-hold thesis.
Negotiation context
- It's been on market 47 days — a 3% lower offer ($244k) is reasonable based on typical stale-listing flexibility.
Questions for the listing agent
- What do current leases actually rent for vs. the listed asking? Can we see a recent rent roll and the last 12 months of T-12 income?
- It's been on market 47 days. Have you received any prior offers? Is the seller open to a 15% concession, seller financing, or rate buy-down credit?
- What does the HOA fee cover, when was the last increase, and are there any pending special assessments or reserve-fund shortfalls?
- Is there a deadline driving the sale (1031 exchange, divorce, estate, relocation)? That informs how much negotiation room exists.
- Schools are F-rated, which usually means shorter tenancies and higher turnover. Who's the typical renter profile here, and what's been the actual vacancy rate?
- The area grade is low — what's the realistic commute time and amenity access for the typical tenant pool here? Any planned neighborhood developments (good or bad) we should know about?
- What's the average days-on-market for RENTAL listings here right now (not sales)? A rising rental-DOM trend means longer vacancies and softer asking-rent achievability than the comps imply.
- What's the recent tenant-quality profile in this submarket — average credit score on applications, eviction rate, late-payment / NSF rate, and stable-employment percentage? A property-management company in the area should have these aggregated.
- How much new for-sale + rental construction is in the pipeline within 1–3 miles? Heavy new supply typically softens prices + rents 12–24 months out; constrained supply supports both.
Investment metrics
- 1% rule
- 0.83% ✗
- Cap rate
- 5.69%
- Cash-on-cash
- -2.16%
- DSCR
- 0.90
- GRM
- 10.0
CMA / ARV
- ARV (on-the-fly)
- $257,972
- Comps found
- 12
Show comp detail 12 sales within ~0.75 mi
| Address | Dist | Beds/Ba | Sqft | Sold | Price | $/sf | Match |
|---|---|---|---|---|---|---|---|
| 25280 Leather Leaf Ct | 0.10mi | 4/2.5 | 1,881 (+4%) | 2mo | $261,990 | $139 | 87 |
| 25564 Blossom Ct | 0.20mi | 4/2.5 | 1,881 (+4%) | 1mo | $263,990 | $140 | 83 |
| 25494 Blossom Ct | 0.15mi | 3/2.5 (-1) | 1,880 (+4%) | 0mo | $276,403 | $147 | 80 |
| 25456 Blossom Ct | 0.16mi | 4/2.0 | 1,932 (+7%) | 0mo | $264,900 | $137 | 78 |
| 5822 Agave Ln | 0.25mi | 3/2.0 (-1) | 1,772 (-2%) | 2mo | $269,873 | $152 | 77 |
| 25272 Leather Leaf Ct | 0.08mi | 4/2.0 | 1,607 (-11%) | 1mo | $254,990 | $159 | 75 |
| 25446 Carnation Ct | 0.19mi | 4/2.5 | 1,979 (+10%) | 1mo | $270,990 | $137 | 74 |
| 25295 Leather Leaf Ct | 0.12mi | 4/2.0 | 1,607 (-11%) | 3mo | $254,990 | $159 | 72 |
| 25427 Blossom Ct | 0.16mi | 3/2.0 (-1) | 1,675 (-7%) | 3mo | $239,900 | $143 | 72 |
| 25561 Blossom Ct | 0.20mi | 4/2.0 | 1,607 (-11%) | 1mo | $254,990 | $159 | 70 |
| 25605 Microstar Way | 0.38mi | 3/2.0 (-1) | 1,694 (-6%) | 1mo | $239,000 | $141 | 64 |
| 25319 Yellowbells Pl | 0.27mi | 4/2.5 | 2,049 (+14%) | 2mo | $279,135 | $136 | 63 |
Match score weights: distance 35% · size 25% · config 20% · recency 20%. Top-matched comps best support the ARV.
Projected returns pro-forma
-3.0% appreciation · 0.4% rent growth · sell at horizon
- IRR
- -22.9%
- Equity multiple
- 0.23×
- Total profit
- $-55,515
- Equity at exit
- $38,464
- IRR
- -26.2%
- Equity multiple
- -0.11×
- Total profit
- $-80,127
- Equity at exit
- $22,305
Cash invested: $72,232 (down + closing). Projections, not guarantees.
Landlord ↔ Tenant lean methodology
- Overall (STATE)
- 87 Strongly Landlord-Friendly
- State Texas
- 87 Strongly Landlord-Friendly · R+5
- County
- — inherits STATE
- City
- — inherits STATE
ZIP-level market 77316
- Home prices YoY
- -10.7%
- Rents YoY
- 0.4%
- Active inventory
- 2283
- Price-to-rent
- 9.8×
Monthly cashflow live
- Estimated rent
- $2,150 medium interval (Pro) →
- Mortgage (P&I)
- −$1,353
- Tax est. 1.5%
- −$322 /mo · $3,870/yr
- Insurance
- −$107
- HOA
- −$46
- Vacancy / Maint / Mgmt
- −$452
- Net cashflow
- $-130
Break-even live
UW: 25.0% down · 7.5% · 30yr · 1.5% tax · 5.0% vac · 8.0% maint · 8.0% mgmt
Financing live
Cash to close
- Down payment
- $64,493
- Closing costs
- $7,739
- Reserves months
- —
- Total cash needed
- —
Loan-product check · same deal, 3 products live
Conventional
25% down · 7.5% · 30yr
- Down + closing
- —
- Monthly P&I
- —
- Monthly cashflow
- —
- DSCR
- —
- Eligible?
- —
Personal DTI + credit; lowest rate.
DSCR
20% down · 8.5% · 30yr
- Down + closing
- —
- Monthly P&I
- —
- Monthly cashflow
- —
- DSCR
- —
- Eligible?
- —
No personal income docs; deal must DSCR.
Hard money
10% down · 12.0% · 12mo
- Down + closing
- —
- Monthly P&I
- —
- Monthly cashflow
- —
- DSCR
- —
- Eligible?
- —
Short-term bridge; refi at stabilization.
Rent comps 1 comps
| Address | Beds | Baths | Sqft | Rent | $/sqft | DOM | Units | Dist |
|---|---|---|---|---|---|---|---|---|
| 25553 Blossom Ct Montgomery, TX | 3.0 | 2.0 | 1249 | $1,690 | $1.35 | 2d | 1 | 0.21mi |
HOA detail
- Monthly dues
- $46 · $552/yr
Listing history 2 events
-
2026-04-30status Pending
-
2026-03-14$252,000 Active
ⓘ Source: listings_history table (triggers on properties + properties_extension) + one-shot
backfill from property_details.listing_events for pre-trigger history.
Nearby sold comps map
Loading sold comps map…
Walkable amenities ~0.75 mi
Loading nearby amenities…
Taxation est. · year 1
- Rental income
- $25,802
- − Mortgage interest
- −$14,450
- − Property taxes
- −$3,870
- − Insurance
- −$1,290
- − Repairs & maintenance
- −$2,064
- − Management
- −$2,064
- − HOA
- −$552
- − Depreciation
- −$7,505
- Taxable loss
- −$5,993
- Est. tax savings @ 24.0%
- +$1,438
- After-tax cash flow
- $-124/yr
For passive investors: Depreciation is non-cash, so a rental often shows a tax loss while cash-flowing — sheltering income. Rental losses are passive: they offset passive income freely, and up to $25,000/yr can offset ordinary (W-2) income if you actively participate and your MAGI is under $100k (phasing out to $0 by $150k); unused losses carry forward. On sale, claimed depreciation is recaptured at up to 25%, and gains may owe capital-gains tax (a 1031 exchange can defer both). Figures are a year-1 estimate at your 24.0% rate — not tax advice; consult a CPA.
Schools (NCES district)
- District
- Magnolia ISD
- NCES district ID
- 4828740
- Math proficiency
- 42% ▼ -7.00%
- Reading proficiency
- 45% ▼ -4.00%
- Median HH income
- $71,692
- Composite
- 39.46/100
- National rank
- #3958
- State rank
- #247 of 826 in TX
Livability — Todd Mission
- Score
- 67/100
- State rank
- #549
- US rank
- #10627
Category grades
Schools grade is shown separately in the Schools card above.
Census & demographics
- County
- Montgomery County · 663,713 people
- Metro
- Houston-The Woodlands-Sugar Land, TX
- Population (ZIP)
- 34,694
- Household income
- $124,055
- Rent vs Own
- Severe rent burden
- 273.0
Population outlook (Montgomery County) Hauer SSP2
- Today (2025)
- 713,896 people
- By 2030
- 805,263 · +12.8%
- By 2040
- 992,708 · +39.1%
- By 2050
- 1,179,590 · +65.2%
- By 2075
- 1,628,084 · +128.1%
- By 2100
- 1,937,880 · +171.5%
Race, ethnicity, and origin ACS 2023
- Neighborhood character
- Predominantly White (80%)
- Race & ethnicity
- White 80% Hispanic / Latino 14% Two or more races 11% Black 1% Asian 1%
- Hispanic origin (detail)
- Mexican 9%
- Common ancestry
- Lithuanian 6% Slovak 3% Romanian 3%
- Foreign-born
- 6% · Canada
- Languages at home
- 90% English-only · Spanish 8%
Political lean MEDSL · Montgomery
- 2024 margin
- Solid R (+45.5) · D 26.8% · R 72.3%
- 2008→2024 swing
- +7.2pp toward D · 2008: -52.7pp · 2024: -45.5pp
- All cycles
- 2024: R+45.5 2020: R+43.8 2016: R+51.4 2012: R+60.7 2008: R+52.7
Not yet ingested
- Civics
- —
Market trends
- HPI YoY
- ▼ -31.44%
- Current HPI
- 262.6973
- Rent YoY
- ▲ 0.40%
- Metro
- Houston-The Woodlands-Sugar Land, TX
- State GDP YoY
- ▲ 3.95%
- F500 in state
- 110
Industry mix (Fortune 500 HQ in TX)
| Industry | F500 HQs | Revenue |
|---|---|---|
| Energy | 16 | $1,198B |
|
||
| Technology | 5 | $198B |
|
||
| Engineering / Construction | 4 | $72B |
|
||
| Energy Services | 3 | $60B |
|
||
| Utilities | 3 | $41B |
|
||
| Healthcare | 2 | $330B |
|
||
Price history
2 events — show timeline
- 2026-04-30 Pending — HARMLS
- 2026-03-14 Listed $252,000 HARMLS
Cash-flow waterfall
monthlySold comps — $/sqft
last 12 mo · ≤1 miLoading sold comps…