109 Somers Ln #109 · Lawrenceville, PA
Flood risk 3/10 · Minor
- FEMA flood zone
- X (unshaded)
- Chance of flooding over 30 yrs
- 0.2%
- Est. flood insurance / yr
- $507 – $1,088
Fire risk 2/10 · Minimal
- Est. fire insurance / yr
- $511 – $949
Heat risk 3/10 · Minor
- Hot days now (above 94°F)
- 7 days/yr
- Hot days in 30 yrs
- 16 days/yr
Wind risk 2/10 · Minimal
- Chance of severe wind over 30 yrs
- 1.0%
Air-quality risk 2/10 · Minimal
- Unhealthy air days now
- 0 days/yr
- Unhealthy air days in 30 yrs
- 1 days/yr
Risk factors via First Street. Map © Google.
Why this score? — see what drove the B+ grade
The composite is a weighted blend of 9 inputs, each scored 0–100. Each bar is that input's sub-score; the figure is the points it added to the 100-point composite (weight × sub-score).
- Cash flow +30.0/30.0
- 1% rule +10.0/10.0
- DSCR +10.0/10.0
- ARV discount +7.5/15.0
- Appreciation +6.4/10.0
- Schools +3.7/10.0
- Livability +3.1/5.0
- Rent growth +2.5/5.0
- Condition / age +2.2/5.0
$49,995
🖨 Deal sheet (PDF) 📄 Offer letter ✓ Due diligence
Listing remarks
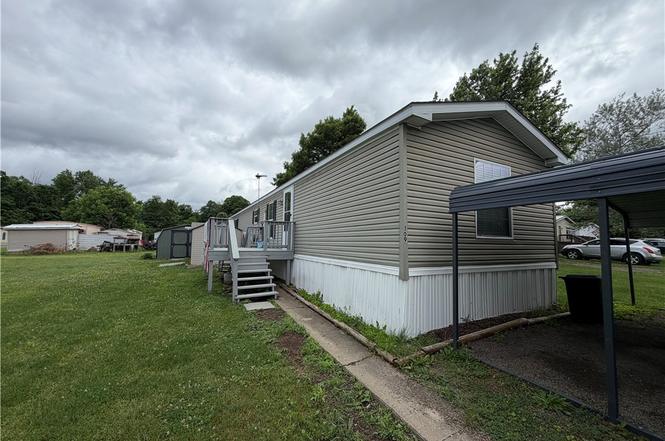
Welcome to this well-maintained 2-bedroom, 2-full bathroom single-wide manufactured home offering approximately 1,095 square feet of comfortable living space. The home features a functional layout with spacious living areas, a primary suite with its own full bath, and a deck perfect for enjoying your morning coffee or relaxing outdoors. Situated on a rented lot in a convenient location, lot rent is $395 includes trash removal, plus water and sewer. Whether you're looking to downsize or seeking an affordable housing option, this property offers great potential and low-maintenance living. Buyers must obtain park approval.
Key facts
- Primary suite
- Deck
- Functional layout
Tags
Property features AI
Finance
- Financial info: Land lease fee applies
- HOA & community: Has land lease
Exterior
- Parking: No garage
- Utilities: Electricity connected; Public water connected; Sewer connected; High-speed internet available
- Home design: Single-story property; Single wide mobile home (Colony Factory Crafted Ho); Resale condition
- Construction: Frame construction with vinyl siding; Shingle roof; Pillar/post/pier and slab foundation; Existing structure
- Exterior features: Deck; Gravel driveway; Rectangular lot
Interior
- Kitchen: Gas oven; Gas range; Dishwasher; Refrigerator
- Bedrooms: Two main-level bedrooms
- Flooring: Carpet; Vinyl; Varies
- Bathrooms: Two full bathrooms (both on main level)
- Heating & cooling: Gas heating with forced air; Ductless heating option; Ductless cooling
- Interior features: Ceiling fans; Separate/formal living room; Primary suite / main level primary; Bedroom on main level; Other interior features (see remarks)
- Laundry & utility: Washer; Dryer; Gas water heater
Neighborhood map
What this means for you Summary
Snapshot
- This is a 2-bed/2.0-bath manufactured listed at $50k. Condition is rated fair.
Deal economics
- At list price, monthly cash flow is $263 ($3k/yr) — positive.
- The deal already cash-flows at list — no discount required.
- Meets the 1% rule at list price ($770 rent vs $50k).
Location & tenants
- Location reads 62/100 on livability (#1,340 in PA) — a middle-class / working-renter tenant base. Strengths: cost of living A+, housing A+; Watch: health & safety D, amenities F, commute F.
- Northern Tioga SD (rural): math 34% / reading 54% proficiency, ranked #301 of 539 in PA (top 56%) — families likely to look elsewhere, expect single-tenant / working-renter base with shorter leases.
- Zoned schools: Russell B Walter El Sch (math 42% / reading 60%, grade C-, #636 of 1,518 statewide, top 42%, 493 students, 100% FRL); Williamson Shs (math 26% / reading 50%, grade F, #285 of 437 statewide, top 65%, 535 students, 100% FRL) — zoned schools average 100% FRL vs 45% district-wide (55 pts higher); higher-poverty schools than district average — tighter screening recommended.
- Market conditions: 14 active listings in the ZIP; 32 units permitted in Tioga County in 2024 (0 in 5+ unit buildings).
Forward outlook
- In year one you build about $2k of equity ($345 loan paydown + $1k appreciation (2.9% local appreciation)).
- Tioga County population projected at -20% by 2050 — secular population decline; favor cash flow + early exit over multi-decade hold.
- At projected returns (2.9% appreciation + 3.0% rent growth), your $14k cash investment doubles in ~3 years — after that, you're playing with house money.
Negotiation context
- Only 7 days on market — expect competitive offers; lowballing is unlikely to land.
Questions for the listing agent
- Have any recent inspections been done? Can we get a copy of the seller's disclosures and any deferred-maintenance estimates?
- Is there a deadline driving the sale (1031 exchange, divorce, estate, relocation)? That informs how much negotiation room exists.
- Schools are F-rated, which usually means shorter tenancies and higher turnover. Who's the typical renter profile here, and what's been the actual vacancy rate?
- What's the average days-on-market for RENTAL listings here right now (not sales)? A rising rental-DOM trend means longer vacancies and softer asking-rent achievability than the comps imply.
- What's the recent tenant-quality profile in this submarket — average credit score on applications, eviction rate, late-payment / NSF rate, and stable-employment percentage? A property-management company in the area should have these aggregated.
- How much new for-sale + rental construction is in the pipeline within 1–3 miles? Heavy new supply typically softens prices + rents 12–24 months out; constrained supply supports both.
Investment metrics
- 1% rule
- 1.54% ✓
- Cap rate
- 12.60%
- Cash-on-cash
- 22.54%
- DSCR
- 2.00
- GRM
- 5.4
CMA / ARV
No comps found within radius.
Projected returns pro-forma
2.89% appreciation · 3.0% rent growth · sell at horizon
- IRR
- 28.5%
- Equity multiple
- 2.61×
- Total profit
- $22,488
- Equity at exit
- $22,171
- IRR
- 29.1%
- Equity multiple
- 5.07×
- Total profit
- $56,974
- Equity at exit
- $33,929
Cash invested: $13,999 (down + closing). Projections, not guarantees.
Landlord ↔ Tenant lean methodology
- Overall (STATE)
- 62 Landlord-Friendly
- State Pennsylvania
- 62 Landlord-Friendly · EVEN
- County
- — inherits STATE
- City
- — inherits STATE
ZIP-level market 16929
- Home prices YoY
- 0.9%
- Active inventory
- 14
- Price-to-rent
- 5.4×
Monthly cashflow live
- Estimated rent
- $770 medium interval (Pro) →
- Mortgage (P&I)
- −$262
- Tax est. 1.5%
- −$62 /mo · $750/yr
- Insurance
- −$21
- HOA
- −$0
- Lot rent leased land?
- −$0
- Vacancy / Maint / Mgmt
- −$162
- Net cashflow
- $263
Break-even live
Sensitivity live
| Price | -10% $297 | -5% $280 | +0% $263 | +5% $246 | +10% $228 |
|---|---|---|---|---|---|
| Rent | -10% $202 | -5% $232 | +0% $263 | +5% $293 | +10% $324 |
| Rate | -1.0pp $288 | -0.5pp $276 | base $263 | +0.5pp $250 | +1.0pp $237 |
UW: 25.0% down · 7.5% · 30yr · 1.5% tax · 5.0% vac · 8.0% maint · 8.0% mgmt
Financing live
Cash to close
- Down payment
- $12,499
- Closing costs
- $1,500
- Reserves months
- —
- Total cash needed
- —
Loan-product check · same deal, 3 products live
Conventional
25% down · 7.5% · 30yr
- Down + closing
- —
- Monthly P&I
- —
- Monthly cashflow
- —
- DSCR
- —
- Eligible?
- —
Personal DTI + credit; lowest rate.
DSCR
20% down · 8.5% · 30yr
- Down + closing
- —
- Monthly P&I
- —
- Monthly cashflow
- —
- DSCR
- —
- Eligible?
- —
No personal income docs; deal must DSCR.
Hard money
10% down · 12.0% · 12mo
- Down + closing
- —
- Monthly P&I
- —
- Monthly cashflow
- —
- DSCR
- —
- Eligible?
- —
Short-term bridge; refi at stabilization.
Listing history 8 events
-
2026-06-22days on market $49,995 Active 7 DOM
-
2026-06-21days on market $49,995 Active 6 DOM
-
2026-06-21days on market $49,995 Active 5 DOM
-
2026-06-18days on market $49,995 Active 3 DOM
-
2026-06-17remarks 627-char remark
-
2026-06-17days on market $49,995 Active 2 DOM
-
2026-06-16remarks 597-char remark
-
2026-06-16$49,995 Active 1 DOM
ⓘ Source: listings_history table (triggers on properties + properties_extension) + one-shot
backfill from property_details.listing_events for pre-trigger history.
Climate risk First Street
- Flood 3/10 Moderate FEMA zone X (unshaded) · 20% chance over 30 yrs
- Wildfire 2/10 Low
- Heat 3/10 Moderate 7 d/yr ≥94°F today · 16 d/yr by 30 yrs out
- Wind 2/10 Low 100% chance of damaging wind over 30 yrs
- Air quality 2/10 Low 0 unhealthy d/yr today · 1 by 30 yrs out
Nearby sold comps map
Loading sold comps map…
Walkable amenities ~0.75 mi
Loading nearby amenities…
Taxation est. · year 1
- Rental income
- $9,242
- − Mortgage interest
- −$2,800
- − Property taxes
- −$750
- − Insurance
- −$250
- − Repairs & maintenance
- −$739
- − Management
- −$739
- − Depreciation
- −$1,454
- Taxable income
- $2,508
- Est. tax owed @ 24.0%
- −$602
- After-tax cash flow
- $2,553/yr
For passive investors: Depreciation is non-cash, so a rental often shows a tax loss while cash-flowing — sheltering income. Rental losses are passive: they offset passive income freely, and up to $25,000/yr can offset ordinary (W-2) income if you actively participate and your MAGI is under $100k (phasing out to $0 by $150k); unused losses carry forward. On sale, claimed depreciation is recaptured at up to 25%, and gains may owe capital-gains tax (a 1031 exchange can defer both). Figures are a year-1 estimate at your 24.0% rate — not tax advice; consult a CPA.
Condition & rehab AI · 1 photo
This manufactured home requires moderate repairs and maintenance, with a focus on exterior and interior painting to enhance its curb appeal and resale value.
Repairs flagged
- Moderate exterior siding — Worn appearance
- Major kitchen — No photos of the kitchen
- Major bathrooms — No photos of the bathrooms
- Minor landscaping — No photos of landscaping
Value-add opportunities
- Both paint exterior — Enhances curb appeal and resale value
- Both paint interior walls — Improves interior appearance and resale value
Renovation cost estimate screening
| Repair item | Severity | Est. cost |
|---|---|---|
| exterior siding · Worn appearance | Moderate | $3,000–15,000 |
| kitchen · No photos of the kitchen | Major | $15,000–50,000 |
| bathrooms · No photos of the bathrooms | Major | $15,000–50,000 |
| landscaping · No photos of landscaping | Minor | $500–3,000 |
| Total estimated repair cost · 4 items | $33,500–118,000 |
Value-add ROI direction
- Both paint exterior — Enhances curb appeal and resale value ↑
- Both paint interior walls — Improves interior appearance and resale value ↑
ⓘ Cost ranges are severity-bucket heuristics (US national rule-of-thumb). Get contractor quotes + a written scope before underwriting a rehab budget.
Schools (NCES district)
- District
- Northern Tioga SD
- NCES district ID
- 4217730
- Math proficiency
- 34% ▼ -4.00%
- Reading proficiency
- 54% ▼ -4.00%
- Median HH income
- $41,816
- Composite
- 36.95/100
- National rank
- #4534
- State rank
- #301 of 539 in PA
Livability — Lawrenceville
- Score
- 62/100
- State rank
- #1340
- US rank
- #16567
Category grades
Schools grade is shown separately in the Schools card above.
Census & demographics
- Population (ZIP)
- 2,569
Population outlook (Tioga County) Hauer SSP2
- Today (2025)
- 40,253 people
- By 2030
- 38,795 · -3.6%
- By 2040
- 35,376 · -12.1%
- By 2050
- 32,081 · -20.3%
- By 2075
- 24,341 · -39.5%
- By 2100
- 17,180 · -57.3%
Race, ethnicity, and origin ACS 2023
- Neighborhood character
- Predominantly White (92%)
- Race & ethnicity
- White 92% Two or more races 4% Black 2% Hispanic / Latino 2% Asian 1%
- Common ancestry
- Slovak 3% Italian 3% Iranian 2%
- Foreign-born
- 1% · China, Canada, Jamaica
- Languages at home
- 98% English-only · Chinese 1% Spanish 0%
Political lean MEDSL · Tioga
- 2024 margin
- Solid R (+51.8) · D 23.6% · R 75.4% · Other 1.0%
- 2008→2024 swing
- -24.3pp toward R · 2008: -27.4pp · 2024: -51.8pp
- All cycles
- 2024: R+51.8 2020: R+51.2 2016: R+53.6 2012: R+34.8 2008: R+27.4
Not yet ingested
- Civics
- —
Market trends
- HPI YoY
- ▲ 2.89%
- Current HPI
- 315.5799
- Rent YoY
- —
- Metro
- —
- State GDP YoY
- ▲ 1.68%
- F500 in state
- 34
Industry mix (Fortune 500 HQ in PA)
| Industry | F500 HQs | Revenue |
|---|---|---|
| Healthcare | 2 | $309B |
|
||
| Insurance | 2 | $27B |
|
||
| Telecommunications / Media | 1 | $124B |
|
||
| Industrial Distribution | 1 | $22B |
|
||
| Financial Services | 1 | $20B |
|
||
| Chemicals / Materials | 1 | $18B |
|
||
Price history
1 event — show timeline
- 2026-06-15 Listed $49,995 UNYREIS
Cash-flow waterfall
monthlySold comps — $/sqft
last 12 mo · ≤1 miLoading sold comps…