 Duplex
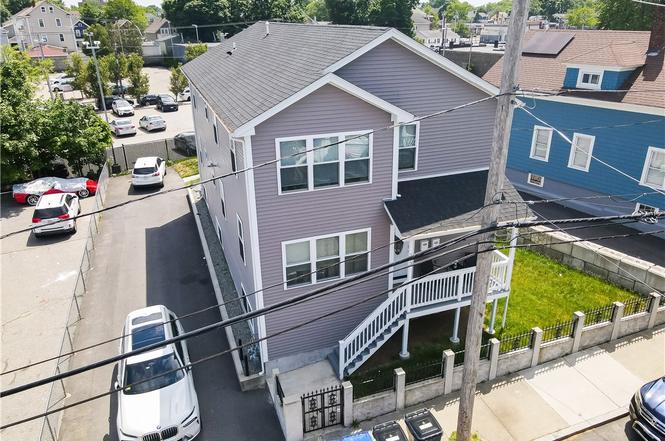
172 Baker St · Providence, RI
Flood risk No data
- FEMA flood zone
- —
- Chance of flooding over 30 yrs
- —
- Est. flood insurance / yr
- —
Fire risk No data
- Est. fire insurance / yr
- —
Heat risk No data
- Hot days now (above threshold)
- —
- Hot days in 30 yrs
- —
Wind risk No data
- Chance of severe wind over 30 yrs
- —
Air-quality risk No data
- Unhealthy air days now
- —
- Unhealthy air days in 30 yrs
- —
Risk factors via First Street. Map © Google.
Why this score? — see what drove the D- grade
The composite is a weighted blend of 9 inputs, each scored 0–100. Each bar is that input's sub-score; the figure is the points it added to the 100-point composite (weight × sub-score).
- Cash flow +12.9/30.0
- ARV discount +7.5/15.0
- Livability +4.2/5.0
- DSCR +3.9/10.0
- Rent growth +3.4/5.0
- 1% rule +2.8/10.0
- Condition / age +2.5/5.0
- Schools +1.0/10.0
- Appreciation +0.0/10.0
$672,000
🖨 Deal sheet 📄 Offer letter ✓ Due diligence
Multi-family units
County records classify this as Multi-Family (2-4 Unit). Listing-text estimate: 2 units. confirmed
Listing remarks
Welcome to 172 Baker Street, a beautiful two-family home built in 2022, offering modern design and exceptional investment potential. Each spacious unit features 4 bedrooms, 2 full bathrooms, and an open-concept layout with shaker-style cabinetry, quartz countertops, stainless steel appliances, recessed lighting, tiled bathrooms, and primary suites with en-suite baths and double closets. Additional highlights include central heat and air conditioning, separate utilities, a rear deck, a decorative black iron fence, and a double-sided driveway with parking for plenty vehicles. The walkout basement offers excellent ADU or expansion potential, subject to local approvals. Conveniently loca
Key facts
- Quartz countertops
- Recessed lighting
- Investment potential
Tags
Property features AI
Finance
- Other: Lot size approximately 5,054 sq ft (0.116 acre)
- Financial info: Property configured as a two-unit multifamily; Each unit is approximately 1,276 sq ft; Each unit shows actual rent of $2,400 (current data); To be delivered vacant
Exterior
- Parking: No garage; Room for 6 vehicles (total parking spaces: 6)
- Utilities: Public water (connected); Public sewer (connected); 100 amp electric service; Sewer and water assessments apply
- Home design: Two-story building; Single building containing two residential units
- Construction: Drywall and vinyl siding exterior; Built with conventional foundation (basement present)
- Exterior features: Paved driveway; Fenced yard; Zoned R2
Interior
- Kitchen: Oven; Range; Refrigerator
- Bedrooms: Two 4-bedroom units (each unit to be delivered vacant)
- Flooring: Hardwood floors
- Bathrooms: Four full bathrooms total (two full bathrooms in each unit)
- Heating & cooling: Forced air gas heating; Central air conditioning
- Interior features: Attic; Tub with shower; Unfinished full basement with both interior and exterior entry; 2,552 above-grade finished living area
- Laundry & utility: Common area laundry
Neighborhood map
What this means for you Summary
Snapshot
- This is a 2 × 4-bed/4.0-bath units multifamily listed at $672k.
Deal economics
- At list price, monthly cash flow is $-45 ($-540/yr) — negative. Per door: $-23/mo.
- To cash-flow at today's rent, offer at most $664k (1.2% below list).
- To meet the 1% rule (rent ≥ 1% of price), the offer needs to be $527k (21.6% below list).
- Recommended offer: $527k (21.6% below list) — sets the bar for 1% rule.
- Cap rate 6.2% vs local median 4.2% in Providence — top-decile yield for the area; either an underpriced asset or a hidden risk that comps aren't pricing in. Stress-test before assuming the spread holds.
Location & tenants
- Location reads 84/100 on livability (#2 in RI, #794 nationally) — a professional / high-income tenant draw. Strengths: amenities A+, commute A+, housing A+; Watch: employment C-, schools F.
- Providence (urban): math 8% / reading 16% proficiency, ranked #34 of 39 in RI (top 87%) — low school quality limits family demand, transient renter base, plan for 1-2y turnover; 79% free/reduced lunch — lower-income household profile, screen leases tightly.
- Market conditions: Rents rising (+3.5%/yr); 75 active listings in the ZIP; 776 units permitted in Providence County in 2024 (229 in 5+ unit buildings).
- At $5,267/mo this rent would consume 100% of the median local household income ($63k/yr) (locally 1220% of renters already pay >50% of income on rent) — very limited rent-growth headroom before tenants either downsize or default.
Forward outlook
- Local home prices are declining (-3.0%/yr); year-one equity from $5k of loan paydown is wiped out by about $20k of value loss. Plan a longer hold.
- Providence County population projected at +5% by 2050 — modest demand growth; plan on rents tracking national, not racing it.
Negotiation context
- Only 8 days on market — expect competitive offers; lowballing is unlikely to land.
Questions for the listing agent
- What do current leases actually rent for vs. the listed asking? Can we see a recent rent roll and the last 12 months of T-12 income?
- Can we see the unit-by-unit rent roll, current vacancy, and any below-market leases? What's the average tenancy length?
- What capital expenditures (roof, boiler, parking lot, exteriors) have been made in the last 5 years, and what's planned in the next 2?
- Is there a deadline driving the sale (1031 exchange, divorce, estate, relocation)? That informs how much negotiation room exists.
- Schools are F-rated, which usually means shorter tenancies and higher turnover. Who's the typical renter profile here, and what's been the actual vacancy rate?
- The area grade is low — what's the realistic commute time and amenity access for the typical tenant pool here? Any planned neighborhood developments (good or bad) we should know about?
- What's the average days-on-market for RENTAL listings here right now (not sales)? A rising rental-DOM trend means longer vacancies and softer asking-rent achievability than the comps imply.
- What's the recent tenant-quality profile in this submarket — average credit score on applications, eviction rate, late-payment / NSF rate, and stable-employment percentage? A property-management company in the area should have these aggregated.
- How much new apartment / multifamily construction is in the pipeline within 1–3 miles? Heavy new supply (>2% of stock underway) typically softens rents 12–24 months out; light construction supports rent growth.
Investment metrics
- 1% rule
- 0.78% ✗
- Cap rate
- 6.21%
- Cash-on-cash
- -0.29%
- DSCR
- 0.99
- GRM
- 10.6
CMA / ARV
No comps found within radius.
Projected returns pro-forma
-3.0% appreciation · 3.45% rent growth · sell at horizon
- IRR
- -16.4%
- Equity multiple
- 0.42×
- Total profit
- $-109,555
- Equity at exit
- $100,197
- IRR
- -7.4%
- Equity multiple
- 0.52×
- Total profit
- $-89,943
- Equity at exit
- $58,102
Cash invested: $188,160 (down + closing). Projections, not guarantees.
Landlord ↔ Tenant lean methodology
- Overall (STATE)
- 31 Tenant-Leaning
- State Rhode Island
- 31 Tenant-Leaning · D+8
- County
- — inherits STATE
- City
- — inherits STATE
ZIP-level market 02905
- Rents YoY
- 3.5%
- Active inventory
- 75
- Price-to-rent
- 21.3×
Monthly cashflow live
- Estimated rent
- $5,267 medium interval (Pro) →
- Mortgage (P&I)
- −$3,524
- Tax from tax record
- −$402 /mo · $4,823/yr
- Insurance
- −$280
- HOA
- −$0
- Vacancy / Maint / Mgmt
- −$1,106
- Net cashflow
- $-45
Break-even live
2-unit breakdown (identical units grouped — click to expand)
| Units | Beds | Baths | Est. rent |
|---|---|---|---|
| 2× units | 4 | 4 | $5,266 |
| #1 | 4 | 4 | $2,633 |
| #2 | 4 | 4 | $2,633 |
| Total (2 units) | $5,267 | ||
UW: 25.0% down · 7.5% · 30yr · 1.5% tax · 5.0% vac · 8.0% maint · 8.0% mgmt
Financing live
Cash to close
- Down payment
- $168,000
- Closing costs
- $20,160
- Reserves months
- —
- Total cash needed
- —
Loan-product check · same deal, 3 products live
Conventional
25% down · 7.5% · 30yr
- Down + closing
- —
- Monthly P&I
- —
- Monthly cashflow
- —
- DSCR
- —
- Eligible?
- —
Personal DTI + credit; lowest rate.
DSCR
20% down · 8.5% · 30yr
- Down + closing
- —
- Monthly P&I
- —
- Monthly cashflow
- —
- DSCR
- —
- Eligible?
- —
No personal income docs; deal must DSCR.
Hard money
10% down · 12.0% · 12mo
- Down + closing
- —
- Monthly P&I
- —
- Monthly cashflow
- —
- DSCR
- —
- Eligible?
- —
Short-term bridge; refi at stabilization.
Listing history 6 events
-
2026-06-18days on market $672,000 Active 8 DOM
-
2026-06-17days on market $672,000 Active 7 DOM
-
2026-06-16days on market $672,000 Active 6 DOM
-
2026-06-15days on market $672,000 Active 5 DOM
-
2026-06-13remarks 699-char remark
-
2026-06-13$672,000 Active 3 DOM
ⓘ Source: listings_history table (triggers on properties + properties_extension) + one-shot
backfill from property_details.listing_events for pre-trigger history.
Tax reassessment forecast RI · Partial reset (capped growth)
- Current annual tax
- $4,823 · $402/mo
- Projected year-2 tax
- $7,888 · $657/mo
- Expected delta
- +$3,065/yr (+$255/mo · 63.6%)
ⓘ Screening estimate from a state-policy table — verify with the county assessor before closing.
Nearby sold comps map
Loading sold comps map…
Walkable amenities ~0.75 mi
Loading nearby amenities…
Taxation est. · year 1
- Rental income
- $63,204
- − Mortgage interest
- −$37,642
- − Property taxes
- −$4,823
- − Insurance
- −$3,360
- − Repairs & maintenance
- −$5,056
- − Management
- −$5,056
- − Depreciation
- −$19,549
- Taxable loss
- −$12,283
- Est. tax savings @ 24.0%
- +$2,948
- After-tax cash flow
- $2,408/yr
For passive investors: Depreciation is non-cash, so a rental often shows a tax loss while cash-flowing — sheltering income. Rental losses are passive: they offset passive income freely, and up to $25,000/yr can offset ordinary (W-2) income if you actively participate and your MAGI is under $100k (phasing out to $0 by $150k); unused losses carry forward. On sale, claimed depreciation is recaptured at up to 25%, and gains may owe capital-gains tax (a 1031 exchange can defer both). Figures are a year-1 estimate at your 24.0% rate — not tax advice; consult a CPA.
Schools (NCES district)
- District
- Providence
- NCES district ID
- 4400900
- Math proficiency
- 8% ▼ -4.00%
- Reading proficiency
- 16% ▼ -2.00%
- Median HH income
- $38,197
- Composite
- 10.12/100
- National rank
- #9803
- State rank
- #34 of 39 in RI
Livability — Providence
- Score
- 84/100
- State rank
- #2
- US rank
- #794
Category grades
Schools grade is shown separately in the Schools card above.
Census & demographics
- Census place
- Providence, RI
- County
- Providence County · 548,917 people
- City population
- 212,734
- Metro
- Providence-Warwick, RI-MA
- Population (ZIP)
- 25,012
- Household income
- $62,908
- Rent vs Own
- Severe rent burden
- 1220.0
Population outlook (Providence County) Hauer SSP2
- Today (2025)
- 653,469 people
- By 2030
- 660,819 · +1.1%
- By 2040
- 672,747 · +3.0%
- By 2050
- 683,741 · +4.6%
- By 2075
- 720,435 · +10.2%
- By 2100
- 741,582 · +13.5%
Race, ethnicity, and origin ACS 2023
- Neighborhood character
- Diverse neighborhood (Simpson 0.67)
- Race & ethnicity
- Hispanic / Latino 41% White 38% Black 15% Two or more races 15% Asian 3%
- Hispanic origin (detail)
- Puerto Rican 5% Dominican 30%
- Common ancestry
- Russian 4% Lithuanian 3% Romanian 2%
- Foreign-born
- 30% · Canada, China
- Languages at home
- 57% English-only · Spanish 34% Other Indo-European 4% French/Haitian/Cajun 1%
Political lean MEDSL · Providence
- 2024 margin
- D (+14.4) · D 56.1% · R 41.7% · Other 2.2%
- 2008→2024 swing
- -20.0pp toward R · 2008: 34.4pp · 2024: 14.4pp
- All cycles
- 2024: D+14.4 2020: D+22.9 2016: D+21.2 2012: D+34.9 2008: D+34.4
Not yet ingested
- Civics
- —
Market trends
- HPI YoY
- ▼ -396.84%
- Current HPI
- 387.2525
- Rent YoY
- ▲ 3.45%
- Metro
- Providence-Warwick, RI-MA
- State GDP YoY
- ▲ 2.25%
- F500 in state
- 10
Industry mix (Fortune 500 HQ in RI)
| Industry | F500 HQs | Revenue |
|---|---|---|
| Healthcare | 1 | $373B |
|
||
| Food Distribution | 1 | $31B |
|
||
| Aerospace / Defense | 1 | $14B |
|
||
| Financial Services | 1 | $8B |
|
||
| Consumer Goods | 1 | $4B |
|
||
Price history
1 event — show timeline
- 2026-06-10 Listed $672,000 RIS
Property tax history
+42.6%/yrLatest (2025): $4,823 · -41.4% YoY. Source: county tax records.
Cash-flow waterfall
monthlySold comps — $/sqft
last 12 mo · ≤1 miLoading sold comps…