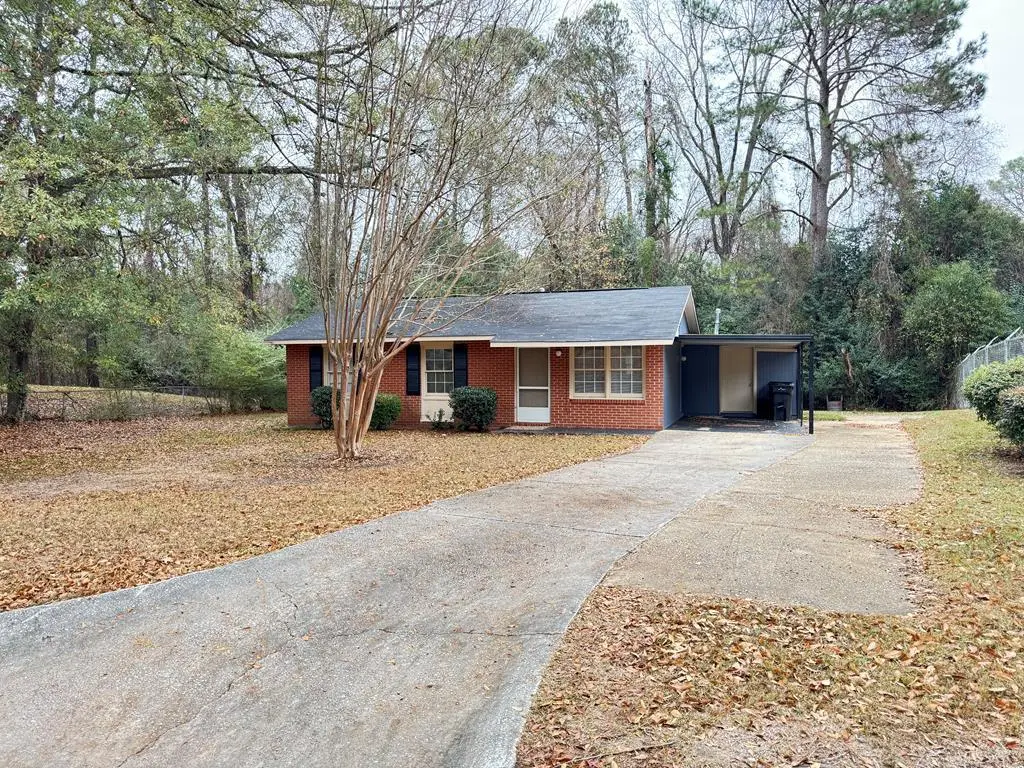
468 Bowen Blvd · Columbus, GA
Flood risk 1/10 · Minimal
- FEMA flood zone
- X (unshaded)
- Chance of flooding over 30 yrs
- 0.0%
- Est. flood insurance / yr
- $507 – $1,088
Fire risk 3/10 · Minor
- Est. fire insurance / yr
- $963 – $1,789
Heat risk 6/10 · Moderate
- Hot days now (above 107°F)
- 7 days/yr
- Hot days in 30 yrs
- 17 days/yr
Wind risk 6/10 · Moderate
- Chance of severe wind over 30 yrs
- 76.0%
Air-quality risk 4/10 · Minor
- Unhealthy air days now
- 5 days/yr
- Unhealthy air days in 30 yrs
- 6 days/yr
Risk factors via First Street. Map © Google.
Why this score? — see what drove the B grade
The composite is a weighted blend of 9 inputs, each scored 0–100. Each bar is that input's sub-score; the figure is the points it added to the 100-point composite (weight × sub-score).
- Cash flow +28.9/30.0
- ARV discount +15.0/15.0
- DSCR +10.0/10.0
- 1% rule +7.9/10.0
- Rent growth +3.7/5.0
- Livability +3.2/5.0
- Condition / age +2.5/5.0
- Schools +2.2/10.0
- Appreciation +0.0/10.0
$99,500
🖨 Deal sheet 📄 Offer letter ✓ Due diligence
Listing remarks MLS
Spacious home in great shape, including large den on back of home with a fantastic backyard with woods behind home.
Key facts
- Large den
- Fantastic backyard
- Woods behind home
Tags
Neighborhood map
What this means for you Summary
Snapshot
- This is a 3-bed/1.0-bath single-family listed at $100k.
Deal economics
- At list price, monthly cash flow is $338 ($4k/yr) — positive.
- The deal already cash-flows at list — no discount required.
- Meets the 1% rule at list price ($1k rent vs $100k).
- Recommended offer: $88k (12.0% below list) — sets the bar for market timing.
- Cap rate 10.4% vs local median 4.7% in Columbus — top-decile yield for the area; either an underpriced asset or a hidden risk that comps aren't pricing in. Stress-test before assuming the spread holds.
Location & tenants
- Location reads 64/100 on livability (#254 in GA) — a middle-class / working-renter tenant base. Strengths: cost of living A+, housing A+, health & safety B; Watch: amenities D+, schools F, crime F.
- Muscogee County (urban): math 21% / reading 30% proficiency, ranked #120 of 174 in GA (top 69%) — low school quality limits family demand, transient renter base, plan for 1-2y turnover; 61% free/reduced lunch — lower-income household profile, screen leases tightly.
- Market conditions: Rents rising fast (+4.8%/yr); 256 active listings in the ZIP; 28 comparable units currently listed for rent nearby; rentals at typical pace (median 21d on market — plan ~3-4 weeks tenant-placement turnaround); 291 units permitted in Muscogee County in 2024 (30 in 5+ unit buildings).
Forward outlook
- Local home prices are declining (-3.0%/yr); year-one equity from $688 of loan paydown is wiped out by about $3k of value loss. Plan a longer hold.
- Muscogee County population projected at +15% by 2050 — modest demand growth; plan on rents tracking national, not racing it.
- At projected returns (-3.0% appreciation + 4.8% rent growth), your $28k cash investment doubles in ~8 years — after that, you're playing with house money.
Negotiation context
- It's been on market 168 days — a 12% lower offer ($88k) is reasonable based on typical stale-listing flexibility.
- 2 sale attempts; this cycle's ask has dropped $16k (13%) from the opening price — seller is motivated, your offer sets the floor, not the list.
Risks & watch-outs
- Climate carrying-cost: major wind risk, 76% chance of damaging wind over 30y; extreme-heat days projected 7→17/yr by 2055 (HVAC capex compounding) — expect insurance premiums to compound above CPI over the hold.
Questions for the listing agent
- It's been on market 168 days. Have you received any prior offers? Is the seller open to a 12% concession, seller financing, or rate buy-down credit?
- Built in 1970 — when were the roof, HVAC, electrical panel, plumbing, and water heater last replaced?
- Why hasn't it sold? Are there any deal-killer items the seller is aware of (foundation, flood, title, zoning, code violations)?
- Is there a deadline driving the sale (1031 exchange, divorce, estate, relocation)? That informs how much negotiation room exists.
- Schools are F-rated, which usually means shorter tenancies and higher turnover. Who's the typical renter profile here, and what's been the actual vacancy rate?
- Crime grade is F in this area — have there been break-ins, vandalism, or insurance claims at this property in the last 3 years? What carrier currently insures it and at what premium?
- What's the average days-on-market for RENTAL listings here right now (not sales)? A rising rental-DOM trend means longer vacancies and softer asking-rent achievability than the comps imply.
- What's the recent tenant-quality profile in this submarket — average credit score on applications, eviction rate, late-payment / NSF rate, and stable-employment percentage? A property-management company in the area should have these aggregated.
- How much new for-sale + rental construction is in the pipeline within 1–3 miles? Heavy new supply typically softens prices + rents 12–24 months out; constrained supply supports both.
Investment metrics
- 1% rule
- 1.29% ✓
- Cap rate
- 10.36%
- Cash-on-cash
- 14.54%
- DSCR
- 1.65
- GRM
- 6.5
CMA / ARV
- ARV (median comp)
- $126,223
- List price
- $99,500
- Delta
- -21.17%
- Verdict
- UNDERPRICED
- Comps
- 20 within 1.0 mi
Show comp detail 12 sales within ~0.75 mi
| Address | Dist | Beds/Ba | Sqft | Sold | Price | $/sf | Match |
|---|---|---|---|---|---|---|---|
| 468 Bowen Blvd | 0.00mi | 3/1.0 | 1,176 (0%) | 1mo | $95,000 | $81 | 99 |
| 5201 Vincent Dr | 0.14mi | 3/2.0 | 1,148 (-2%) | 1mo | $139,900 | $122 | 85 |
| 803 Vista Dr | 0.54mi | 3/2.0 | 1,200 (+2%) | 1mo | $151,500 | $126 | 66 |
| 644 Parkwood Dr | 0.30mi | 4/2.0 (+1) | 1,160 (-1%) | 12mo | $153,400 | $132 | 65 |
| 506 Parkwood Dr | 0.21mi | 3/1.0 | 1,050 (-11%) | 13mo | $120,000 | $114 | 62 |
| 5349 Minnie Lee Dr | 0.23mi | 3/2.0 | 1,042 (-11%) | 9mo | $133,000 | $128 | 58 |
| 719 Wilder Dr | 0.42mi | 3/2.0 | 1,302 (+11%) | 3mo | $235,000 | $180 | 56 |
| 727 Wilder Dr | 0.44mi | 3/2.0 | 1,302 (+11%) | 5mo | $250,000 | $192 | 54 |
| 5003 Shirley Ann Dr | 0.61mi | 4/2.0 (+1) | 1,252 (+6%) | 2mo | $115,000 | $92 | 50 |
| 822 Reaper Ln | 0.52mi | 3/2.0 | 1,312 (+12%) | 5mo | $180,000 | $137 | 49 |
| 763 Corley Dr | 0.66mi | 3/1.5 | 1,300 (+10%) | 8mo | $85,000 | $65 | 43 |
| 750 Corley Dr | 0.62mi | 3/1.5 | 1,332 (+13%) | 10mo | $159,500 | $120 | 38 |
Match score weights: distance 35% · size 25% · config 20% · recency 20%. Top-matched comps best support the ARV.
Projected returns pro-forma
-3.0% appreciation · 4.82% rent growth · sell at horizon
- IRR
- 7.0%
- Equity multiple
- 1.28×
- Total profit
- $7,777
- Equity at exit
- $14,836
- IRR
- 17.9%
- Equity multiple
- 2.60×
- Total profit
- $44,676
- Equity at exit
- $8,603
Cash invested: $27,860 (down + closing). Projections, not guarantees.
Landlord ↔ Tenant lean methodology
- Overall (STATE)
- 90 Strongly Landlord-Friendly
- State Georgia
- 90 Strongly Landlord-Friendly · R+3
- County
- — inherits STATE
- City
- — inherits STATE
ZIP-level market 31907
- Rents YoY
- 4.8%
- Active inventory
- 256
- Price-to-rent
- 6.5×
Monthly cashflow live
- Estimated rent
- $1,281 high interval (Pro) →
- Mortgage (P&I)
- −$522
- Tax from tax record
- −$111 /mo · $1,335/yr
- Insurance
- −$41
- HOA
- −$0
- Vacancy / Maint / Mgmt
- −$269
- Net cashflow
- $338
Break-even live
UW: 25.0% down · 7.5% · 30yr · 1.5% tax · 5.0% vac · 8.0% maint · 8.0% mgmt
Financing live
Cash to close
- Down payment
- $24,875
- Closing costs
- $2,985
- Reserves months
- —
- Total cash needed
- —
Loan-product check · same deal, 3 products live
Conventional
25% down · 7.5% · 30yr
- Down + closing
- —
- Monthly P&I
- —
- Monthly cashflow
- —
- DSCR
- —
- Eligible?
- —
Personal DTI + credit; lowest rate.
DSCR
20% down · 8.5% · 30yr
- Down + closing
- —
- Monthly P&I
- —
- Monthly cashflow
- —
- DSCR
- —
- Eligible?
- —
No personal income docs; deal must DSCR.
Hard money
10% down · 12.0% · 12mo
- Down + closing
- —
- Monthly P&I
- —
- Monthly cashflow
- —
- DSCR
- —
- Eligible?
- —
Short-term bridge; refi at stabilization.
Rent comps 28 comps
| Address | Beds | Baths | Sqft | Rent | $/sqft | DOM | Units | Dist |
|---|---|---|---|---|---|---|---|---|
| 410 Columbia Dr Unit 1 Columbus, GA | 3.0 | 1.5 | 925 | $950 | $1.03 | 21d | 1 | 0.17mi |
| 431 Camden Dr Columbus, GA | 3.0 | 2.0 | 1005 | $1,350 | $1.34 | 21d | 1 | 0.17mi |
| 419 Mount Pleasant Dr Columbus, GA | 3.0 | 1.5 | 1225 | $950 | $0.78 | 13d | 1 | 0.41mi |
| 407 Ocean Ave Columbus, GA | 3.0 | 2.0 | 1319 | $1,595 | $1.21 | 43d | 1 | 0.53mi |
| 5020 Shirley Ann Dr Columbus, GA | 4.0 | 2.5 | 1395 | $1,550 | $1.11 | 13d | 1 | 0.63mi |
| 947 Belvedere Dr Columbus, GA | 3.0 | 2.0 | 1197 | $1,425 | $1.19 | 13d | 1 | 0.71mi |
| 5431 Buena Vista Rd Columbus, GA | 2.0 | 2.0 | 850 | $1,050 | $1.24 | 43d | 1 | 0.72mi |
| 5330 Buena Vista Rd Columbus, GA | 3.0 | 1.0 | 1100 | $995 | $0.90 | 43d | 1 | 0.75mi |
| 527 Englewood Dr Columbus, GA | 3.0 | 2.0 | 1469 | $1,450 | $0.99 | 13d | 1 | 0.78mi |
| 845 Arlington Dr Columbus, GA | 3.0 | 2.0 | 1250 | $850 | $0.68 | 43d | 1 | 0.87mi |
| 5501 Ambervista Ct Columbus, GA | 3.0 | 2.0 | 1402 | $1,375 | $0.98 | 43d | 1 | 0.90mi |
| 441 Braselman Ave Columbus, GA | 3.0 | 1.5 | 1150 | $1,250 | $1.09 | 43d | 1 | 0.95mi |
| 800 Goodson Dr Columbus, GA | 4.0 | 1.0 | 1012 | $1,225 | $1.21 | 21d | 1 | 0.96mi |
| 1029 Amber Dr Columbus, GA | 3.0 | 1.5 | 1053 | $1,300 | $1.23 | 43d | 1 | 1.00mi |
| 5771 Spanish Oak Dr Columbus, GA | 3.0 | 2.0 | 1282 | $1,395 | $1.09 | 21d | 1 | 1.05mi |
| 4464 Sims St Columbus, GA | 3.0 | 1.0 | 1014 | $1,095 | $1.08 | 21d | 1 | 1.09mi |
| 6400 Sandy Bottom Dr Columbus, GA | 3.0 | 2.0 | 1455 | $1,850 | $1.27 | 13d | 1 | 1.12mi |
| 4707 Marino St Columbus, GA | 3.0 | 1.0 | 1054 | $995 | $0.94 | 43d | 1 | 1.13mi |
| 4313 Sims St Columbus, GA | 4.0 | 1.5 | 1309 | $1,400 | $1.07 | 13d | 1 | 1.19mi |
| 1423 Hagan Dr Columbus, GA | 3.0 | 1.0 | 1275 | $1,250 | $0.98 | 21d | 1 | 1.31mi |
| 920 Rosewood Dr Columbus, GA | 4.0 | 1.0 | 1325 | $1,350 | $1.02 | 21d | 1 | 1.36mi |
| 4832 Wellborn Dr Columbus, GA | 3.0 | 2.0 | 1000 | $1,300 | $1.30 | 13d | 1 | 1.37mi |
| 9 Montclair Ct Unit B Columbus, GA | 2.0 | 1.5 | 959 | $950 | $0.99 | 43d | 1 | 1.37mi |
| 4970 Gardiner Dr Columbus, GA | 3.0 | 2.0 | 1412 | $1,400 | $0.99 | 43d | 1 | 1.40mi |
| 5850 Blueridge Dr Columbus, GA | 3.0 | 1.5 | 1120 | $1,200 | $1.07 | 43d | 1 | 1.40mi |
| 5421 Susan Ln Columbus, GA | 3.0 | 1.0 | 1368 | $1,100 | $0.80 | 21d | 1 | 1.47mi |
| 1502 Baker St Columbus, GA | 4.0 | 2.5 | 1225 | $1,300 | $1.06 | 13d | 1 | 1.48mi |
| 3902 N Linden Dr Columbus, GA | 2.0 | 1.0 | 722 | $850 | $1.18 | 13d | 1 | 1.49mi |
Listing history 8 events
-
2026-05-19status Pending 115-char remark
Show marketing remark (115 chars)
Spacious home in great shape, including large den on back of home with a fantastic backyard with woods behind home.
-
2026-04-06price $99,500 115-char remark
Show marketing remark (115 chars)
Spacious home in great shape, including large den on back of home with a fantastic backyard with woods behind home.
-
2026-01-28price $109,000 115-char remark
Show marketing remark (115 chars)
Spacious home in great shape, including large den on back of home with a fantastic backyard with woods behind home.
-
2025-12-04historical $825
-
2025-12-02$115,000 Active 115-char remark
Show marketing remark (115 chars)
Spacious home in great shape, including large den on back of home with a fantastic backyard with woods behind home.
-
2025-10-29price $825
-
2025-10-08price $865
-
2025-08-06$895
ⓘ Source: listings_history table (triggers on properties + properties_extension) + one-shot
backfill from property_details.listing_events for pre-trigger history.
Tax reassessment forecast GA · Resets to sale price
- Current annual tax
- $1,335 · $111/mo
- Projected year-2 tax
- $1,335 · $111/mo
- Expected delta
- $0/yr ($0/mo · 0.0%)
ⓘ Screening estimate from a state-policy table — verify with the county assessor before closing.
Climate risk First Street
- Flood 1/10 Low FEMA zone X (unshaded) · 0% chance over 30 yrs
- Wildfire 3/10 Moderate
- Heat 6/10 Major 7 d/yr ≥107°F today · 17 d/yr by 30 yrs out
- Wind 6/10 Major 76% chance of damaging wind over 30 yrs
- Air quality 4/10 Moderate 5 unhealthy d/yr today · 6 by 30 yrs out
Nearby sold comps map
Loading sold comps map…
Walkable amenities ~0.75 mi
Loading nearby amenities…
Taxation est. · year 1
- Rental income
- $15,374
- − Mortgage interest
- −$5,574
- − Property taxes
- −$1,335
- − Insurance
- −$498
- − Repairs & maintenance
- −$1,230
- − Management
- −$1,230
- − Depreciation
- −$2,895
- Taxable income
- $2,613
- Est. tax owed @ 24.0%
- −$627
- After-tax cash flow
- $3,424/yr
For passive investors: Depreciation is non-cash, so a rental often shows a tax loss while cash-flowing — sheltering income. Rental losses are passive: they offset passive income freely, and up to $25,000/yr can offset ordinary (W-2) income if you actively participate and your MAGI is under $100k (phasing out to $0 by $150k); unused losses carry forward. On sale, claimed depreciation is recaptured at up to 25%, and gains may owe capital-gains tax (a 1031 exchange can defer both). Figures are a year-1 estimate at your 24.0% rate — not tax advice; consult a CPA.
Schools (NCES district)
- District
- Muscogee County
- NCES district ID
- 1303870
- Math proficiency
- 21% ▼ -11.00%
- Reading proficiency
- 30% ▼ -7.00%
- Median HH income
- $41,176
- Composite
- 21.6/100
- National rank
- #8297
- State rank
- #120 of 174 in GA
Livability — Columbus
- Score
- 64/100
- State rank
- #254
- US rank
- #14102
Category grades
Schools grade is shown separately in the Schools card above.
Census & demographics
- Census place
- Columbus, GA
- County
- Muscogee County · 180,764 people
- City population
- 180,764
- Metro
- Columbus, GA-AL
- Population (ZIP)
- 59,110
- Household income
- $54,453
- Rent vs Own
- Severe rent burden
- 2138.0
Population outlook (Muscogee County) Hauer SSP2
- Today (2025)
- 216,729 people
- By 2030
- 224,504 · +3.6%
- By 2040
- 238,318 · +10.0%
- By 2050
- 249,027 · +14.9%
- By 2075
- 264,862 · +22.2%
- By 2100
- 254,786 · +17.6%
Race, ethnicity, and origin ACS 2023
- Neighborhood character
- Majority Black (64%)
- Race & ethnicity
- Black 64% White 22% Two or more races 8% Hispanic / Latino 6% Asian 1%
- Hispanic origin (detail)
- Mexican 2% Puerto Rican 2%
- Common ancestry
- Italian 1% Slovak 1%
- Foreign-born
- 4% · Canada, South Korea
- Languages at home
- 95% English-only · Spanish 3%
Political lean MEDSL · Muscogee
- 2024 margin
- Strong D (+23.4) · D 61.4% · R 38.0%
- 2008→2024 swing
- +3.7pp toward D · 2008: 19.7pp · 2024: 23.4pp
- All cycles
- 2024: D+23.4 2020: D+24.0 2016: D+18.6 2012: D+21.3 2008: D+19.7
Not yet ingested
- Civics
- —
Market trends
- HPI YoY
- ▼ -125.88%
- Current HPI
- 151.74
- Rent YoY
- ▲ 4.82%
- Metro
- Columbus, GA-AL
- State GDP YoY
- ▲ 2.66%
- F500 in state
- 28
Industry mix (Fortune 500 HQ in GA)
| Industry | F500 HQs | Revenue |
|---|---|---|
| Paper / Packaging | 2 | $29B |
|
||
| Retail | 1 | $160B |
|
||
| Transportation / Logistics | 1 | $91B |
|
||
| Airlines | 1 | $62B |
|
||
| Consumer Goods | 1 | $47B |
|
||
| Utilities | 1 | $25B |
|
||
Price history
-13.5% since first listed8 events — show timeline
- 2026-05-19 Pending — CBOR
- 2026-04-06 Price Changed $99,500 CBOR
- 2026-01-28 Price Changed $109,000 CBOR
- 2025-12-04 Rental Removed $825 APPFOLIO
- 2025-12-02 Listed $115,000 CBOR
- 2025-10-29 Price Changed $825 APPFOLIO
- 2025-10-08 Price Changed $865 APPFOLIO
- 2025-08-06 Listed for Rent $895 APPFOLIO
Property tax history
+5.5%/yrLatest (2025): $1,335 · +144.2% YoY. Source: county tax records.
Cash-flow waterfall
monthlySold comps — $/sqft
last 12 mo · ≤1 miLoading sold comps…