6620 301st Street Ct S · Roy, WA
Flood risk 1/10 · Minimal
- FEMA flood zone
- X (unshaded)
- Chance of flooding over 30 yrs
- 0.0%
- Est. flood insurance / yr
- $507 – $1,088
Fire risk 4/10 · Minor
- Est. fire insurance / yr
- $604 – $1,122
Heat risk 3/10 · Minor
- Hot days now (above 87°F)
- 7 days/yr
- Hot days in 30 yrs
- 14 days/yr
Wind risk 1/10 · Minimal
- Chance of severe wind over 30 yrs
- —
Air-quality risk 6/10 · Moderate
- Unhealthy air days now
- 7 days/yr
- Unhealthy air days in 30 yrs
- 9 days/yr
Risk factors via First Street. Map © Google.
Why this score? — see what drove the C grade
The composite is a weighted blend of 9 inputs, each scored 0–100. Each bar is that input's sub-score; the figure is the points it added to the 100-point composite (weight × sub-score).
- Cash flow +20.4/30.0
- ARV discount +15.0/15.0
- DSCR +6.5/10.0
- 1% rule +5.1/10.0
- Schools +4.9/10.0
- Livability +3.1/5.0
- Rent growth +2.5/5.0
- Condition / age +2.5/5.0
- Appreciation +0.0/10.0
$244,950
🖨 Deal sheet (PDF) 📄 Offer letter ✓ Due diligence
Listing remarks
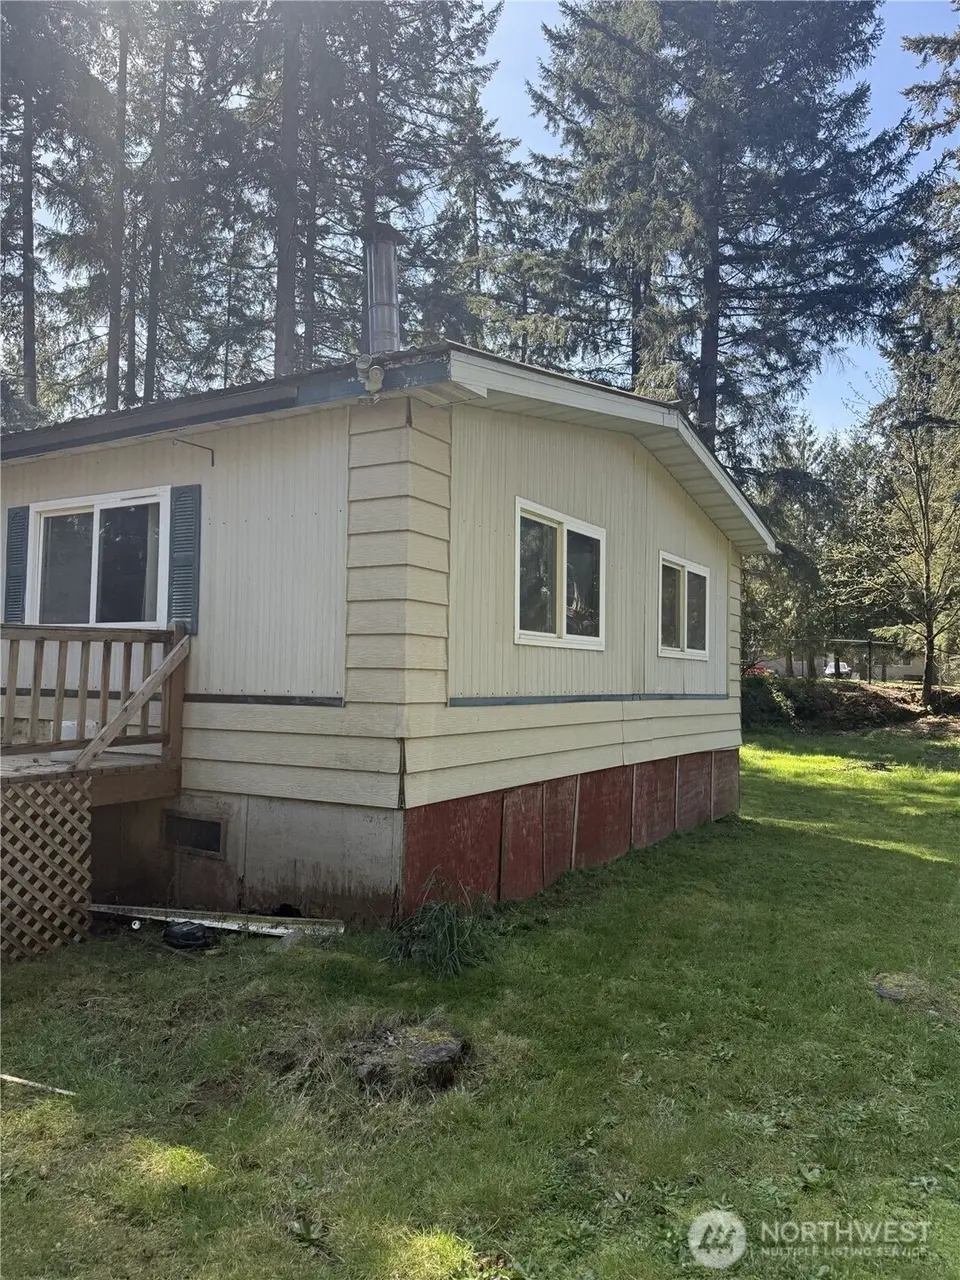
2 Manufactureds on 1 lot! Nestled in the peaceful countryside of Roy, this property at 6620 301st St Ct S offers the perfect blend of privacy and rural charm while still being within convenient reach of nearby amenities. Enjoy easy access to local schools, shopping, and dining in the surrounding areas, with a straightforward commute to Tacoma and Joint Base Lewis-McChord. The spacious setting provides plenty of room for outdoor living, gardening, or recreational use, making it ideal for those seeking a quieter lifestyle. Surrounded by natural beauty, this location is perfect for enjoying the Pacific Northwest’s scenic landscapes. A great opportunity to own a slice of tranquility witho
Key facts
- Commute to tacoma
- Spacious setting
- Outdoor living
Tags
Property features AI
Finance
- Other: Zoning: R10 (county jurisdiction)
- Financial info: Financing available: Cash, Conventional, FHA, VA
Exterior
- Parking: RV parking; No attached garage
- Security: Fully fenced
- Utilities: Electric service; Community water; Septic tank; Power provided by TPU
- Home design: Manufactured home (double wide) on land; One story
- Construction: Metal/vinyl siding; Metal roof; Built in 1982; Manufactured house (double wide)
- Exterior features: Deck; Fully fenced yard; Outbuildings; RV parking; Garden space; Secluded site
Interior
- Bedrooms: 3 bedrooms on the main level
- Flooring: Carpet
- Bathrooms: 2 full bathrooms on the main level
- Heating & cooling: Forced air heating; Forced air cooling
- Interior features: Dining room; No basement
Neighborhood map
What this means for you Summary
Snapshot
- This is a 3-bed/2.0-bath manufactured listed at $245k.
Deal economics
- At list price, monthly cash flow is $317 ($4k/yr) — positive.
- The deal already cash-flows at list — no discount required.
- Meets the 1% rule at list price ($2k rent vs $245k).
- Recommended offer: $238k (3.0% below list) — sets the bar for market timing.
- Cap rate 7.8% vs local median 3.0% in Roy — top-decile yield for the area; either an underpriced asset or a hidden risk that comps aren't pricing in. Stress-test before assuming the spread holds.
Location & tenants
- Location reads 61/100 on livability (#443 in WA) — a middle-class / working-renter tenant base. Strengths: housing A+, employment A-; Watch: crime C-, health & safety C-, amenities F.
- Bethel School District (suburban): math 47% / reading 59% proficiency, ranked #103 of 291 in WA (top 35%) — acceptable for families but not a draw, mixed tenant base, ~2y average lease.
- Zoned schools: Roy Elementary (306 students, 50% FRL); Bethel High School (1,739 students, 53% FRL).
- Market conditions: 106 active listings in the ZIP; 3,209 units permitted in Pierce County in 2024 (1,269 in 5+ unit buildings).
Forward outlook
- Local home prices are declining (-3.0%/yr); year-one equity from $2k of loan paydown is wiped out by about $7k of value loss. Plan a longer hold.
- Pierce County population projected at +26% by 2050 — long-run rental-demand tailwind backs the buy-and-hold thesis.
Negotiation context
- It's been on market 59 days — a 3% lower offer ($238k) is reasonable based on typical stale-listing flexibility.
- 2 sale attempts since 21y ago with the ask held roughly flat each time — persistent listings suggest the price (not the market) is what's stuck; bring a comps-based counter.
- Current owner paid $94k; list at $245k implies a 159% gain — meaningful room to come down on a strong offer.
Questions for the listing agent
- It's been on market 59 days. Have you received any prior offers? Is the seller open to a 3% concession, seller financing, or rate buy-down credit?
- Is there a deadline driving the sale (1031 exchange, divorce, estate, relocation)? That informs how much negotiation room exists.
- What's the average days-on-market for RENTAL listings here right now (not sales)? A rising rental-DOM trend means longer vacancies and softer asking-rent achievability than the comps imply.
- What's the recent tenant-quality profile in this submarket — average credit score on applications, eviction rate, late-payment / NSF rate, and stable-employment percentage? A property-management company in the area should have these aggregated.
- How much new for-sale + rental construction is in the pipeline within 1–3 miles? Heavy new supply typically softens prices + rents 12–24 months out; constrained supply supports both.
Investment metrics
- 1% rule
- 1.01% ✓
- Cap rate
- 7.85%
- Cash-on-cash
- 5.55%
- DSCR
- 1.25
- GRM
- 8.3
CMA / ARV
- ARV (on-the-fly)
- $439,488
- Comps found
- 4
Show comp detail 4 sales within ~0.75 mi
| Address | Dist | Beds/Ba | Sqft | Sold | Price | $/sf | Match |
|---|---|---|---|---|---|---|---|
| 29614 64th Ave S | 0.35mi | 4/2.0 (+1) | 1,404 (+4%) | 12mo | $389,500 | $277 | 61 |
| 7108 294th St S | 0.51mi | 3/2.0 | 1,404 (+4%) | 13mo | $599,950 | $427 | 58 |
| 29704 68th Ave S | 0.32mi | 3/2.0 | 1,507 (+12%) | 11mo | $415,000 | $275 | 56 |
| 7103 294th St S | 0.57mi | 3/2.0 | 1,542 (+15%) | 15mo | $505,000 | $327 | 36 |
Match score weights: distance 35% · size 25% · config 20% · recency 20%. Top-matched comps best support the ARV.
Projected returns pro-forma
-3.0% appreciation · 3.0% rent growth · sell at horizon
- IRR
- -7.7%
- Equity multiple
- 0.72×
- Total profit
- $-19,473
- Equity at exit
- $36,523
- IRR
- 1.9%
- Equity multiple
- 1.13×
- Total profit
- $9,080
- Equity at exit
- $21,179
Cash invested: $68,586 (down + closing). Projections, not guarantees.
Landlord ↔ Tenant lean methodology
- Overall (STATE)
- 28 Tenant-Leaning
- State Washington
- 28 Tenant-Leaning · D+8
- County
- — inherits STATE
- City
- — inherits STATE
ZIP-level market 98580
- Home prices YoY
- -17.1%
- Active inventory
- 106
- Price-to-rent
- 8.3×
Monthly cashflow live
- Estimated rent
- $2,468 medium interval (Pro) →
- Mortgage (P&I)
- −$1,285
- Tax from tax record
- −$246 /mo · $2,950/yr
- Insurance
- −$102
- HOA
- −$0
- Vacancy / Maint / Mgmt
- −$518
- Net cashflow
- $317
Break-even live
Sensitivity live
| Price | -10% $456 | -5% $387 | +0% $317 | +5% $248 | +10% $179 |
|---|---|---|---|---|---|
| Rent | -10% $122 | -5% $220 | +0% $317 | +5% $415 | +10% $512 |
| Rate | -1.0pp $441 | -0.5pp $380 | base $317 | +0.5pp $254 | +1.0pp $189 |
UW: 25.0% down · 7.5% · 30yr · 1.5% tax · 5.0% vac · 8.0% maint · 8.0% mgmt
Financing live
Cash to close
- Down payment
- $61,238
- Closing costs
- $7,348
- Reserves months
- —
- Total cash needed
- —
Loan-product check · same deal, 3 products live
Conventional
25% down · 7.5% · 30yr
- Down + closing
- —
- Monthly P&I
- —
- Monthly cashflow
- —
- DSCR
- —
- Eligible?
- —
Personal DTI + credit; lowest rate.
DSCR
20% down · 8.5% · 30yr
- Down + closing
- —
- Monthly P&I
- —
- Monthly cashflow
- —
- DSCR
- —
- Eligible?
- —
No personal income docs; deal must DSCR.
Hard money
10% down · 12.0% · 12mo
- Down + closing
- —
- Monthly P&I
- —
- Monthly cashflow
- —
- DSCR
- —
- Eligible?
- —
Short-term bridge; refi at stabilization.
Listing history 18 events
-
2026-06-13statusdays on market $244,950 Pending 59 DOM
-
2026-06-10price $244,950 Active 56 DOM
-
2026-06-09days on market $249,950 Active 56 DOM
-
2026-06-08days on market $249,950 Active 55 DOM
-
2026-06-07days on market $249,950 Active 54 DOM
-
2026-06-04days on market $249,950 Active 51 DOM
-
2026-06-03days on market $249,950 Active 50 DOM
-
2026-06-02days on market $249,950 Active 49 DOM
-
2026-06-01days on market $249,950 Active 48 DOM
-
2026-05-31days on market $249,950 Active 47 DOM
-
2026-04-14$249,950 Active
-
2005-12-07soldstatus $94,500
-
2005-12-07soldstatus $94,500
-
2005-10-24$94,500
-
1998-04-03soldstatus $60,000
-
1983-04-27soldstatus $16,950
-
1980-11-01soldstatus $13,450
-
1978-10-03soldstatus $27,000
ⓘ Source: listings_history table (triggers on properties + properties_extension) + one-shot
backfill from property_details.listing_events for pre-trigger history.
Tax reassessment forecast WA · Resets to sale price
- Current annual tax
- $2,950 · $246/mo
- Projected year-2 tax
- $2,950 · $246/mo
- Expected delta
- $0/yr ($0/mo · 0.0%)
ⓘ Screening estimate from a state-policy table — verify with the county assessor before closing.
Climate risk First Street
- Flood 1/10 Low FEMA zone X (unshaded) · 0% chance over 30 yrs
- Wildfire 4/10 Moderate
- Heat 3/10 Moderate 7 d/yr ≥87°F today · 14 d/yr by 30 yrs out
- Wind 1/10 Low
- Air quality 6/10 Major 7 unhealthy d/yr today · 9 by 30 yrs out
Nearby sold comps map
Loading sold comps map…
Walkable amenities ~0.75 mi
Loading nearby amenities…
Taxation est. · year 1
- Rental income
- $29,619
- − Mortgage interest
- −$13,721
- − Property taxes
- −$2,950
- − Insurance
- −$1,225
- − Repairs & maintenance
- −$2,370
- − Management
- −$2,370
- − Depreciation
- −$7,126
- Taxable loss
- −$142
- Est. tax savings @ 24.0%
- +$34
- After-tax cash flow
- $3,844/yr
For passive investors: Depreciation is non-cash, so a rental often shows a tax loss while cash-flowing — sheltering income. Rental losses are passive: they offset passive income freely, and up to $25,000/yr can offset ordinary (W-2) income if you actively participate and your MAGI is under $100k (phasing out to $0 by $150k); unused losses carry forward. On sale, claimed depreciation is recaptured at up to 25%, and gains may owe capital-gains tax (a 1031 exchange can defer both). Figures are a year-1 estimate at your 24.0% rate — not tax advice; consult a CPA.
Schools (NCES district)
- District
- Bethel School District
- NCES district ID
- 5300480
- Math proficiency
- 47% ▬ 0.00%
- Reading proficiency
- 59% ▲ 2.00%
- Median HH income
- $65,872
- Composite
- 48.66/100
- National rank
- #4568
- State rank
- #103 of 291 in WA
Livability — Roy
- Score
- 61/100
- State rank
- #443
- US rank
- #18100
Category grades
Schools grade is shown separately in the Schools card above.
Census & demographics
- Population (ZIP)
- 11,472
Population outlook (Pierce County) Hauer SSP2
- Today (2025)
- 956,648 people
- By 2030
- 1,010,862 · +5.7%
- By 2040
- 1,113,170 · +16.4%
- By 2050
- 1,206,524 · +26.1%
- By 2075
- 1,436,425 · +50.2%
- By 2100
- 1,563,654 · +63.5%
Race, ethnicity, and origin ACS 2023
- Neighborhood character
- Predominantly White (77%)
- Race & ethnicity
- White 77% Two or more races 12% Hispanic / Latino 11% Black 3%
- Hispanic origin (detail)
- Mexican 8% Puerto Rican 2%
- Common ancestry
- Portuguese 5% Italian 4% Romanian 4%
- Foreign-born
- 2% · Canada
- Languages at home
- 96% English-only · Spanish 2% German/W. Germanic 1%
Political lean MEDSL · Pierce
- 2024 margin
- D (+10.8) · D 53.9% · R 43.1% · Other 3.0%
- 2008→2024 swing
- -1.4pp toward R · 2008: 12.2pp · 2024: 10.8pp
- All cycles
- 2024: D+10.8 2020: D+11.2 2016: D+7.5 2012: D+11.0 2008: D+12.2
Not yet ingested
- Civics
- —
Market trends
- HPI YoY
- ▼ -70.93%
- Current HPI
- 344.1901
- Rent YoY
- —
- Metro
- —
- State GDP YoY
- ▲ 4.65%
- F500 in state
- 22
Industry mix (Fortune 500 HQ in WA)
| Industry | F500 HQs | Revenue |
|---|---|---|
| Retail | 2 | $269B |
|
||
| Technology / Retail | 1 | $638B |
|
||
| Technology | 1 | $245B |
|
||
| Telecommunications | 1 | $38B |
|
||
| Food / Beverage | 1 | $36B |
|
||
| Automotive / Trucks | 1 | $34B |
|
||
Price history
+825.7% since first listed8 events — show timeline
- 2026-04-14 Listed $249,950 NWMLS as Distributed by MLS Grid
- 2005-12-07 Sold (Public Records) $94,500 Public Records
- 2005-12-07 Sold (MLS) $94,500 NWMLS as Distributed by MLS Grid
- 2005-10-24 Listed $94,500 NWMLS as Distributed by MLS Grid
- 1998-04-03 Sold (Public Records) $60,000 Public Records
- 1983-04-27 Sold (Public Records) $16,950 Public Records
- 1980-11-01 Sold (Public Records) $13,450 Public Records
- 1978-10-03 Sold (Public Records) $27,000 Public Records
Property tax history
+4.5%/yrLatest (2026): $2,950 · +3.9% YoY. Source: county tax records.
Cash-flow waterfall
monthlySold comps — $/sqft
last 12 mo · ≤1 miLoading sold comps…