304 Paratrooper Ln · Columbia, SC
Flood risk No data
- FEMA flood zone
- —
- Chance of flooding over 30 yrs
- —
- Est. flood insurance / yr
- —
Fire risk No data
- Est. fire insurance / yr
- —
Heat risk No data
- Hot days now (above threshold)
- —
- Hot days in 30 yrs
- —
Wind risk No data
- Chance of severe wind over 30 yrs
- —
Air-quality risk No data
- Unhealthy air days now
- —
- Unhealthy air days in 30 yrs
- —
Risk factors via First Street. Map © Google.
Why this score? — see what drove the D grade
The composite is a weighted blend of 9 inputs, each scored 0–100. Each bar is that input's sub-score; the figure is the points it added to the 100-point composite (weight × sub-score).
- Cash flow +11.9/30.0
- ARV discount +7.5/15.0
- Condition / age +4.0/5.0
- Livability +3.9/5.0
- 1% rule +3.6/10.0
- Schools +3.6/10.0
- DSCR +3.5/10.0
- Rent growth +3.2/5.0
- Appreciation +0.0/10.0
$293,085
🖨 Deal sheet (PDF) 📄 Offer letter ✓ Due diligence
Listing remarks
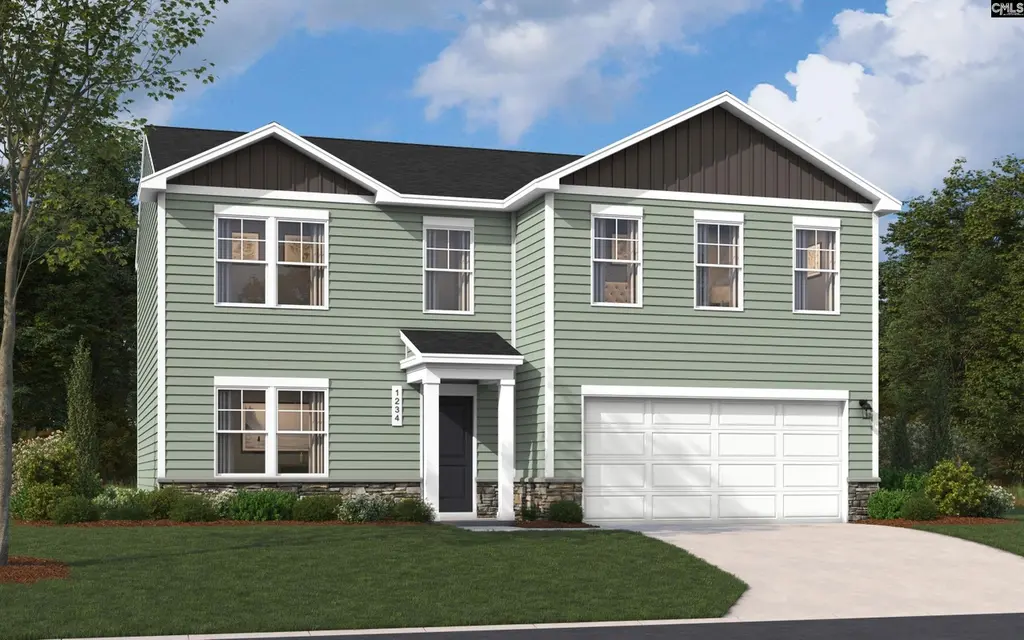
You don't want to miss out on this opportunity! Welcome to The Melrose, the perfect home for those looking for space and comfort. This 2-story home boasts 4 bedrooms and 2.5 bathrooms, providing ample room for everyone to spread out and relax. The main level features a spacious kitchen with an optional island in an open concept living space overlooking the dining and family room. Need a quiet space to work or study? The flex room can be easily transformed into a private study or office. When it's time to retreat for the night, all 4 bedrooms are conveniently located on the upper level, each with a sizeable walk-in closet. Plus, the bedroom-level laundry room also make laundry days a breeze.
Key facts
- Spacious kitchen
- Flex room
- Private study
Tags
Neighborhood map
What this means for you Summary
Snapshot
- This is a 4-bed/2.5-bath single-family listed at $293k. Condition is rated good.
Deal economics
- At list price, monthly cash flow is $-73 ($-874/yr) — negative.
- To cash-flow at today's rent, offer at most $283k (3.6% below list).
- To meet the 1% rule (rent ≥ 1% of price), the offer needs to be $251k (14.3% below list).
- Recommended offer: $251k (14.3% below list) — sets the bar for 1% rule.
Location & tenants
- Location reads 78/100 on livability (#18 in SC, #2,436 nationally) — a middle-class / working-renter tenant base. Strengths: amenities A+, commute A+, cost of living A+; Watch: employment D, crime F.
- Richland 02 (suburban): math 35% / reading 47% proficiency, ranked #29 of 80 in SC (top 36%) — families likely to look elsewhere, expect single-tenant / working-renter base with shorter leases.
- Zoned schools: Pontiac Elementary (math 39% / reading 35%, grade F, #315 of 597 statewide, top 55%, 724 students, 68% FRL); Spring Valley High (math 53% / reading 92%, grade B+, #46 of 196 statewide, top 24%, 2,187 students, 49% FRL) — zoned schools average 58% FRL vs 38% district-wide (20 pts higher); higher-poverty schools than district average — tighter screening recommended.
- Zoned-school proficiency averages 55% at this address vs 41% district-wide (+14 pts) — the actual schools serving this property are materially stronger than the Richland 02 average implies; a family-tenant draw the district grade alone would hide.
- Market conditions: Rents rising (+2.8%/yr); 417 active listings in the ZIP; 4 comparable units currently listed for rent nearby; rentals at typical pace (median 16d on market — plan ~3-4 weeks tenant-placement turnaround); 3,472 units permitted in Richland County in 2024 (1,096 in 5+ unit buildings).
- This rent runs 41% of the median local income ($74k/yr) — at the standard rent-burdened threshold; future hikes will face affordability resistance.
Forward outlook
- Local home prices are declining (-3.0%/yr); year-one equity from $2k of loan paydown is wiped out by about $9k of value loss. Plan a longer hold.
- Richland County population projected at +30% by 2050 — long-run rental-demand tailwind backs the buy-and-hold thesis.
Negotiation context
- Only 8 days on market — expect competitive offers; lowballing is unlikely to land.
- 2 sale attempts with the ask held roughly flat each time — persistent listings suggest the price (not the market) is what's stuck; bring a comps-based counter.
Questions for the listing agent
- What do current leases actually rent for vs. the listed asking? Can we see a recent rent roll and the last 12 months of T-12 income?
- What does the HOA fee cover, when was the last increase, and are there any pending special assessments or reserve-fund shortfalls?
- Is there a deadline driving the sale (1031 exchange, divorce, estate, relocation)? That informs how much negotiation room exists.
- Schools are D-rated, which usually means shorter tenancies and higher turnover. Who's the typical renter profile here, and what's been the actual vacancy rate?
- Crime grade is F in this area — have there been break-ins, vandalism, or insurance claims at this property in the last 3 years? What carrier currently insures it and at what premium?
- The area grade is low — what's the realistic commute time and amenity access for the typical tenant pool here? Any planned neighborhood developments (good or bad) we should know about?
- What's the average days-on-market for RENTAL listings here right now (not sales)? A rising rental-DOM trend means longer vacancies and softer asking-rent achievability than the comps imply.
- What's the recent tenant-quality profile in this submarket — average credit score on applications, eviction rate, late-payment / NSF rate, and stable-employment percentage? A property-management company in the area should have these aggregated.
- How much new for-sale + rental construction is in the pipeline within 1–3 miles? Heavy new supply typically softens prices + rents 12–24 months out; constrained supply supports both.
Investment metrics
- 1% rule
- 0.86% ✗
- Cap rate
- 5.99%
- Cash-on-cash
- -1.07%
- DSCR
- 0.95
- GRM
- 9.7
CMA / ARV
No comps found within radius.
Projected returns pro-forma
-3.0% appreciation · 2.81% rent growth · sell at horizon
- IRR
- -18.2%
- Equity multiple
- 0.36×
- Total profit
- $-52,553
- Equity at exit
- $43,700
- IRR
- -10.9%
- Equity multiple
- 0.35×
- Total profit
- $-53,462
- Equity at exit
- $25,341
Cash invested: $82,064 (down + closing). Projections, not guarantees.
Landlord ↔ Tenant lean methodology
- Overall (STATE)
- 90 Strongly Landlord-Friendly
- State South Carolina
- 90 Strongly Landlord-Friendly · R+6
- County
- — inherits STATE
- City
- — inherits STATE
ZIP-level market 29229
- Home prices YoY
- -21.5%
- Rents YoY
- 2.8%
- Active inventory
- 417
- Price-to-rent
- 9.7×
Monthly cashflow live
- Estimated rent
- $2,512 medium interval (Pro) →
- Mortgage (P&I)
- −$1,537
- Tax est. 1.5%
- −$366 /mo · $4,396/yr
- Insurance
- −$122
- HOA
- −$32
- Vacancy / Maint / Mgmt
- −$528
- Net cashflow
- $-73
Break-even live
Sensitivity live
| Price | -10% $130 | -5% $28 | +0% $-73 | +5% $-174 | +10% $-275 |
|---|---|---|---|---|---|
| Rent | -10% $-271 | -5% $-172 | +0% $-73 | +5% $26 | +10% $126 |
| Rate | -1.0pp $75 | -0.5pp $2 | base $-73 | +0.5pp $-149 | +1.0pp $-226 |
UW: 25.0% down · 7.5% · 30yr · 1.5% tax · 5.0% vac · 8.0% maint · 8.0% mgmt
Financing live
Cash to close
- Down payment
- $73,271
- Closing costs
- $8,793
- Reserves months
- —
- Total cash needed
- —
Loan-product check · same deal, 3 products live
Conventional
25% down · 7.5% · 30yr
- Down + closing
- —
- Monthly P&I
- —
- Monthly cashflow
- —
- DSCR
- —
- Eligible?
- —
Personal DTI + credit; lowest rate.
DSCR
20% down · 8.5% · 30yr
- Down + closing
- —
- Monthly P&I
- —
- Monthly cashflow
- —
- DSCR
- —
- Eligible?
- —
No personal income docs; deal must DSCR.
Hard money
10% down · 12.0% · 12mo
- Down + closing
- —
- Monthly P&I
- —
- Monthly cashflow
- —
- DSCR
- —
- Eligible?
- —
Short-term bridge; refi at stabilization.
Rent comps 4 comps
| Address | Beds | Baths | Sqft | Rent | $/sqft | DOM | Units | Dist |
|---|---|---|---|---|---|---|---|---|
| 837 Peony LN Columbia, SC | 3.0 | 2.5 | 1996 | $2,500 | $1.25 | 23d | 1 | 0.36mi |
| 1102 Semoran Way Columbia, SC | 3.0–4.0 | 2.5 | 1488 | $2,775 | $1.86 | 4d | 16 | 0.69mi |
| 1074 Cornelia St Elgin, SC | 3.0 | 2.5 | 1432 | $1,995 | $1.39 | 5d | 1 | 0.75mi |
| 1315 Montford Dr Elgin, SC | 4.0 | 3.0 | 1959 | $2,300 | $1.17 | 16d | 1 | 0.85mi |
HOA detail
- Monthly dues
- $32 · $384/yr
Listing history 5 events
-
2026-03-27status Pending
-
2026-03-27price $293,085
-
2026-03-26status Active
-
2026-03-26status Pending
-
2026-03-19$292,085 Active
ⓘ Source: listings_history table (triggers on properties + properties_extension) + one-shot
backfill from property_details.listing_events for pre-trigger history.
Nearby sold comps map
Loading sold comps map…
Walkable amenities ~0.75 mi
Loading nearby amenities…
Taxation est. · year 1
- Rental income
- $30,146
- − Mortgage interest
- −$16,417
- − Property taxes
- −$4,396
- − Insurance
- −$1,465
- − Repairs & maintenance
- −$2,412
- − Management
- −$2,412
- − HOA
- −$384
- − Depreciation
- −$8,526
- Taxable loss
- −$5,867
- Est. tax savings @ 24.0%
- +$1,408
- After-tax cash flow
- $534/yr
For passive investors: Depreciation is non-cash, so a rental often shows a tax loss while cash-flowing — sheltering income. Rental losses are passive: they offset passive income freely, and up to $25,000/yr can offset ordinary (W-2) income if you actively participate and your MAGI is under $100k (phasing out to $0 by $150k); unused losses carry forward. On sale, claimed depreciation is recaptured at up to 25%, and gains may owe capital-gains tax (a 1031 exchange can defer both). Figures are a year-1 estimate at your 24.0% rate — not tax advice; consult a CPA.
Condition & rehab AI · 12 photos
This 2-story home is in good condition with a modern and well-maintained interior and exterior. It offers ample space and is ready for new owners to move in and enjoy.
Value-add opportunities
- Both Painting exterior and interior walls — Fresh paint can enhance curb appeal and interior aesthetics.
- Both Landscaping improvements — Enhanced landscaping can improve curb appeal and attract potential buyers/tenants.
- Resale Kitchen appliances — Upgrading to more modern or energy-efficient appliances can increase the home's value.
- Resale Bathroom fixtures — Upgrading to more modern or energy-efficient fixtures can increase the home's value.
- Resale Flooring — Upgrading to more durable or stylish flooring can increase the home's value.
- Both HVAC system — Upgrading to a more energy-efficient HVAC system can improve comfort and reduce energy costs.
- Both Landscaping improvements — Enhanced landscaping can improve curb appeal and attract potential buyers/tenants.
Renovation cost estimate screening
Value-add ROI direction
- Both Painting exterior and interior walls — Fresh paint can enhance curb appeal and interior aesthetics. ↑
- Both Landscaping improvements — Enhanced landscaping can improve curb appeal and attract potential buyers/tenants. ↑
- Resale Kitchen appliances — Upgrading to more modern or energy-efficient appliances can increase the home's value. ↑
- Resale Bathroom fixtures — Upgrading to more modern or energy-efficient fixtures can increase the home's value. ↑
- Resale Flooring — Upgrading to more durable or stylish flooring can increase the home's value. ↑
- Both HVAC system — Upgrading to a more energy-efficient HVAC system can improve comfort and reduce energy costs. ↑
- Both Landscaping improvements — Enhanced landscaping can improve curb appeal and attract potential buyers/tenants. ↑
ⓘ Cost ranges are severity-bucket heuristics (US national rule-of-thumb). Get contractor quotes + a written scope before underwriting a rehab budget.
Schools (NCES district)
- District
- Richland 02
- NCES district ID
- 4503390
- Math proficiency
- 35% ▼ -15.00%
- Reading proficiency
- 47% ▼ -5.00%
- Median HH income
- $59,684
- Composite
- 36.2/100
- National rank
- #4730
- State rank
- #29 of 80 in SC
Livability — Columbia
- Score
- 78/100
- State rank
- #18
- US rank
- #2436
Category grades
Schools grade is shown separately in the Schools card above.
Census & demographics
- Census place
- Columbia, SC
- County
- Richland County · 389,530 people
- City population
- 52,835
- Metro
- Columbia, SC
- Population (ZIP)
- 51,861
- Household income
- $74,043
- Rent vs Own
- Severe rent burden
- 1939.0
Population outlook (Richland County) Hauer SSP2
- Today (2025)
- 459,667 people
- By 2030
- 487,524 · +6.1%
- By 2040
- 542,035 · +17.9%
- By 2050
- 595,371 · +29.5%
- By 2075
- 732,998 · +59.5%
- By 2100
- 820,415 · +78.5%
Race, ethnicity, and origin ACS 2023
- Neighborhood character
- Diverse neighborhood (Simpson 0.56)
- Race & ethnicity
- Black 62% White 24% Hispanic / Latino 8% Two or more races 6% Asian 3%
- Hispanic origin (detail)
- Mexican 2% Puerto Rican 2%
- Common ancestry
- Slovak 1% Lithuanian 1% Romanian 1%
- Foreign-born
- 7% · Canada, South Korea, Jamaica
- Languages at home
- 89% English-only · Spanish 6% Other Indo-European 1% Korean 1%
Political lean MEDSL · Richland
- 2024 margin
- Solid D (+34.6) · D 66.4% · R 31.8% · Other 1.8%
- 2008→2024 swing
- +5.7pp toward D · 2008: 28.9pp · 2024: 34.6pp
- All cycles
- 2024: D+34.6 2020: D+38.3 2016: D+32.9 2012: D+33.3 2008: D+28.9
Not yet ingested
- Civics
- —
Market trends
- HPI YoY
- ▼ -51.11%
- Current HPI
- 186.782
- Rent YoY
- ▲ 2.81%
- Metro
- Columbia, SC
- State GDP YoY
- ▲ 4.51%
- F500 in state
- 2
Industry mix (Fortune 500 HQ in SC)
| Industry | F500 HQs | Revenue |
|---|---|---|
| Packaging | 1 | $7B |
|
||
Price history
+0.3% since first listed5 events — show timeline
- 2026-03-27 Pending — Consolidated MLS
- 2026-03-27 Price Changed $293,085 Consolidated MLS
- 2026-03-26 Relisted — Consolidated MLS
- 2026-03-26 Pending — Consolidated MLS
- 2026-03-19 Listed $292,085 Consolidated MLS
Cash-flow waterfall
monthlySold comps — $/sqft
last 12 mo · ≤1 miLoading sold comps…