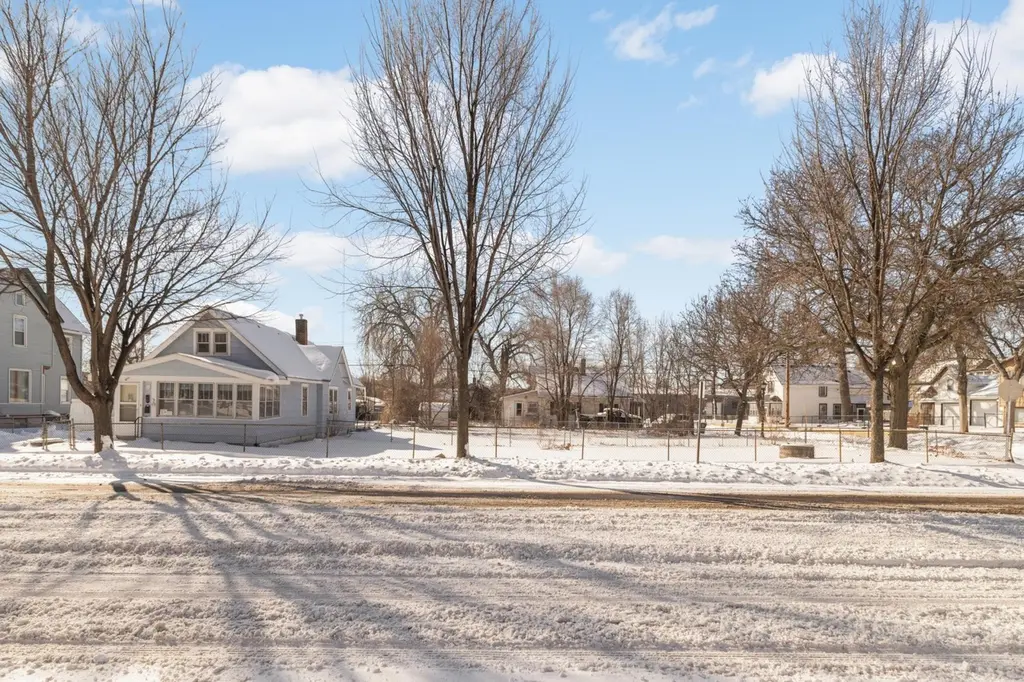
16 Sycamore St E · St. Paul, MN
Flood risk 3/10 · Minor
- FEMA flood zone
- X (unshaded)
- Chance of flooding over 30 yrs
- 0.2%
- Est. flood insurance / yr
- $473 – $860
Fire risk 1/10 · Minimal
- Est. fire insurance / yr
- $888 – $1,650
Heat risk 2/10 · Minimal
- Hot days now (above 99°F)
- 7 days/yr
- Hot days in 30 yrs
- 14 days/yr
Wind risk 2/10 · Minimal
- Chance of severe wind over 30 yrs
- —
Air-quality risk 2/10 · Minimal
- Unhealthy air days now
- 1 days/yr
- Unhealthy air days in 30 yrs
- 1 days/yr
Risk factors via First Street. Map © Google.
Why this score? — see what drove the B- grade
The composite is a weighted blend of 9 inputs, each scored 0–100. Each bar is that input's sub-score; the figure is the points it added to the 100-point composite (weight × sub-score).
- Cash flow +30.0/30.0
- 1% rule +10.0/10.0
- DSCR +10.0/10.0
- ARV discount +7.5/15.0
- Rent growth +3.4/5.0
- Livability +2.5/5.0
- Condition / age +2.5/5.0
- Schools +2.4/10.0
- Appreciation +0.0/10.0
$149,900
🖨 Deal sheet 📄 Offer letter ✓ Due diligence
Listing remarks
Incredible opportunity to own almost a full acre on a corner lot in the city — fully fenced and ready for whatever you can dream up. The spacious 2-car garage is a standout feature, offering serious storage or workshop potential. The home offers 2 bedrooms and 1 bath with a manageable footprint. Priced to move — land and lot size like this don’t come around often.
Key facts
- Fully fenced
- Storage potential
- Workshop potential
Tags
Neighborhood map
What this means for you Summary
Snapshot
- This is a 2-bed/1.0-bath single-family listed at $150k.
Deal economics
- At list price, monthly cash flow is $809 ($10k/yr) — positive.
- The deal already cash-flows at list — no discount required.
- Meets the 1% rule at list price ($2k rent vs $150k).
- Recommended offer: $148k (1.5% below list) — sets the bar for market timing.
Location & tenants
- Location reads: area grade B — affects rentability + tenant quality, not the cash-flow math above.
- St. Paul Public School District (urban): math 21% / reading 33% proficiency, ranked #270 of 301 in MN (top 90%) — low school quality limits family demand, transient renter base, plan for 1-2y turnover; 64% free/reduced lunch — lower-income household profile, screen leases tightly.
- Market conditions: Rents rising (+3.6%/yr); 170 active listings in the ZIP; 10 comparable units currently listed for rent nearby; rentals leasing fast (median 2d on market — plan ~1-2 weeks tenant-placement turnaround); 1,202 units permitted in Ramsey County in 2024 (880 in 5+ unit buildings).
- This rent runs 41% of the median local income ($71k/yr) — at the standard rent-burdened threshold; future hikes will face affordability resistance.
Forward outlook
- Local home prices are declining (-3.0%/yr); year-one equity from $1k of loan paydown is wiped out by about $4k of value loss. Plan a longer hold.
- Ramsey County population projected at +27% by 2050 — long-run rental-demand tailwind backs the buy-and-hold thesis.
- At projected returns (-3.0% appreciation + 3.6% rent growth), your $42k cash investment doubles in ~6 years — after that, you're playing with house money.
Negotiation context
- It's been on market 28 days — a 2% lower offer ($148k) is reasonable based on typical stale-listing flexibility.
Risks & watch-outs
- Watch-outs: built in 1879 — expect roof / HVAC / electrical / plumbing capex.
Questions for the listing agent
- Built in 1879 — when were the roof, HVAC, electrical panel, plumbing, and water heater last replaced?
- Is there a deadline driving the sale (1031 exchange, divorce, estate, relocation)? That informs how much negotiation room exists.
- What's the average days-on-market for RENTAL listings here right now (not sales)? A rising rental-DOM trend means longer vacancies and softer asking-rent achievability than the comps imply.
- What's the recent tenant-quality profile in this submarket — average credit score on applications, eviction rate, late-payment / NSF rate, and stable-employment percentage? A property-management company in the area should have these aggregated.
- How much new for-sale + rental construction is in the pipeline within 1–3 miles? Heavy new supply typically softens prices + rents 12–24 months out; constrained supply supports both.
Investment metrics
- 1% rule
- 1.61% ✓
- Cap rate
- 12.77%
- Cash-on-cash
- 23.12%
- DSCR
- 2.03
- GRM
- 5.2
CMA / ARV
No comps found within radius.
Projected returns pro-forma
-3.0% appreciation · 3.6% rent growth · sell at horizon
- IRR
- 16.9%
- Equity multiple
- 1.69×
- Total profit
- $28,756
- Equity at exit
- $22,351
- IRR
- 25.8%
- Equity multiple
- 3.33×
- Total profit
- $97,731
- Equity at exit
- $12,961
Cash invested: $41,972 (down + closing). Projections, not guarantees.
Landlord ↔ Tenant lean methodology
- Overall (STATE)
- 46 Balanced
- State Minnesota
- 46 Balanced · D+2
- County
- — inherits STATE
- City
- — inherits STATE
ZIP-level market 55117
- Rents YoY
- 3.6%
- Active inventory
- 170
- Price-to-rent
- 5.2×
Monthly cashflow live
- Estimated rent
- $2,406 high interval (Pro) →
- Mortgage (P&I)
- −$786
- Tax from tax record
- −$244 /mo · $2,922/yr
- Insurance
- −$62
- HOA
- −$0
- Vacancy / Maint / Mgmt
- −$505
- Net cashflow
- $809
Break-even live
UW: 25.0% down · 7.5% · 30yr · 1.5% tax · 5.0% vac · 8.0% maint · 8.0% mgmt
Financing live
Cash to close
- Down payment
- $37,475
- Closing costs
- $4,497
- Reserves months
- —
- Total cash needed
- —
Loan-product check · same deal, 3 products live
Conventional
25% down · 7.5% · 30yr
- Down + closing
- —
- Monthly P&I
- —
- Monthly cashflow
- —
- DSCR
- —
- Eligible?
- —
Personal DTI + credit; lowest rate.
DSCR
20% down · 8.5% · 30yr
- Down + closing
- —
- Monthly P&I
- —
- Monthly cashflow
- —
- DSCR
- —
- Eligible?
- —
No personal income docs; deal must DSCR.
Hard money
10% down · 12.0% · 12mo
- Down + closing
- —
- Monthly P&I
- —
- Monthly cashflow
- —
- DSCR
- —
- Eligible?
- —
Short-term bridge; refi at stabilization.
Rent comps 10 comps
| Address | Beds | Baths | Sqft | Rent | $/sqft | DOM | Units | Dist |
|---|---|---|---|---|---|---|---|---|
| 101 10th St E Saint Paul, MN | 3.0 | 1.0–2.0 | 887 | $2,051 | $2.31 | 2d | 25 | 0.95mi |
| 330 9th St E St Paul, MN | 1.0–2.0 | 1.0 | 978 | $2,495 | $2.55 | 3d | 3 | 0.99mi |
| 250 6th St E St Paul, MN | 2.0 | 1.0–2.0 | 980 | $2,868 | $2.93 | 1d | 16 | 1.20mi |
| 240 5th St E St Paul, MN | 2.0 | 1.0–2.0 | 949 | $2,770 | $2.92 | 2d | 10 | 1.26mi |
| 333 Sibley St Saint Paul, MN | 3.0 | 1.0–2.0 | 1358 | $2,577 | $1.90 | 10d | 10 | 1.26mi |
| 141 4th St E Saint Paul, MN | 2.0 | 1.0–2.0 | 811 | $2,420 | $2.98 | 20d | 20 | 1.31mi |
| 253 Kellogg Blvd W Saint Paul, MN | 2.0 | 1.0–2.0 | 1208 | $3,198 | $2.65 | 2d | 12 | 1.34mi |
| 180 E Kellogg Blvd St Paul, MN | 3.0 | 1.0–2.5 | 1436 | $3,467 | $2.41 | 1d | 22 | 1.40mi |
| 111 Kellogg Blvd E Saint Paul, MN | 3.0 | 1.0–2.0 | 1000 | $2,266 | $2.27 | 1d | 20 | 1.40mi |
| 255 Western Ave N Saint Paul, MN | 3.0 | 1.0–2.0 | 1049 | $2,940 | $2.80 | 1d | 23 | 1.41mi |
Listing history 5 events
-
2026-06-08statusdays on market $149,900 Pending 28 DOM
-
2026-06-07statusdays on market $149,900 Active 27 DOM
-
2026-04-13status Pending
-
2026-04-06historical Contingent - Inspection
-
2026-03-20$149,900 Active
ⓘ Source: listings_history table (triggers on properties + properties_extension) + one-shot
backfill from property_details.listing_events for pre-trigger history.
Tax reassessment forecast MN · Partial reset (capped growth)
- Current annual tax
- $2,922 · $244/mo
- Projected year-2 tax
- $2,922 · $244/mo
- Expected delta
- $0/yr ($0/mo · 0.0%)
ⓘ Screening estimate from a state-policy table — verify with the county assessor before closing.
Climate risk First Street
- Flood 3/10 Moderate FEMA zone X (unshaded) · 20% chance over 30 yrs
- Wildfire 1/10 Low
- Heat 2/10 Low 7 d/yr ≥99°F today · 14 d/yr by 30 yrs out
- Wind 2/10 Low
- Air quality 2/10 Low 1 unhealthy d/yr today · 1 by 30 yrs out
Nearby sold comps map
Loading sold comps map…
Walkable amenities ~0.75 mi
Loading nearby amenities…
Taxation est. · year 1
- Rental income
- $28,874
- − Mortgage interest
- −$8,397
- − Property taxes
- −$2,922
- − Insurance
- −$750
- − Repairs & maintenance
- −$2,310
- − Management
- −$2,310
- − Depreciation
- −$4,361
- Taxable income
- $7,825
- Est. tax owed @ 24.0%
- −$1,878
- After-tax cash flow
- $7,828/yr
For passive investors: Depreciation is non-cash, so a rental often shows a tax loss while cash-flowing — sheltering income. Rental losses are passive: they offset passive income freely, and up to $25,000/yr can offset ordinary (W-2) income if you actively participate and your MAGI is under $100k (phasing out to $0 by $150k); unused losses carry forward. On sale, claimed depreciation is recaptured at up to 25%, and gains may owe capital-gains tax (a 1031 exchange can defer both). Figures are a year-1 estimate at your 24.0% rate — not tax advice; consult a CPA.
Schools (NCES district)
- District
- St. Paul Public School District
- NCES district ID
- 2733840
- Math proficiency
- 21% ▼ -11.00%
- Reading proficiency
- 33% ▼ -7.00%
- Median HH income
- $48,316
- Composite
- 23.51/100
- National rank
- #7868
- State rank
- #270 of 301 in MN
Livability — St. Paul
No livability data for this city. (Only ~50 U.S. cities are tracked.)
Census & demographics
- Census place
- St. Paul, MN
- County
- Ramsey County · 542,837 people
- City population
- 280,599
- Metro
- Minneapolis-St. Paul-Bloomington, MN-WI
- Population (ZIP)
- 44,697
- Household income
- $70,771
- Rent vs Own
- Severe rent burden
- 1588.0
Population outlook (Ramsey County) Hauer SSP2
- Today (2025)
- 603,431 people
- By 2030
- 636,459 · +5.5%
- By 2040
- 700,596 · +16.1%
- By 2050
- 765,819 · +26.9%
- By 2075
- 929,297 · +54.0%
- By 2100
- 1,053,924 · +74.7%
Race, ethnicity, and origin ACS 2023
- Neighborhood character
- Highly diverse neighborhood (Simpson 0.72)
- Race & ethnicity
- White 44% Asian 24% Black 15% Hispanic / Latino 10% Two or more races 10%
- Hispanic origin (detail)
- Mexican 7%
- Common ancestry
- Portuguese 6% Romanian 3% Lithuanian 2%
- Foreign-born
- 21% · Canada, Philippines, India
- Languages at home
- 68% English-only · Other Asian/Pacific 15% Spanish 8% Other Indo-European 2%
Political lean MEDSL · Ramsey
- 2024 margin
- Solid D (+43.3) · D 70.5% · R 27.2% · Other 2.3%
- 2008→2024 swing
- +9.4pp toward D · 2008: 33.9pp · 2024: 43.3pp
- All cycles
- 2024: D+43.3 2020: D+45.4 2016: D+39.4 2012: D+35.3 2008: D+33.9
Not yet ingested
- Civics
- —
Market trends
- HPI YoY
- ▼ -308.56%
- Current HPI
- 267.4216
- Rent YoY
- ▲ 3.60%
- Metro
- Minneapolis-St. Paul-Bloomington, MN-WI
- State GDP YoY
- ▲ 2.41%
- F500 in state
- 34
Industry mix (Fortune 500 HQ in MN)
| Industry | F500 HQs | Revenue |
|---|---|---|
| Healthcare | 2 | $407B |
|
||
| Retail | 2 | $150B |
|
||
| Consumer Goods | 2 | $32B |
|
||
| Industrial Machinery | 2 | $6B |
|
||
| Agriculture | 1 | $40B |
|
||
| Healthcare / Medical Devices | 1 | $32B |
|
||
Price history
3 events — show timeline
- 2026-04-13 Pending — NORTHSTARMLS as Distributed by MLS Grid
- 2026-04-06 Contingent — NORTHSTARMLS as Distributed by MLS Grid
- 2026-03-20 Listed $149,900 NORTHSTARMLS as Distributed by MLS Grid
Property tax history
+7.3%/yrLatest (2025): $2,922 · +9.9% YoY. Source: county tax records.
Cash-flow waterfall
monthlySold comps — $/sqft
last 12 mo · ≤1 miLoading sold comps…