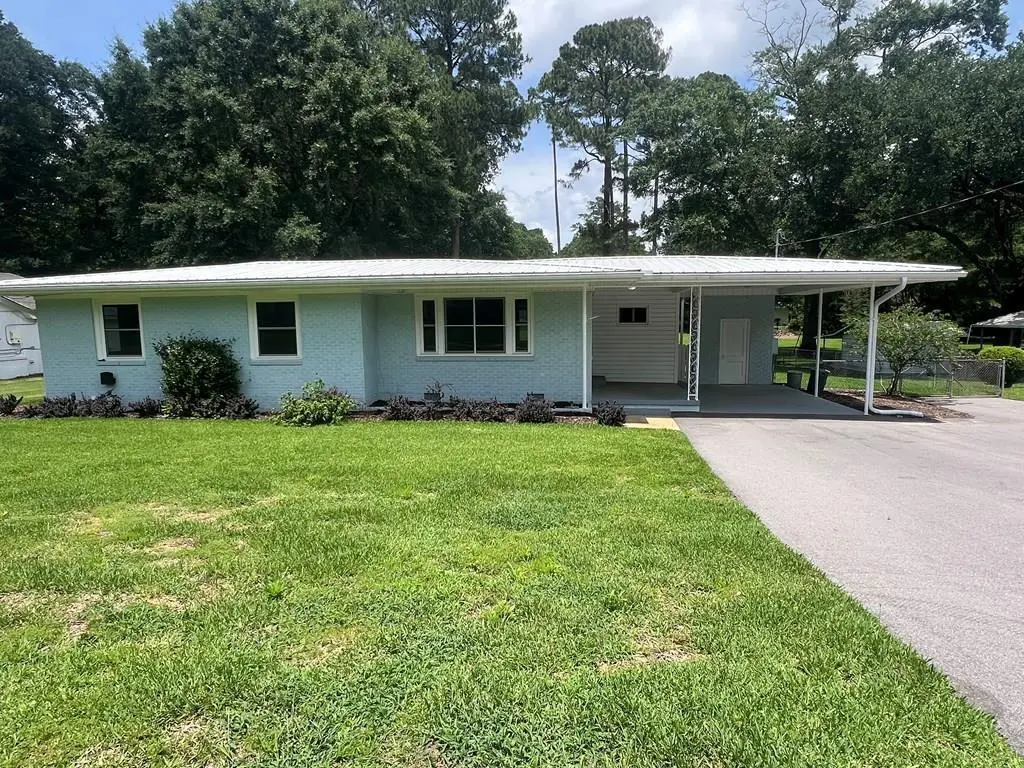
743 Carole St · Laurel, MS
Flood risk 1/10 · Minimal
- FEMA flood zone
- X (unshaded)
- Chance of flooding over 30 yrs
- 0.0%
- Est. flood insurance / yr
- $507 – $1,088
Fire risk 2/10 · Minimal
- Est. fire insurance / yr
- $1,241 – $2,305
Heat risk 8/10 · Major
- Hot days now (above 108°F)
- 7 days/yr
- Hot days in 30 yrs
- 20 days/yr
Wind risk 8/10 · Major
- Chance of severe wind over 30 yrs
- 92.0%
Air-quality risk 1/10 · Minimal
- Unhealthy air days now
- 0 days/yr
- Unhealthy air days in 30 yrs
- 0 days/yr
Risk factors via First Street. Map © Google.
Why this score? — see what drove the C- grade
The composite is a weighted blend of 9 inputs, each scored 0–100. Each bar is that input's sub-score; the figure is the points it added to the 100-point composite (weight × sub-score).
- Cash flow +23.1/30.0
- ARV discount +7.5/15.0
- DSCR +7.4/10.0
- 1% rule +5.4/10.0
- Livability +3.3/5.0
- Rent growth +2.5/5.0
- Condition / age +2.5/5.0
- Schools +1.3/10.0
- Appreciation +0.0/10.0
$169,900
🖨 Deal sheet (PDF) 📄 Offer letter ✓ Due diligence
Listing remarks MLS
NEWLEY RENOVATED-MOVE-IN-READY & GREAT LOCATION 3 Bed 1 Bath home located on large beautiful lot. This home includes new flooring, new paint , new appliances, new fixtures, new cabinets and counter tops. Also included is a large covered patio, carport, built in natural gas generator, and storage shed. In addition, this home is within walking distance to North Laurel Shopping center. A MUST SEE HOME!
Key facts
- Walking park
- Fenced
- Screened porch
Tags
Property features AI
Exterior
- Parking: Attached asphalt parking; 1-car carport
- Security: Security system
- Utilities: Public water
- Home design: Single-story ranch-style residence
- Construction: Brick veneer and vinyl siding exterior; Metal roof; Crawl space foundation; Built as a single-story structure
- Exterior features: Patio; Screened porch
Interior
- Kitchen: Dishwasher; Gas range; Refrigerator
- Bedrooms: 6 total rooms (includes bedrooms and living spaces)
- Bathrooms: 1 full bathroom
- Interior features: Insulated windows; Security system
- Laundry & utility: Washer; Dryer; Gas water heater
Neighborhood map
What this means for you Summary
Snapshot
- This is a 3-bed/1.0-bath single-family listed at $170k.
Deal economics
- At list price, monthly cash flow is $304 ($4k/yr) — positive.
- The deal already cash-flows at list — no discount required.
- Meets the 1% rule at list price ($2k rent vs $170k).
- Recommended offer: $167k (1.5% below list) — sets the bar for market timing.
Location & tenants
- Location reads 66/100 on livability (#92 in MS) — a middle-class / working-renter tenant base. Strengths: cost of living A+, housing A+, health & safety A+; Watch: crime F, commute F, employment F.
- Laurel School District (town): math 16% / reading 18% proficiency, ranked #101 of 130 in MS (top 78%) — low school quality limits family demand, transient renter base, plan for 1-2y turnover; 88% free/reduced lunch — lower-income household profile, screen leases tightly.
- Zoned schools: Mason Elementary School (math 8% / reading 12%, grade F, #319 of 375 statewide, top 88%, 345 students, 100% FRL); Laurel Middle School (math 14% / reading 15%, grade F, #133 of 179 statewide, top 76%, 555 students, 100% FRL); Laurel High School (math 11% / reading 12%, grade F, #166 of 197 statewide, top 85%, 708 students, 100% FRL).
- Market conditions: 134 active listings in the ZIP; 1 comparable units currently listed for rent nearby; 23 units permitted in Jones County in 2024 (5 in 5+ unit buildings).
Forward outlook
- Local home prices are declining (-3.0%/yr); year-one equity from $1k of loan paydown is wiped out by about $5k of value loss. Plan a longer hold.
- Jones County population projected to shrink 4% by 2050 — rents likely to lag national; underwrite the cash flow, not the appreciation.
Negotiation context
- It's been on market 19 days — a 2% lower offer ($167k) is reasonable based on typical stale-listing flexibility.
- 5 sale attempts since 5y ago with the ask held roughly flat each time — persistent listings suggest the price (not the market) is what's stuck; bring a comps-based counter.
Risks & watch-outs
- Watch-outs: built in 1955 — expect roof / HVAC / electrical / plumbing capex.
- Climate carrying-cost: severe wind risk, 92% chance of damaging wind over 30y; extreme-heat days projected 7→20/yr by 2055 (HVAC capex compounding) — expect insurance premiums to compound above CPI over the hold.
Questions for the listing agent
- Built in 1955 — when were the roof, HVAC, electrical panel, plumbing, and water heater last replaced?
- Is there a deadline driving the sale (1031 exchange, divorce, estate, relocation)? That informs how much negotiation room exists.
- Schools are D-rated, which usually means shorter tenancies and higher turnover. Who's the typical renter profile here, and what's been the actual vacancy rate?
- Crime grade is F in this area — have there been break-ins, vandalism, or insurance claims at this property in the last 3 years? What carrier currently insures it and at what premium?
- What's the average days-on-market for RENTAL listings here right now (not sales)? A rising rental-DOM trend means longer vacancies and softer asking-rent achievability than the comps imply.
- What's the recent tenant-quality profile in this submarket — average credit score on applications, eviction rate, late-payment / NSF rate, and stable-employment percentage? A property-management company in the area should have these aggregated.
- How much new for-sale + rental construction is in the pipeline within 1–3 miles? Heavy new supply typically softens prices + rents 12–24 months out; constrained supply supports both.
Investment metrics
- 1% rule
- 1.04% ✓
- Cap rate
- 8.44%
- Cash-on-cash
- 7.68%
- DSCR
- 1.34
- GRM
- 8.0
CMA / ARV
- ARV (on-the-fly)
- $40,356
- Comps found
- 1
Show comp detail 1 sale within ~0.75 mi
| Address | Dist | Beds/Ba | Sqft | Sold | Price | $/sf | Match |
|---|---|---|---|---|---|---|---|
| 607 W 29th St | 0.24mi | 2/1.0 (-1) | 962 (-14%) | 23mo | $35,000 | $36 | 41 |
Match score weights: distance 35% · size 25% · config 20% · recency 20%. Top-matched comps best support the ARV.
Projected returns pro-forma
-3.0% appreciation · 3.0% rent growth · sell at horizon
- IRR
- -4.6%
- Equity multiple
- 0.83×
- Total profit
- $-8,175
- Equity at exit
- $25,333
- IRR
- 5.1%
- Equity multiple
- 1.37×
- Total profit
- $17,730
- Equity at exit
- $14,690
Cash invested: $47,572 (down + closing). Projections, not guarantees.
Landlord ↔ Tenant lean methodology
- Overall (STATE)
- 90 Strongly Landlord-Friendly
- State Mississippi
- 90 Strongly Landlord-Friendly · R+11
- County
- — inherits STATE
- City
- — inherits STATE
ZIP-level market 39440
- Active inventory
- 134
- Price-to-rent
- 8.0×
Monthly cashflow live
- Estimated rent
- $1,761 medium interval (Pro) →
- Mortgage (P&I)
- −$891
- Tax from tax record
- −$125 /mo · $1,501/yr
- Insurance
- −$71
- HOA
- −$0
- Vacancy / Maint / Mgmt
- −$370
- Net cashflow
- $304
Break-even live
Sensitivity live
| Price | -10% $401 | -5% $352 | +0% $304 | +5% $256 | +10% $208 |
|---|---|---|---|---|---|
| Rent | -10% $165 | -5% $235 | +0% $304 | +5% $374 | +10% $443 |
| Rate | -1.0pp $390 | -0.5pp $348 | base $304 | +0.5pp $260 | +1.0pp $216 |
UW: 25.0% down · 7.5% · 30yr · 1.5% tax · 5.0% vac · 8.0% maint · 8.0% mgmt
Financing live
Cash to close
- Down payment
- $42,475
- Closing costs
- $5,097
- Reserves months
- —
- Total cash needed
- —
Loan-product check · same deal, 3 products live
Conventional
25% down · 7.5% · 30yr
- Down + closing
- —
- Monthly P&I
- —
- Monthly cashflow
- —
- DSCR
- —
- Eligible?
- —
Personal DTI + credit; lowest rate.
DSCR
20% down · 8.5% · 30yr
- Down + closing
- —
- Monthly P&I
- —
- Monthly cashflow
- —
- DSCR
- —
- Eligible?
- —
No personal income docs; deal must DSCR.
Hard money
10% down · 12.0% · 12mo
- Down + closing
- —
- Monthly P&I
- —
- Monthly cashflow
- —
- DSCR
- —
- Eligible?
- —
Short-term bridge; refi at stabilization.
Rent comps 1 comps
| Address | Beds | Baths | Sqft | Rent | $/sqft | DOM | Units | Dist |
|---|---|---|---|---|---|---|---|---|
| 3017 Old Amy Rd Laurel, MS | 1.0–3.0 | 1.0–2.0 | 1025 | $1,761 | $1.72 | 15d | 3 | 0.97mi |
Listing history 14 events
-
2026-06-21days on market $169,900 Active 19 DOM
-
2026-06-21days on market $169,900 Active 18 DOM
-
2026-06-18days on market $169,900 Active 16 DOM
-
2026-06-17days on market $169,900 Active 15 DOM
-
2026-06-16days on market $169,900 Active 14 DOM
-
2026-06-15days on market $169,900 Active 13 DOM
-
2026-06-13days on market $169,900 Active 11 DOM
-
2026-06-12days on market $169,900 Active 10 DOM
-
2026-06-09days on market $169,900 Active 7 DOM
-
2026-06-08days on market $169,900 Active 6 DOM
-
2026-06-07days on market $169,900 Active 5 DOM
-
2026-06-05days on market $169,900 Active 3 DOM
-
2026-06-03remarks 308-char remark
-
2026-06-03$169,900 Active 1 DOM
ⓘ Source: listings_history table (triggers on properties + properties_extension) + one-shot
backfill from property_details.listing_events for pre-trigger history.
Tax reassessment forecast MS · Resets to sale price
- Current annual tax
- $1,501 · $125/mo
- Projected year-2 tax
- $1,501 · $125/mo
- Expected delta
- $0/yr ($0/mo · 0.0%)
ⓘ Screening estimate from a state-policy table — verify with the county assessor before closing.
Climate risk First Street
- Flood 1/10 Low FEMA zone X (unshaded) · 0% chance over 30 yrs
- Wildfire 2/10 Low
- Heat 8/10 Severe 7 d/yr ≥108°F today · 20 d/yr by 30 yrs out
- Wind 8/10 Severe 92% chance of damaging wind over 30 yrs
- Air quality 1/10 Low 0 unhealthy d/yr today · 0 by 30 yrs out
Nearby sold comps map
Loading sold comps map…
Walkable amenities ~0.75 mi
Loading nearby amenities…
Taxation est. · year 1
- Rental income
- $21,132
- − Mortgage interest
- −$9,517
- − Property taxes
- −$1,501
- − Insurance
- −$850
- − Repairs & maintenance
- −$1,691
- − Management
- −$1,691
- − Depreciation
- −$4,943
- Taxable income
- $941
- Est. tax owed @ 24.0%
- −$226
- After-tax cash flow
- $3,426/yr
For passive investors: Depreciation is non-cash, so a rental often shows a tax loss while cash-flowing — sheltering income. Rental losses are passive: they offset passive income freely, and up to $25,000/yr can offset ordinary (W-2) income if you actively participate and your MAGI is under $100k (phasing out to $0 by $150k); unused losses carry forward. On sale, claimed depreciation is recaptured at up to 25%, and gains may owe capital-gains tax (a 1031 exchange can defer both). Figures are a year-1 estimate at your 24.0% rate — not tax advice; consult a CPA.
Schools (NCES district)
- District
- Laurel School District
- NCES district ID
- 2802460
- Math proficiency
- 16% ▼ -11.00%
- Reading proficiency
- 18% ▼ -4.00%
- Median HH income
- $28,415
- Composite
- 13.36/100
- National rank
- #9535
- State rank
- #101 of 130 in MS
Livability — Laurel
- Score
- 66/100
- State rank
- #92
- US rank
- #11413
Category grades
Schools grade is shown separately in the Schools card above.
Census & demographics
- Census place
- Laurel, MS
- City population
- 20,111
- Population (ZIP)
- 20,111
Population outlook (Jones County) Hauer SSP2
- Today (2025)
- 68,800 people
- By 2030
- 68,773 · +-0.0%
- By 2040
- 68,087 · -1.0%
- By 2050
- 66,241 · -3.7%
- By 2075
- 58,600 · -14.8%
- By 2100
- 45,744 · -33.5%
Race, ethnicity, and origin ACS 2023
- Neighborhood character
- Majority Black (63%)
- Race & ethnicity
- Black 63% White 30% Hispanic / Latino 6% Two or more races 3% Native American 1%
- Hispanic origin (detail)
- Mexican 5%
- Common ancestry
- Lithuanian 1% Slovak 1% Serbian 1%
- Foreign-born
- 3% · Canada
- Languages at home
- 94% English-only · Spanish 5%
Political lean MEDSL · Jones
- 2024 margin
- Solid R (+46.8) · D 26.2% · R 73.0%
- 2008→2024 swing
- -8.2pp toward R · 2008: -38.6pp · 2024: -46.8pp
- All cycles
- 2024: R+46.8 2020: R+42.2 2016: R+43.6 2012: R+38.2 2008: R+38.6
Not yet ingested
- Civics
- —
Market trends
- HPI YoY
- ▼ -104.63%
- Current HPI
- 126.2541
- Rent YoY
- —
- Metro
- —
- State GDP YoY
- —
- F500 in state
- 0
Price history
+325.8% since first listed9 events — show timeline
- 2026-06-03 Listed $169,900 LBOR
- 2023-02-23 Sold (MLS) — HAAR
- 2023-02-23 Sold (MLS) — HAAR
- 2021-08-26 Sold (MLS) — LBOR
- 2021-08-04 Listed $129,000 LBOR
- 2021-08-04 Listed $129,000 HAAR
- 2021-05-18 Sold (MLS) — LBOR
- 2021-04-01 Listed $39,900 LBOR
- 2021-03-31 Listed $39,900 HAAR
Property tax history
+3.2%/yrLatest (2025): $1,501 · +8.3% YoY. Source: county tax records.
Cash-flow waterfall
monthlySold comps — $/sqft
last 12 mo · ≤1 miLoading sold comps…