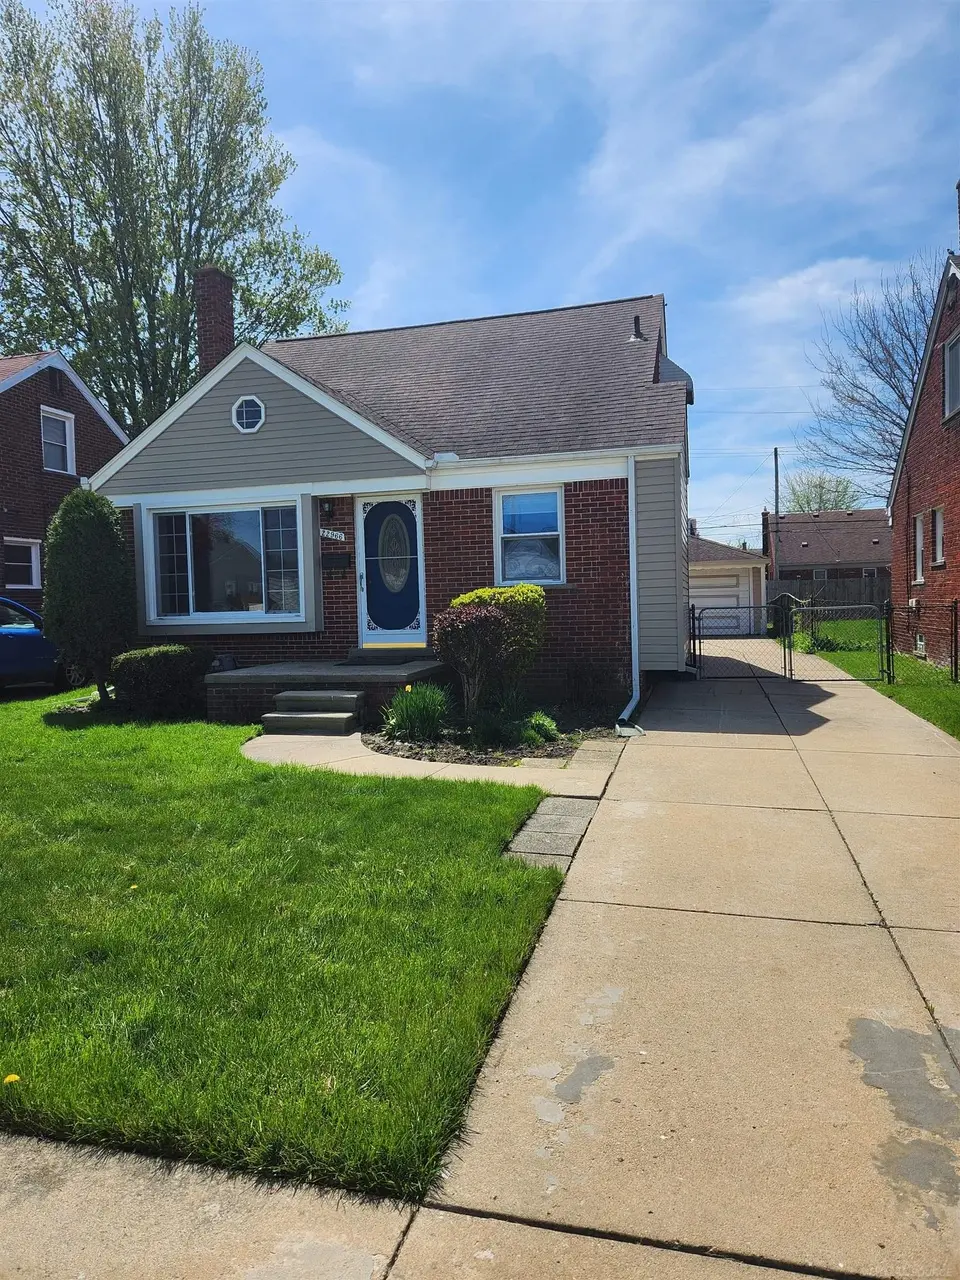
22966 California St · St. Clair Shores, MI
Flood risk 5/10 · Moderate
- FEMA flood zone
- X (unshaded)
- Chance of flooding over 30 yrs
- 0.61%
- Est. flood insurance / yr
- $473 – $860
Fire risk 1/10 · Minimal
- Est. fire insurance / yr
- $784 – $1,456
Heat risk 3/10 · Minor
- Hot days now (above 96°F)
- 7 days/yr
- Hot days in 30 yrs
- 15 days/yr
Wind risk 1/10 · Minimal
- Chance of severe wind over 30 yrs
- —
Air-quality risk 4/10 · Minor
- Unhealthy air days now
- 4 days/yr
- Unhealthy air days in 30 yrs
- 5 days/yr
Risk factors via First Street. Map © Google.
Why this score? — see what drove the D+ grade
The composite is a weighted blend of 9 inputs, each scored 0–100. Each bar is that input's sub-score; the figure is the points it added to the 100-point composite (weight × sub-score).
- Cash flow +15.7/30.0
- ARV discount +15.0/15.0
- DSCR +4.8/10.0
- 1% rule +4.2/10.0
- Rent growth +2.5/5.0
- Livability +2.5/5.0
- Condition / age +2.5/5.0
- Schools +1.7/10.0
- Appreciation +0.0/10.0
$194,900
🖨 Deal sheet 📄 Offer letter ✓ Due diligence
Listing remarks MLS
4 Bedroom brick home in st. Clair shores, what a find. Updated Kitchen w/ Corian counter tops. Ceramic tile bath, updated windows down stairs. Two bedrooms upstairs, 1/2 bath in basement.
Key facts
- 4,356 sq ft lot
- Garage
- Built 1951
Property features AI
Finance
- Other: Above-grade finished area about 1,068 square feet; Below-grade finished area about 200 square feet; Subdivision: ELMWOOD PARK; Cross street: south of 9 Mile, west of Marter
- HOA & community: Homeowners association present
Exterior
- Parking: Detached garage (1.5 car)
- Utilities: Public water; Public sewer
- Home design: Single-family residence; One and one-half story
- Construction: Brick construction
- Exterior features: Front porch; Fenced yard; Lot roughly 40 x 116
Interior
- Kitchen: Dishwasher; Microwave; Oven; Range; Refrigerator
- Bedrooms: Total of 6 rooms (includes bedrooms and living spaces)
- Flooring: Hardwood floors
- Bathrooms: 1 full bathroom
- Heating & cooling: Forced air heating (natural gas); Central air conditioning
- Interior features: Dishwasher; Microwave; Oven; Range; Refrigerator; Gas water heater; Concrete basement
- Laundry & utility: Gas water heater
Neighborhood map
What this means for you Summary
Snapshot
- This is a 3-bed/1.0-bath single-family listed at $195k.
Deal economics
- At list price, monthly cash flow is $84 ($1k/yr) — positive.
- The deal already cash-flows at list — no discount required.
- To meet the 1% rule (rent ≥ 1% of price), the offer needs to be $180k (7.7% below list).
- Recommended offer: $180k (7.7% below list) — sets the bar for 1% rule.
- Cap rate 6.8% vs local median 4.2% in St. Clair Shores — top-decile yield for the area; either an underpriced asset or a hidden risk that comps aren't pricing in. Stress-test before assuming the spread holds.
Location & tenants
- Location reads: area grade D — affects rentability + tenant quality, not the cash-flow math above.
- South Lake Schools (suburban): math 11% / reading 26% proficiency, ranked #470 of 540 in MI (top 87%) — low school quality limits family demand, transient renter base, plan for 1-2y turnover.
- Market conditions: 161 active listings in the ZIP; 14 comparable units currently listed for rent nearby; rentals leasing fast (median 11d on market — plan ~1-2 weeks tenant-placement turnaround); 43% of comp listings sitting > 30 days — soft ceiling on asking rent; 1,321 units permitted in Macomb County in 2024 (86 in 5+ unit buildings).
- This rent runs 32% of the median local income ($67k/yr) — at the standard rent-burdened threshold; future hikes will face affordability resistance.
Forward outlook
- Local home prices are declining (-3.0%/yr); year-one equity from $1k of loan paydown is wiped out by about $6k of value loss. Plan a longer hold.
- Macomb County population projected at +9% by 2050 — modest demand growth; plan on rents tracking national, not racing it.
Negotiation context
- Only 5 days on market — expect competitive offers; lowballing is unlikely to land.
- 5 sale attempts with the ask held roughly flat each time — persistent listings suggest the price (not the market) is what's stuck; bring a comps-based counter.
- Current owner paid $52k; list at $195k implies a 275% gain — meaningful room to come down on a strong offer.
Risks & watch-outs
- Watch-outs: built in 1951 — expect roof / HVAC / electrical / plumbing capex.
- Climate carrying-cost: moderate flood risk — expect insurance premiums to compound above CPI over the hold.
Questions for the listing agent
- Built in 1951 — when were the roof, HVAC, electrical panel, plumbing, and water heater last replaced?
- Is there a deadline driving the sale (1031 exchange, divorce, estate, relocation)? That informs how much negotiation room exists.
- The area grade is low — what's the realistic commute time and amenity access for the typical tenant pool here? Any planned neighborhood developments (good or bad) we should know about?
- What's the average days-on-market for RENTAL listings here right now (not sales)? A rising rental-DOM trend means longer vacancies and softer asking-rent achievability than the comps imply.
- What's the recent tenant-quality profile in this submarket — average credit score on applications, eviction rate, late-payment / NSF rate, and stable-employment percentage? A property-management company in the area should have these aggregated.
- How much new for-sale + rental construction is in the pipeline within 1–3 miles? Heavy new supply typically softens prices + rents 12–24 months out; constrained supply supports both.
Investment metrics
- 1% rule
- 0.92% ✗
- Cap rate
- 6.81%
- Cash-on-cash
- 1.84%
- DSCR
- 1.08
- GRM
- 9.0
CMA / ARV
- ARV (median comp)
- $246,150
- List price
- $194,900
- Delta
- -20.82%
- Verdict
- UNDERPRICED
- Comps
- 20 within 1.0 mi
Show comp detail 12 sales within ~0.75 mi
| Address | Dist | Beds/Ba | Sqft | Sold | Price | $/sf | Match |
|---|---|---|---|---|---|---|---|
| 22417 Maxine St | 0.47mi | 3/1.0 | 1,100 (+3%) | 2mo | $173,900 | $158 | 72 |
| 22118 Elizabeth St | 0.65mi | 3/1.0 | 1,071 (+0%) | 1mo | $124,900 | $117 | 69 |
| 22642 Edgewood St | 0.39mi | 3/1.0 | 986 (-8%) | 3mo | $188,000 | $191 | 67 |
| 22679 Oconnor St | 0.42mi | 3/2.0 | 1,000 (-6%) | 1mo | $197,000 | $197 | 65 |
| 22425 Sunnyside St | 0.56mi | 3/2.0 | 1,100 (+3%) | 0mo | $249,000 | $226 | 65 |
| 22609 Edgewood St | 0.45mi | 3/1.5 | 986 (-8%) | 5mo | $250,000 | $254 | 60 |
| 22401 Gaukler St | 0.49mi | 2/1.0 (-1) | 988 (-8%) | 0mo | $170,000 | $172 | 59 |
| 22033 Alger St | 0.69mi | 3/1.5 | 1,121 (+5%) | 2mo | $240,000 | $214 | 56 |
| 22628 O'connor St | 0.45mi | 3/1.0 | 922 (-14%) | 2mo | $185,000 | $201 | 55 |
| 23280 Clairwood St | 0.69mi | 3/1.5 | 1,158 (+8%) | 6mo | $365,000 | $315 | 47 |
| 1552 Brys Dr | 0.65mi | 2/2.0 (-1) | 988 (-8%) | 3mo | $136,000 | $138 | 45 |
| 22028 Elizabeth St | 0.70mi | 2/1.0 (-1) | 975 (-9%) | 4mo | $139,900 | $143 | 45 |
Match score weights: distance 35% · size 25% · config 20% · recency 20%. Top-matched comps best support the ARV.
Projected returns pro-forma
-3.0% appreciation · 3.0% rent growth · sell at horizon
- IRR
- -13.4%
- Equity multiple
- 0.52×
- Total profit
- $-26,218
- Equity at exit
- $29,060
- IRR
- -4.4%
- Equity multiple
- 0.71×
- Total profit
- $-15,864
- Equity at exit
- $16,851
Cash invested: $54,572 (down + closing). Projections, not guarantees.
Landlord ↔ Tenant lean methodology
- Overall (STATE)
- 62 Landlord-Friendly
- State Michigan
- 62 Landlord-Friendly · EVEN
- County
- — inherits STATE
- City
- — inherits STATE
ZIP-level market 48080
- Active inventory
- 161
- Price-to-rent
- 9.0×
Monthly cashflow live
- Estimated rent
- $1,800 high interval (Pro) →
- Mortgage (P&I)
- −$1,022
- Tax from tax record
- −$235 /mo · $2,816/yr
- Insurance
- −$81
- HOA
- −$0
- Vacancy / Maint / Mgmt
- −$378
- Net cashflow
- $84
Break-even live
UW: 25.0% down · 7.5% · 30yr · 1.5% tax · 5.0% vac · 8.0% maint · 8.0% mgmt
Financing live
Cash to close
- Down payment
- $48,725
- Closing costs
- $5,847
- Reserves months
- —
- Total cash needed
- —
Loan-product check · same deal, 3 products live
Conventional
25% down · 7.5% · 30yr
- Down + closing
- —
- Monthly P&I
- —
- Monthly cashflow
- —
- DSCR
- —
- Eligible?
- —
Personal DTI + credit; lowest rate.
DSCR
20% down · 8.5% · 30yr
- Down + closing
- —
- Monthly P&I
- —
- Monthly cashflow
- —
- DSCR
- —
- Eligible?
- —
No personal income docs; deal must DSCR.
Hard money
10% down · 12.0% · 12mo
- Down + closing
- —
- Monthly P&I
- —
- Monthly cashflow
- —
- DSCR
- —
- Eligible?
- —
Short-term bridge; refi at stabilization.
Rent comps 14 comps
| Address | Beds | Baths | Sqft | Rent | $/sqft | DOM | Units | Dist |
|---|---|---|---|---|---|---|---|---|
| 22617 Oconnor St Saint Clair Shores, MI | 3.0 | 1.0 | 923 | $2,000 | $2.17 | 1d | 1 | 0.51mi |
| 22307 Greater Mack Ave St Clair Shores, MI | 2.0 | 1.0 | 806 | $1,195 | $1.48 | 2d | 1 | 0.59mi |
| 22411 Oconnor St Saint Clair Shores, MI | 2.0 | 1.0 | 950 | $1,250 | $1.32 | 43d | 1 | 0.61mi |
| 22126 Alger St Saint Clair Shores, MI | 2.0 | 1.5 | 1060 | $1,750 | $1.65 | 10d | 1 | 0.64mi |
| 24000 Jefferson Ave Unit 218 St Clair Shores, MI | 2.0 | 2.0 | 1000 | $1,800 | $1.80 | 43d | 1 | 0.88mi |
| 1150 Anita Ave Grosse Pointe Woods, MI | 3.0 | 1.5 | 1129 | $2,600 | $2.30 | 10d | 1 | 0.90mi |
| 218 Riviera Dr St Clair Shores, MI | 2.0 | 2.0 | 1000 | $1,800 | $1.80 | 43d | 1 | 0.90mi |
| 1992 Hawthorne Rd Grosse Pointe Woods, MI | 3.0 | 2.0 | 1071 | $2,100 | $1.96 | 10d | 1 | 1.07mi |
| 401 Northshore Dr St Clair Shores, MI | 2.0 | 1.0–1.5 | 970 | $1,554 | $1.60 | 1d | 4 | 1.13mi |
| 2175 Ridgemont Rd Grosse Pointe Woods, MI | 2.0 | 1.0 | 1100 | $1,300 | $1.18 | 43d | 1 | 1.13mi |
| 20625 Elizabeth St Saint Clair Shores, MI | 3.0 | 2.0 | 1074 | $1,895 | $1.76 | 43d | 1 | 1.15mi |
| 23124 Grove St Saint Clair Shores, MI | 3.0 | 1.0 | 1129 | $2,000 | $1.77 | 1d | 1 | 1.22mi |
| 2037 Vernier Rd Grosse Pointe Woods, MI | 2.0 | 1.0 | 850 | $1,350 | $1.59 | 43d | 1 | 1.24mi |
| 24901 Jefferson Ave Unit 210 St Clair Shores, MI | 2.0 | 1.0 | 700 | $1,300 | $1.86 | 5d | 1 | 1.49mi |
Listing history 19 events
-
2026-06-15statusdays on market $194,900 Pending 5 DOM
-
2026-06-13days on market $194,900 Active 36 DOM
Show marketing remark (187 chars)
4 Bedroom brick home in st. Clair shores, what a find. Updated Kitchen w/ Corian counter tops. Ceramic tile bath, updated windows down stairs. Two bedrooms upstairs, 1/2 bath in basement.
-
2026-06-09days on market $194,900 Active 35 DOM
-
2026-06-08days on market $194,900 Active 34 DOM
-
2026-06-07days on market $194,900 Active 33 DOM
-
2026-06-04days on market $194,900 Active 30 DOM
-
2026-06-03days on market $194,900 Active 29 DOM
-
2026-06-02days on market $194,900 Active 28 DOM
-
2026-06-01days on market $194,900 Active 27 DOM
-
2026-05-31days on market $194,900 Active 26 DOM
-
2026-05-10status Active 187-char remark
Show marketing remark (187 chars)
4 Bedroom brick home in st. Clair shores, what a find. Updated Kitchen w/ Corian counter tops. Ceramic tile bath, updated windows down stairs. Two bedrooms upstairs, 1/2 bath in basement.
-
2026-05-10status Active 187-char remark
Show marketing remark (187 chars)
4 Bedroom brick home in st. Clair shores, what a find. Updated Kitchen w/ Corian counter tops. Ceramic tile bath, updated windows down stairs. Two bedrooms upstairs, 1/2 bath in basement.
-
2026-05-02status Pending 187-char remark
Show marketing remark (187 chars)
4 Bedroom brick home in st. Clair shores, what a find. Updated Kitchen w/ Corian counter tops. Ceramic tile bath, updated windows down stairs. Two bedrooms upstairs, 1/2 bath in basement.
-
2026-05-02status Pending 187-char remark
Show marketing remark (187 chars)
4 Bedroom brick home in st. Clair shores, what a find. Updated Kitchen w/ Corian counter tops. Ceramic tile bath, updated windows down stairs. Two bedrooms upstairs, 1/2 bath in basement.
-
2026-04-27$194,900 Active 187-char remark
Show marketing remark (187 chars)
4 Bedroom brick home in st. Clair shores, what a find. Updated Kitchen w/ Corian counter tops. Ceramic tile bath, updated windows down stairs. Two bedrooms upstairs, 1/2 bath in basement.
-
2026-04-27$194,900 Active 187-char remark
Show marketing remark (187 chars)
4 Bedroom brick home in st. Clair shores, what a find. Updated Kitchen w/ Corian counter tops. Ceramic tile bath, updated windows down stairs. Two bedrooms upstairs, 1/2 bath in basement.
-
1990-11-29soldstatus $52,000
-
1990-06-20soldstatus $40,618
-
1972-08-23soldstatus $24,500
ⓘ Source: listings_history table (triggers on properties + properties_extension) + one-shot
backfill from property_details.listing_events for pre-trigger history.
Tax reassessment forecast MI · Partial reset (capped growth)
- Current annual tax
- $2,816 · $235/mo
- Projected year-2 tax
- $2,909 · $242/mo
- Expected delta
- +$93/yr (+$8/mo · 3.3%)
ⓘ Screening estimate from a state-policy table — verify with the county assessor before closing.
Climate risk First Street
- Flood 5/10 Major FEMA zone X (unshaded) · 61% chance over 30 yrs
- Wildfire 1/10 Low
- Heat 3/10 Moderate 7 d/yr ≥96°F today · 15 d/yr by 30 yrs out
- Wind 1/10 Low
- Air quality 4/10 Moderate 4 unhealthy d/yr today · 5 by 30 yrs out
Nearby sold comps map
Loading sold comps map…
Walkable amenities ~0.75 mi
Loading nearby amenities…
Taxation est. · year 1
- Rental income
- $21,597
- − Mortgage interest
- −$10,917
- − Property taxes
- −$2,816
- − Insurance
- −$974
- − Repairs & maintenance
- −$1,728
- − Management
- −$1,728
- − Depreciation
- −$5,670
- Taxable loss
- −$2,236
- Est. tax savings @ 24.0%
- +$537
- After-tax cash flow
- $1,543/yr
For passive investors: Depreciation is non-cash, so a rental often shows a tax loss while cash-flowing — sheltering income. Rental losses are passive: they offset passive income freely, and up to $25,000/yr can offset ordinary (W-2) income if you actively participate and your MAGI is under $100k (phasing out to $0 by $150k); unused losses carry forward. On sale, claimed depreciation is recaptured at up to 25%, and gains may owe capital-gains tax (a 1031 exchange can defer both). Figures are a year-1 estimate at your 24.0% rate — not tax advice; consult a CPA.
Schools (NCES district)
- District
- South Lake Schools
- NCES district ID
- 2632220
- Math proficiency
- 11% ▼ -10.00%
- Reading proficiency
- 26% ▼ -12.00%
- Median HH income
- $51,594
- Composite
- 16.76/100
- National rank
- #9159
- State rank
- #470 of 540 in MI
Livability — St. Clair Shores
No livability data for this city. (Only ~50 U.S. cities are tracked.)
Census & demographics
- Census place
- St. Clair Shores, MI
- County
- Macomb County · 638,552 people
- City population
- 58,217
- Metro
- Detroit-Warren-Dearborn, MI
- Population (ZIP)
- 21,561
- Household income
- $66,986
- Rent vs Own
- Severe rent burden
- 530.0
Population outlook (Macomb County) Hauer SSP2
- Today (2025)
- 925,296 people
- By 2030
- 948,226 · +2.5%
- By 2040
- 983,961 · +6.3%
- By 2050
- 1,010,200 · +9.2%
- By 2075
- 1,076,222 · +16.3%
- By 2100
- 1,077,065 · +16.4%
Race, ethnicity, and origin ACS 2023
- Neighborhood character
- Predominantly White (83%)
- Race & ethnicity
- White 83% Black 8% Two or more races 6% Hispanic / Latino 4% Asian 2%
- Common ancestry
- Romanian 14% Lithuanian 5% Slovak 2%
- Foreign-born
- 6% · Canada, Jamaica
- Languages at home
- 92% English-only · Other Indo-European 3% Spanish 2% Russian/Polish/Slavic 1%
Political lean MEDSL · Macomb
- 2024 margin
- R (+13.7) · D 42.2% · R 55.9% · Other 1.9%
- 2008→2024 swing
- -22.3pp toward R · 2008: 8.6pp · 2024: -13.7pp
- All cycles
- 2024: R+13.7 2020: R+8.1 2016: R+11.6 2012: D+4.0 2008: D+8.6
Not yet ingested
- Civics
- —
Market trends
- HPI YoY
- ▼ -236.99%
- Current HPI
- 231.507
- Rent YoY
- —
- Metro
- Detroit-Warren-Dearborn, MI
- State GDP YoY
- ▲ 1.37%
- F500 in state
- 28
Industry mix (Fortune 500 HQ in MI)
| Industry | F500 HQs | Revenue |
|---|---|---|
| Automotive Parts | 3 | $48B |
|
||
| Automotive | 2 | $372B |
|
||
| Chemicals | 1 | $45B |
|
||
| Automotive Retail | 1 | $29B |
|
||
| Healthcare / Medical Devices | 1 | $23B |
|
||
| Automotive Technology | 1 | $20B |
|
||
Price history
+695.5% since first listed13 events — show timeline
- 2026-06-14 Pending — REALCOMP
- 2026-06-13 Pending — MiRealSource-MiMLS
- 2026-06-13 Relisted — MiRealSource-MiMLS
- 2026-06-10 Listing Removed — MiRealSource-MiMLS
- 2026-05-10 Relisted — REALCOMP
- 2026-05-10 Relisted — MiRealSource-MiMLS
- 2026-05-02 Pending — REALCOMP
- 2026-05-02 Pending — MiRealSource-MiMLS
- 2026-04-27 Listed $194,900 REALCOMP
- 2026-04-27 Listed $194,900 MiRealSource-MiMLS
- 1990-11-29 Sold (Public Records) $52,000 Public Records
- 1990-06-20 Sold (Public Records) $40,618 Public Records
- 1972-08-23 Sold (Public Records) $24,500 Public Records
Property tax history
+4.7%/yrLatest (2025): $2,816 · +4.8% YoY. Source: county tax records.
Cash-flow waterfall
monthlySold comps — $/sqft
last 12 mo · ≤1 miLoading sold comps…