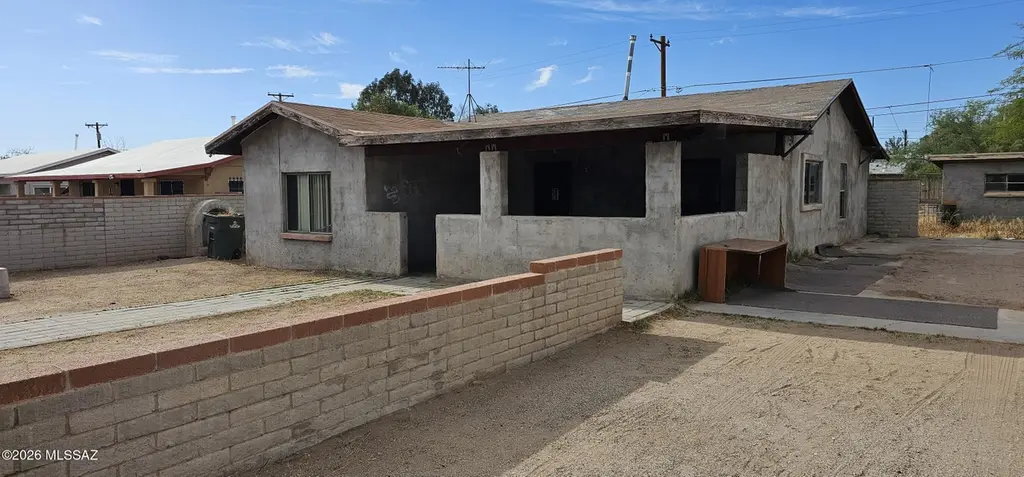
3265 E 24th St · Tucson, AZ
Flood risk 1/10 · Minimal
- FEMA flood zone
- X (unshaded)
- Chance of flooding over 30 yrs
- 0.0%
- Est. flood insurance / yr
- $507 – $1,088
Fire risk 2/10 · Minimal
- Est. fire insurance / yr
- $610 – $1,132
Heat risk 8/10 · Major
- Hot days now (above 105°F)
- 7 days/yr
- Hot days in 30 yrs
- 19 days/yr
Wind risk 1/10 · Minimal
- Chance of severe wind over 30 yrs
- —
Air-quality risk 1/10 · Minimal
- Unhealthy air days now
- 0 days/yr
- Unhealthy air days in 30 yrs
- 0 days/yr
Risk factors via First Street. Map © Google.
Why this score? — see what drove the B- grade
The composite is a weighted blend of 9 inputs, each scored 0–100. Each bar is that input's sub-score; the figure is the points it added to the 100-point composite (weight × sub-score).
- Cash flow +30.0/30.0
- DSCR +10.0/10.0
- 1% rule +8.3/10.0
- ARV discount +7.5/15.0
- Livability +3.7/5.0
- Rent growth +2.6/5.0
- Condition / age +2.5/5.0
- Schools +1.6/10.0
- Appreciation +0.0/10.0
$105,000
🖨 Deal sheet 📄 Offer letter ✓ Due diligence
Listing remarks
Major Fixer-upper deal! Offers will be reviewed at or above asking price only. This is an extensive project with all systems of the house either missing, damaged or in need of repair. The property appears to have been a 3 bedroom in past, but one of the walls was removed so it is now a 2bedroom layout. Excellent equity potential for an investor or DIY owner. Offers due June 1st at 10am. Cash or hard money loan only (no financing).
Key facts
- 7,013 sq ft lot
- Built 1946
- Listed 11 days
Property features AI
Exterior
- Utilities: Public water; Sewer connected
- Home design: Single-family residence; One story
- Construction: Block construction; Shingle roof; Built recently (year not provided)
- Exterior features: Chain link fencing; Paved road access; Subdivided lot
Interior
- Flooring: Ceramic tile
- Bathrooms: 1 full bathroom
- Interior features: Ceramic tile flooring; Dedicated laundry room
- Laundry & utility: Laundry room
Neighborhood map
What this means for you Summary
Snapshot
- This is a 2-bed/1.0-bath single-family listed at $105k.
Deal economics
- At list price, monthly cash flow is $411 ($5k/yr) — positive.
- The deal already cash-flows at list — no discount required.
- Meets the 1% rule at list price ($1k rent vs $105k).
- Cap rate 11.0% vs local median 3.7% in Tucson — top-decile yield for the area; either an underpriced asset or a hidden risk that comps aren't pricing in. Stress-test before assuming the spread holds.
Location & tenants
- Location reads 74/100 on livability (#17 in AZ, #4,502 nationally) — a middle-class / working-renter tenant base. Strengths: commute A+, cost of living A+, housing A+; Watch: health & safety C-, crime F, employment D-.
- Tucson Unified District (4403) (urban): math 14% / reading 23% proficiency, ranked #190 of 249 in AZ (top 76%) — low school quality limits family demand, transient renter base, plan for 1-2y turnover.
- Zoned schools: Robison Elementary School (math 12% / reading 22%, grade F, #814 of 1,109 statewide, top 76%, 265 students, 76% FRL); Mansfeld Middle Magnet School (math 14% / reading 26%, grade F, #127 of 218 statewide, top 60%, 817 students, 60% FRL); Tucson Magnet High School (math 16% / reading 22%, grade F, #240 of 381 statewide, top 63%, 3,162 students, 52% FRL) — zoned schools at 63% FRL track the district average.
- Market conditions: Rents flat; 264 active listings in the ZIP; 40 comparable units currently listed for rent nearby; rentals at typical pace (median 24d on market — plan ~3-4 weeks tenant-placement turnaround); 5,268 units permitted in Pima County in 2024 (996 in 5+ unit buildings).
- This rent runs 31% of the median local income ($53k/yr) — at the standard rent-burdened threshold; future hikes will face affordability resistance.
Forward outlook
- Local home prices are declining (-3.0%/yr); year-one equity from $726 of loan paydown is wiped out by about $3k of value loss. Plan a longer hold.
- Pima County population projected at +8% by 2050 — modest demand growth; plan on rents tracking national, not racing it.
- At projected returns (-3.0% appreciation + 0.2% rent growth), your $29k cash investment doubles in ~10 years — after that, you're playing with house money.
Negotiation context
- Only 11 days on market — expect competitive offers; lowballing is unlikely to land.
Risks & watch-outs
- Watch-outs: built in 1946 — expect roof / HVAC / electrical / plumbing capex.
- Climate carrying-cost: extreme-heat days projected 7→19/yr by 2055 (HVAC capex compounding) — expect insurance premiums to compound above CPI over the hold.
Questions for the listing agent
- Built in 1946 — when were the roof, HVAC, electrical panel, plumbing, and water heater last replaced?
- Is there a deadline driving the sale (1031 exchange, divorce, estate, relocation)? That informs how much negotiation room exists.
- Schools are D-rated, which usually means shorter tenancies and higher turnover. Who's the typical renter profile here, and what's been the actual vacancy rate?
- Crime grade is F in this area — have there been break-ins, vandalism, or insurance claims at this property in the last 3 years? What carrier currently insures it and at what premium?
- What's the average days-on-market for RENTAL listings here right now (not sales)? A rising rental-DOM trend means longer vacancies and softer asking-rent achievability than the comps imply.
- What's the recent tenant-quality profile in this submarket — average credit score on applications, eviction rate, late-payment / NSF rate, and stable-employment percentage? A property-management company in the area should have these aggregated.
- How much new for-sale + rental construction is in the pipeline within 1–3 miles? Heavy new supply typically softens prices + rents 12–24 months out; constrained supply supports both.
Investment metrics
- 1% rule
- 1.33% ✓
- Cap rate
- 10.98%
- Cash-on-cash
- 16.76%
- DSCR
- 1.75
- GRM
- 6.3
CMA / ARV
- ARV (on-the-fly)
- $245,140
- Comps found
- 12
Show comp detail 12 sales within ~0.75 mi
| Address | Dist | Beds/Ba | Sqft | Sold | Price | $/sf | Match |
|---|---|---|---|---|---|---|---|
| 3265 E 24th St | 0.00mi | 2/1.0 | 1,030 (0%) | 0mo | $139,000 | $135 | 100 |
| 3142 E 24th St | 0.16mi | 3/1.0 (+1) | 1,002 (-3%) | 9mo | $250,000 | $250 | 76 |
| 3312 E 27th St | 0.20mi | 2/1.0 | 929 (-10%) | 7mo | $200,000 | $215 | 69 |
| 1821 S Chrysler Ave | 0.64mi | 3/1.0 (+1) | 1,030 (0%) | 4mo | $245,000 | $238 | 62 |
| 2601 E Warwick Vis | 0.65mi | 3/1.0 (+1) | 1,025 (-0%) | 3mo | $269,000 | $262 | 61 |
| 3702 E Juarez St | 0.55mi | 2/1.0 | 1,100 (+7%) | 8mo | $190,000 | $173 | 57 |
| 2827 E 20th St | 0.53mi | 2/1.0 | 942 (-8%) | 6mo | $241,000 | $256 | 56 |
| 1923 S Holly Sv Stra | 0.51mi | 3/1.0 (+1) | 1,150 (+12%) | 2mo | $269,000 | $234 | 50 |
| 1934 S Holly Stra | 0.50mi | 2/1.0 | 894 (-13%) | 6mo | $212,000 | $237 | 50 |
| 2108 S Hemlock Stra | 0.61mi | 2/2.0 | 924 (-10%) | 2mo | $240,000 | $260 | 49 |
| 2961 E 30th St | 0.50mi | 2/1.0 | 881 (-14%) | 7mo | $230,000 | $261 | 47 |
| 3738 E Garden St | 0.67mi | 3/2.0 (+1) | 975 (-5%) | 8mo | $220,000 | $226 | 44 |
Match score weights: distance 35% · size 25% · config 20% · recency 20%. Top-matched comps best support the ARV.
Projected returns pro-forma
-3.0% appreciation · 0.21% rent growth · sell at horizon
- IRR
- 4.8%
- Equity multiple
- 1.18×
- Total profit
- $5,324
- Equity at exit
- $15,656
- IRR
- 11.6%
- Equity multiple
- 1.80×
- Total profit
- $23,528
- Equity at exit
- $9,078
Cash invested: $29,400 (down + closing). Projections, not guarantees.
Landlord ↔ Tenant lean methodology
- Overall (STATE)
- 87 Strongly Landlord-Friendly
- State Arizona
- 87 Strongly Landlord-Friendly · R+3
- County
- — inherits STATE
- City
- — inherits STATE
ZIP-level market 85713
- Home prices YoY
- -24.5%
- Rents YoY
- 0.2%
- Active inventory
- 264
- Price-to-rent
- 6.3×
Monthly cashflow live
- Estimated rent
- $1,394 high interval (Pro) →
- Mortgage (P&I)
- −$551
- Tax from tax record
- −$96 /mo · $1,156/yr
- Insurance
- −$44
- HOA
- −$0
- Vacancy / Maint / Mgmt
- −$293
- Net cashflow
- $411
Break-even live
UW: 25.0% down · 7.5% · 30yr · 1.5% tax · 5.0% vac · 8.0% maint · 8.0% mgmt
Financing live
Cash to close
- Down payment
- $26,250
- Closing costs
- $3,150
- Reserves months
- —
- Total cash needed
- —
Loan-product check · same deal, 3 products live
Conventional
25% down · 7.5% · 30yr
- Down + closing
- —
- Monthly P&I
- —
- Monthly cashflow
- —
- DSCR
- —
- Eligible?
- —
Personal DTI + credit; lowest rate.
DSCR
20% down · 8.5% · 30yr
- Down + closing
- —
- Monthly P&I
- —
- Monthly cashflow
- —
- DSCR
- —
- Eligible?
- —
No personal income docs; deal must DSCR.
Hard money
10% down · 12.0% · 12mo
- Down + closing
- —
- Monthly P&I
- —
- Monthly cashflow
- —
- DSCR
- —
- Eligible?
- —
Short-term bridge; refi at stabilization.
Rent comps 40 comps
| Address | Beds | Baths | Sqft | Rent | $/sqft | DOM | Units | Dist |
|---|---|---|---|---|---|---|---|---|
| 3331 E 24th St Tucson, AZ | 2.0 | 1.0 | 1072 | $1,400 | $1.31 | 43d | 1 | 0.10mi |
| 2002 S Kelvin Stra Tucson, AZ | 2.0 | 1.0 | 1374 | $1,595 | $1.16 | 21d | 1 | 0.52mi |
| 2714 E 21st St Unit A Tucson, AZ | 3.0 | 2.0 | 1496 | $1,999 | $1.34 | 43d | 1 | 0.54mi |
| 2011 S Kelvin Stra Tucson, AZ | 3.0 | 1.0 | 1167 | $1,600 | $1.37 | 23d | 1 | 0.55mi |
| 3661 E Sylvane St Tucson, AZ | 3.0 | 1.0 | 877 | $1,350 | $1.54 | 43d | 1 | 0.64mi |
| 2718 E 18th St Tucson, AZ | 2.0 | 1.0 | 1254 | $1,695 | $1.35 | 23d | 1 | 0.67mi |
| 3762 E 22nd St Unit B Tucson, AZ | 3.0 | 1.5 | 1221 | $1,695 | $1.39 | 11d | 1 | 0.70mi |
| 3764 E 27th Pl Tucson, AZ | 3.0 | 1.0 | 1049 | $1,495 | $1.43 | 11d | 1 | 0.74mi |
| 3659 E Ellington Pl Tucson, AZ | 2.0 | 1.0 | 870 | $1,000 | $1.15 | 11d | 1 | 0.74mi |
| 2512 E Eastland St Tucson, AZ | 2.0 | 1.0 | 800 | $1,250 | $1.56 | 43d | 1 | 0.78mi |
| 1727 S Winstel Ave Tucson, AZ | 3.0 | 1.0 | 1003 | $1,595 | $1.59 | 43d | 1 | 0.79mi |
| 725 S Tucson Blvd Tucson, AZ | 2.0 | 1.0 | 538 | $1,430 | $2.66 | 43d | 1 | 0.84mi |
| 2151 S Winstel Ave Tucson, AZ | 2.0 | 1.0 | 900 | $825 | $0.92 | 23d | 1 | 0.92mi |
| 2355 E 17th St Tucson, AZ | 2.0 | 1.0 | 850 | $1,375 | $1.62 | 3d | 1 | 0.94mi |
| 1902 S Montezuma Ave Unit D Tucson, AZ | 2.0 | 1.0 | 780 | $995 | $1.28 | 43d | 1 | 0.96mi |
| 1902 S Montezuma Ave Unit C Tucson, AZ | 2.0 | 2.0 | 900 | $1,295 | $1.44 | 17d | 1 | 0.96mi |
| 1926 S Montezuma Ave #1932 Tucson, AZ | 2.0 | 1.0 | 780 | $895 | $1.15 | 23d | 1 | 0.99mi |
| 2825 E Manchester St Tucson, AZ | 3.0 | 1.0 | 1419 | $3,000 | $2.11 | 43d | 1 | 1.05mi |
| 4038 E 17th St Tucson, AZ | 3.0 | 2.0 | 1045 | $1,700 | $1.63 | 3d | 1 | 1.05mi |
| 333 S Alvernon Way #60 Tucson, AZ | 2.0 | 1.0 | 1080 | $1,975 | $1.83 | 43d | 1 | 1.10mi |
| 1841 S Irving Ave Unit 13 Tucson, AZ | 2.0 | 1.0 | 900 | $675 | $0.75 | 17d | 1 | 1.13mi |
| 3991 E Timrod St Tucson, AZ | 1.0 | 1.0 | 850 | $1,450 | $1.71 | 2d | 1 | 1.14mi |
| 2520 E Cameron Vis Tucson, AZ | 3.0 | 1.0 | 731 | $1,150 | $1.57 | 43d | 1 | 1.19mi |
| 3940 E Timrod St Unit 267 Tucson, AZ | 2.0 | 2.0 | 1371 | $2,000 | $1.46 | 14d | 1 | 1.22mi |
| 455 S Irving Ave Tucson, AZ | 2.0 | 2.0 | 825 | $995 | $1.21 | 43d | 1 | 1.22mi |
| 1852 S Norris Ave Tucson, AZ | 3.0 | 2.0 | 1156 | $1,450 | $1.25 | 3d | 1 | 1.22mi |
| 4101 E Brown Way Unit Brown 4117 Tucson, AZ | 2.0 | 1.5 | 938 | $1,150 | $1.23 | 23d | 1 | 1.24mi |
| 4101 E Brown Way Unit Brown 4103 Tucson, AZ | 2.0 | 1.0 | 900 | $1,195 | $1.33 | 23d | 1 | 1.24mi |
| 142 S Tucson Blvd Tucson, AZ | 1.0–2.0 | 1.0–2.0 | 659 | $1,150 | $1.74 | 17d | 7 | 1.25mi |
| 1530 S Columbus Blvd #8 Tucson, AZ | 1.0 | 1.0 | 800 | $1,200 | $1.50 | 17d | 1 | 1.26mi |
| 2133 E 35th St Tucson, AZ | 3.0 | 2.0 | 1496 | $1,895 | $1.27 | 11d | 1 | 1.27mi |
| 601 S Bryant Ave Tucson, AZ | 2.0 | 1.0 | 1004 | $1,300 | $1.29 | 11d | 1 | 1.27mi |
| 4170 E 32nd St Tucson, AZ | 2.0 | 1.0 | 725 | $1,095 | $1.51 | 17d | 1 | 1.27mi |
| 4170 E 32nd St Tucson, AZ | 2.0 | 1.0 | 725 | $1,095 | $1.51 | 14d | 1 | 1.27mi |
| 460 S Bryant Ave Tucson, AZ | 2.0 | 2.0 | 800 | $995 | $1.24 | 23d | 1 | 1.29mi |
| 460 S Bryant Ave Tucson, AZ | 2.0 | 2.0 | 800 | $745 | $0.93 | 43d | 1 | 1.29mi |
| 4255 E 29th St Tucson, AZ | 2.0 | 1.0 | 585 | $999 | $1.71 | 3d | 7 | 1.30mi |
| 117 N Sawtelle Ave Tucson, AZ | 3.0 | 2.0 | 1500 | $2,400 | $1.60 | 3d | 1 | 1.33mi |
| 2254 E Monterey Vis Tucson, AZ | 2.0 | 1.0 | 800 | $960 | $1.20 | 23d | 1 | 1.34mi |
| 2842 S Coconino Vis Tucson, AZ | 2.0 | 1.0 | 750 | $800 | $1.07 | 17d | 1 | 1.37mi |
Listing history 4 events
-
2026-06-02statusdays on market $105,000 Pending 11 DOM
-
2026-06-01days on market $105,000 Active 10 DOM
-
2026-05-31days on market $105,000 Active 9 DOM
-
2026-05-22$105,000 Active
ⓘ Source: listings_history table (triggers on properties + properties_extension) + one-shot
backfill from property_details.listing_events for pre-trigger history.
Tax reassessment forecast AZ · Resets to sale price
- Current annual tax
- $1,156 · $96/mo
- Projected year-2 tax
- $1,156 · $96/mo
- Expected delta
- $0/yr ($0/mo · 0.0%)
ⓘ Screening estimate from a state-policy table — verify with the county assessor before closing.
Climate risk First Street
- Flood 1/10 Low FEMA zone X (unshaded) · 0% chance over 30 yrs
- Wildfire 2/10 Low
- Heat 8/10 Severe 7 d/yr ≥105°F today · 19 d/yr by 30 yrs out
- Wind 1/10 Low
- Air quality 1/10 Low 0 unhealthy d/yr today · 0 by 30 yrs out
Nearby sold comps map
Loading sold comps map…
Walkable amenities ~0.75 mi
Loading nearby amenities…
Taxation est. · year 1
- Rental income
- $16,728
- − Mortgage interest
- −$5,882
- − Property taxes
- −$1,156
- − Insurance
- −$525
- − Repairs & maintenance
- −$1,338
- − Management
- −$1,338
- − Depreciation
- −$3,055
- Taxable income
- $3,434
- Est. tax owed @ 24.0%
- −$824
- After-tax cash flow
- $4,102/yr
For passive investors: Depreciation is non-cash, so a rental often shows a tax loss while cash-flowing — sheltering income. Rental losses are passive: they offset passive income freely, and up to $25,000/yr can offset ordinary (W-2) income if you actively participate and your MAGI is under $100k (phasing out to $0 by $150k); unused losses carry forward. On sale, claimed depreciation is recaptured at up to 25%, and gains may owe capital-gains tax (a 1031 exchange can defer both). Figures are a year-1 estimate at your 24.0% rate — not tax advice; consult a CPA.
Schools (NCES district)
- District
- Tucson Unified District (4403)
- NCES district ID
- 0408800
- Math proficiency
- 14% ▼ -17.00%
- Reading proficiency
- 23% ▼ -11.00%
- Median HH income
- $40,962
- Composite
- 15.78/100
- National rank
- #9270
- State rank
- #190 of 249 in AZ
Livability — Tucson
- Score
- 74/100
- State rank
- #17
- US rank
- #4502
Category grades
Schools grade is shown separately in the Schools card above.
Census & demographics
- Census place
- Tucson, AZ
- County
- Pima County · 1,012,107 people
- City population
- 839,336
- Metro
- Tucson, AZ
- Population (ZIP)
- 46,439
- Household income
- $53,152
- Rent vs Own
- Severe rent burden
- 1517.0
Population outlook (Pima County) Hauer SSP2
- Today (2025)
- 1,066,056 people
- By 2030
- 1,086,684 · +1.9%
- By 2040
- 1,117,160 · +4.8%
- By 2050
- 1,149,778 · +7.9%
- By 2075
- 1,271,480 · +19.3%
- By 2100
- 1,321,160 · +23.9%
Race, ethnicity, and origin ACS 2023
- Neighborhood character
- Predominantly Hispanic (70%)
- Race & ethnicity
- Hispanic / Latino 70% Two or more races 30% White 21% Native American 5% Black 3% Asian 1%
- Hispanic origin (detail)
- Mexican 67%
- Common ancestry
- Italian 1% Lithuanian 1% Portuguese 1%
- Foreign-born
- 19% · Canada, China
- Languages at home
- 49% English-only · Spanish 49%
Political lean MEDSL · Pima
- 2024 margin
- D (+15.2) · D 57.0% · R 41.8% · Other 1.2%
- 2008→2024 swing
- +9.1pp toward D · 2008: 6.1pp · 2024: 15.2pp
- All cycles
- 2024: D+15.2 2020: D+18.7 2016: D+13.5 2012: D+5.8 2008: D+6.1
Not yet ingested
- Civics
- —
Market trends
- HPI YoY
- ▼ -107.07%
- Current HPI
- 329.8338
- Rent YoY
- ▲ 0.21%
- Metro
- Tucson, AZ
- State GDP YoY
- ▲ 4.54%
- F500 in state
- 20
Industry mix (Fortune 500 HQ in AZ)
| Industry | F500 HQs | Revenue |
|---|---|---|
| Technology | 2 | $13B |
|
||
| Mining / Metals | 1 | $23B |
|
||
| Environmental Services | 1 | $16B |
|
||
| Metals / Steel | 1 | $14B |
|
||
| Technology Distribution | 1 | $9B |
|
||
| Homebuilding | 1 | $8B |
|
||
Price history
1 event — show timeline
- 2026-05-22 Listed $105,000 MLSSAZ
Property tax history
+2.5%/yrLatest (2025): $1,156 · +4.2% YoY. Source: county tax records.
Cash-flow waterfall
monthlySold comps — $/sqft
last 12 mo · ≤1 miLoading sold comps…