 Duplex
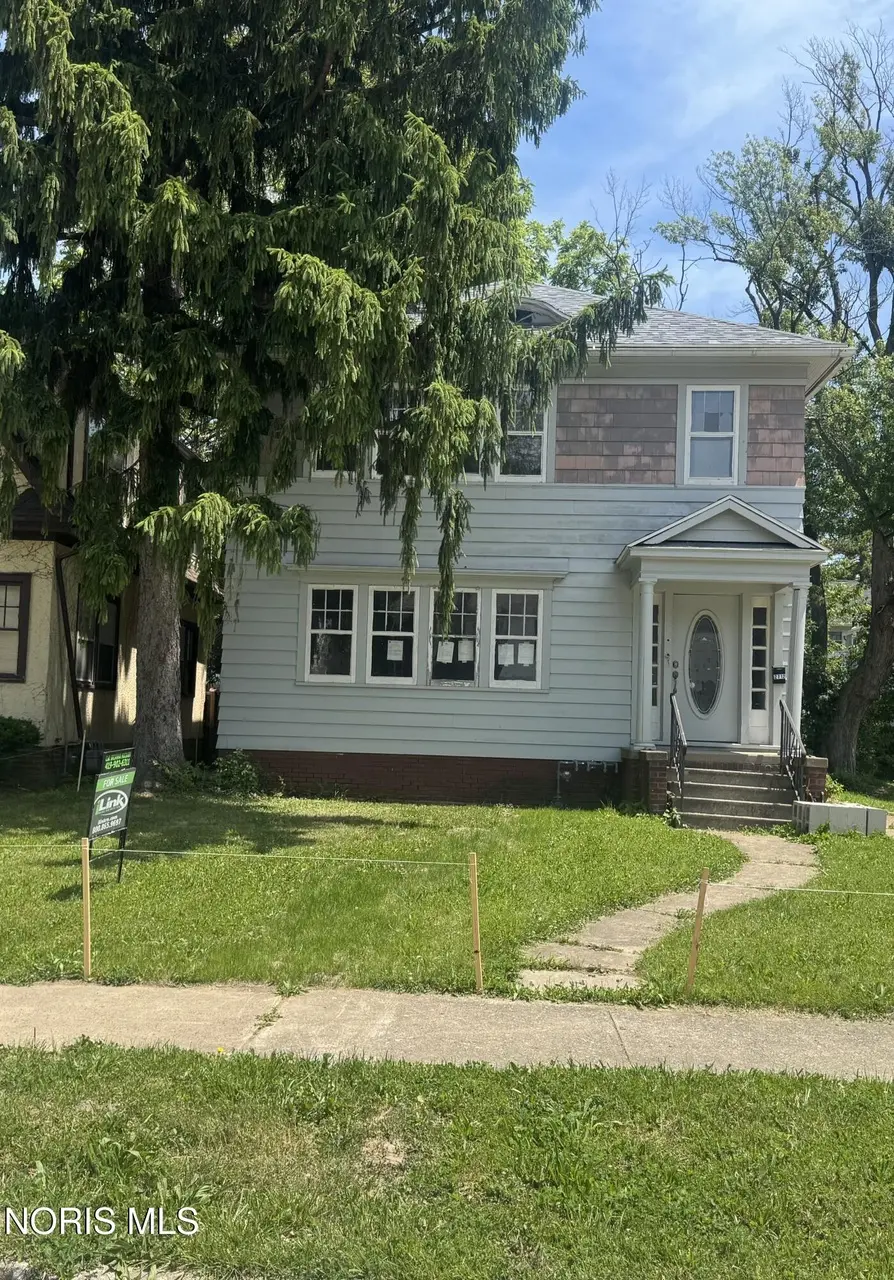
2712 Hoehler Dr · Toledo, OH
Flood risk 1/10 · Minimal
- FEMA flood zone
- X (unshaded)
- Chance of flooding over 30 yrs
- 0.0%
- Est. flood insurance / yr
- $473 – $860
Fire risk 1/10 · Minimal
- Est. fire insurance / yr
- $713 – $1,323
Heat risk 3/10 · Minor
- Hot days now (above 101°F)
- 7 days/yr
- Hot days in 30 yrs
- 16 days/yr
Wind risk 2/10 · Minimal
- Chance of severe wind over 30 yrs
- —
Air-quality risk 2/10 · Minimal
- Unhealthy air days now
- 1 days/yr
- Unhealthy air days in 30 yrs
- 3 days/yr
Risk factors via First Street. Map © Google.
Why this score? — see what drove the B- grade
The composite is a weighted blend of 9 inputs, each scored 0–100. Each bar is that input's sub-score; the figure is the points it added to the 100-point composite (weight × sub-score).
- Cash flow +30.0/30.0
- 1% rule +10.0/10.0
- DSCR +10.0/10.0
- ARV discount +7.5/15.0
- Livability +3.3/5.0
- Rent growth +3.1/5.0
- Condition / age +2.5/5.0
- Schools +1.6/10.0
- Appreciation +0.0/10.0
$89,900
🖨 Deal sheet 📄 Offer letter ✓ Due diligence
Multi-family units
County records classify this as Multi-Family (2-4 Unit). Listing-text estimate: 2 units. confirmed
Listing remarks
Opportunity knocks twice, and this time, it's completely cleared for takeoff! This DUPLEX NEIGHBORING TOLEDO HOSPITAL, has been officially removed from the demolition list and is ready for its cosmetic transformation. FOR ADDED VALUE POTENTIAL, IT IS BEING SOLD WITH THE LOT NEXT DOOR (2708 Hoehler). All the heavy lifting, red tape, and structural hurdles have been cleared, leaving you with a clean slate to bring this property to its true market potential. Major system updates include New electrical boxes and service lines, a new drain stack in basement (plumbing to be connected), new gas lines, new roof, new posterior foundation. Seller continuing to clean property from prior repairs and r
Key facts
- New electrical boxes
- New service lines
- New gas lines
Tags
Property features AI
Finance
- Financial info: Two-unit property (both units currently listed as vacant); Owner pays insurance and taxes; Tenants are responsible for other utilities/expenses
Exterior
- Parking: Detached garage; Driveway; Total parking for 3 vehicles; 1 garage space
- Utilities: Electricity connected (circuit breakers); Public water; Public sewer
- Home design: Duplex (residential income); Two-story; Two total stories
- Construction: Wood siding exterior; Block foundation
- Exterior features: Shingle roof; Fencing (other); Additional garage structures on the property; City street frontage; Paved road access; Irregular-shaped lot; Additional parcel included (12-02067)
Interior
- Kitchen: Water heater (listed under appliances)
- Flooring: Wood flooring
- Heating & cooling: Boiler heating
- Interior features: Storage
Neighborhood map
What this means for you Summary
Snapshot
- This is a 2 × 2-bed/1.0-bath units multifamily listed at $90k.
Deal economics
- At list price, monthly cash flow is $924 ($11k/yr) — positive. Per door: $462/mo.
- The deal already cash-flows at list — no discount required.
- Meets the 1% rule at list price ($2k rent vs $90k).
- Cap rate 18.6% vs local median 7.6% in Toledo — top-decile yield for the area; either an underpriced asset or a hidden risk that comps aren't pricing in. Stress-test before assuming the spread holds.
Location & tenants
- Location reads 66/100 on livability (#645 in OH) — a middle-class / working-renter tenant base. Strengths: cost of living A+, housing A+, health & safety A+; Watch: amenities C-, crime F, commute F.
- Toledo City (urban): math 15% / reading 24% proficiency, ranked #634 of 656 in OH (top 97%) — low school quality limits family demand, transient renter base, plan for 1-2y turnover; 72% free/reduced lunch — lower-income household profile, screen leases tightly.
- Zoned schools: Old Orchard Elementary School (math 12% / reading 23%, grade F, #1,328 of 1,584 statewide, top 84%, 390 students, 0% FRL); Start High School (math 11% / reading 33%, grade F, #672 of 781 statewide, top 86%, 1,242 students, 50% FRL) — zoned schools average 25% FRL vs 72% district-wide (47 pts lower); this property's tenant base skews higher-income than the district average.
- Market conditions: Rents rising (+2.3%/yr); 93 active listings in the ZIP; 4 comparable units currently listed for rent nearby; rentals lingering (median 44d on market — plan ~5-8 weeks vacancy on turnover, expect pricing pressure); 75% of comp listings sitting > 30 days — soft ceiling on asking rent; 415 units permitted in Lucas County in 2024 (122 in 5+ unit buildings).
- This rent runs 35% of the median local income ($67k/yr) — at the standard rent-burdened threshold; future hikes will face affordability resistance.
Forward outlook
- Local home prices are declining (-3.0%/yr); year-one equity from $622 of loan paydown is wiped out by about $3k of value loss. Plan a longer hold.
- Lucas County population projected at -16% by 2050 — secular population decline; favor cash flow + early exit over multi-decade hold.
- At projected returns (-3.0% appreciation + 2.3% rent growth), your $25k cash investment doubles in ~3 years — after that, you're playing with house money.
Negotiation context
- Only 14 days on market — expect competitive offers; lowballing is unlikely to land.
- 2 sale attempts; this cycle's ask has dropped $10k (10%) from the opening price — seller is motivated, your offer sets the floor, not the list.
- Current owner paid $60k; list at $90k implies a 51% gain — meaningful room to come down on a strong offer.
Risks & watch-outs
- Watch-outs: built in 1920 — expect roof / HVAC / electrical / plumbing capex.
Questions for the listing agent
- Can we see the unit-by-unit rent roll, current vacancy, and any below-market leases? What's the average tenancy length?
- What capital expenditures (roof, boiler, parking lot, exteriors) have been made in the last 5 years, and what's planned in the next 2?
- Built in 1920 — when were the roof, HVAC, electrical panel, plumbing, and water heater last replaced?
- Is there a deadline driving the sale (1031 exchange, divorce, estate, relocation)? That informs how much negotiation room exists.
- Schools are D-rated, which usually means shorter tenancies and higher turnover. Who's the typical renter profile here, and what's been the actual vacancy rate?
- Crime grade is F in this area — have there been break-ins, vandalism, or insurance claims at this property in the last 3 years? What carrier currently insures it and at what premium?
- What's the average days-on-market for RENTAL listings here right now (not sales)? A rising rental-DOM trend means longer vacancies and softer asking-rent achievability than the comps imply.
- What's the recent tenant-quality profile in this submarket — average credit score on applications, eviction rate, late-payment / NSF rate, and stable-employment percentage? A property-management company in the area should have these aggregated.
- How much new apartment / multifamily construction is in the pipeline within 1–3 miles? Heavy new supply (>2% of stock underway) typically softens rents 12–24 months out; light construction supports rent growth.
Investment metrics
- 1% rule
- 2.15% ✓
- Cap rate
- 18.62%
- Cash-on-cash
- 44.03%
- DSCR
- 2.96
- GRM
- 3.9
CMA / ARV
- ARV (on-the-fly)
- $187,824
- Comps found
- 7
Show comp detail 7 sales within ~0.75 mi
| Address | Dist | Beds/Ba | Sqft | Sold | Price | $/sf | Match |
|---|---|---|---|---|---|---|---|
| 2647 Gunckel Blvd | 0.46mi | 4/2.0 | 2,406 (-0%) | 22mo | $152,000 | $63 | 60 |
| 2820 Northwood Ave | 0.36mi | 4/2.0 | 2,058 (-14%) | 13mo | $176,500 | $86 | 48 |
| 2928 Algonquin Pkwy | 0.51mi | 4/2.0 | 2,600 (+8%) | 20mo | $205,000 | $79 | 46 |
| 3037 Algonquin Pkwy | 0.58mi | 5/2.0 (+1) | 2,476 (+3%) | 22mo | $141,110 | $57 | 44 |
| 2932 Algonquin Pkwy | 0.51mi | 4/2.0 | 2,634 (+9%) | 20mo | $206,000 | $78 | 44 |
| 2929 Northwood Ave | 0.43mi | 4/2.0 | 2,120 (-12%) | 22mo | $170,000 | $80 | 42 |
| 1923 Freeman St | 0.66mi | 4/2.0 | 2,690 (+12%) | 11mo | $100,000 | $37 | 41 |
Match score weights: distance 35% · size 25% · config 20% · recency 20%. Top-matched comps best support the ARV.
Projected returns pro-forma
-3.0% appreciation · 2.29% rent growth · sell at horizon
- IRR
- 40.2%
- Equity multiple
- 2.70×
- Total profit
- $42,904
- Equity at exit
- $13,404
- IRR
- 46.2%
- Equity multiple
- 5.28×
- Total profit
- $107,632
- Equity at exit
- $7,773
Cash invested: $25,172 (down + closing). Projections, not guarantees.
Landlord ↔ Tenant lean methodology
- Overall (STATE)
- 73 Landlord-Friendly
- State Ohio
- 73 Landlord-Friendly · R+6
- County
- — inherits STATE
- City
- — inherits STATE
ZIP-level market 43606
- Home prices YoY
- -15.5%
- Rents YoY
- 2.3%
- Active inventory
- 93
- Price-to-rent
- 7.7×
Monthly cashflow live
- Estimated rent
- $1,937 high interval (Pro) →
- Mortgage (P&I)
- −$471
- Tax from tax record
- −$98 /mo · $1,172/yr
- Insurance
- −$37
- HOA
- −$0
- Vacancy / Maint / Mgmt
- −$407
- Net cashflow
- $924
Break-even live
2-unit breakdown (identical units grouped — click to expand)
| Units | Beds | Baths | Est. rent |
|---|---|---|---|
| 2× units | 2 | 1 | $1,936 |
| #1 | 2 | 1 | $968 |
| #2 | 2 | 1 | $968 |
| Total (2 units) | $1,937 | ||
UW: 25.0% down · 7.5% · 30yr · 1.5% tax · 5.0% vac · 8.0% maint · 8.0% mgmt
Financing live
Cash to close
- Down payment
- $22,475
- Closing costs
- $2,697
- Reserves months
- —
- Total cash needed
- —
Loan-product check · same deal, 3 products live
Conventional
25% down · 7.5% · 30yr
- Down + closing
- —
- Monthly P&I
- —
- Monthly cashflow
- —
- DSCR
- —
- Eligible?
- —
Personal DTI + credit; lowest rate.
DSCR
20% down · 8.5% · 30yr
- Down + closing
- —
- Monthly P&I
- —
- Monthly cashflow
- —
- DSCR
- —
- Eligible?
- —
No personal income docs; deal must DSCR.
Hard money
10% down · 12.0% · 12mo
- Down + closing
- —
- Monthly P&I
- —
- Monthly cashflow
- —
- DSCR
- —
- Eligible?
- —
Short-term bridge; refi at stabilization.
Rent comps 4 comps
| Address | Beds | Baths | Sqft | Rent | $/sqft | DOM | Units | Dist |
|---|---|---|---|---|---|---|---|---|
| 1436 Palmetto Ave Toledo, OH | 3.0 | 1.0 | 1678 | $1,400 | $0.83 | 23d | 1 | 0.67mi |
| 3121 Cheltenham Rd Toledo, OH | 4.0 | 2.0 | 1691 | $1,800 | $1.06 | 43d | 1 | 1.17mi |
| 2645 Drummond Rd Toledo, OH | 5.0 | 2.0 | 2007 | $1,900 | $0.95 | 43d | 1 | 1.24mi |
| 1420 Addington Rd Toledo, OH | 5.0 | 1.5 | 1728 | $1,500 | $0.87 | 43d | 1 | 1.37mi |
Listing history 20 events
-
2026-06-18days on market $89,900 Active 14 DOM
-
2026-06-17days on market $89,900 Active 13 DOM
-
2026-06-16days on market $89,900 Active 12 DOM
-
2026-06-15days on market $89,900 Active 11 DOM
-
2026-06-14days on market $89,900 Active 9 DOM
-
2026-06-10days on market $89,900 Active 6 DOM
-
2026-06-09days on market $89,900 Active 5 DOM
-
2026-06-08days on market $89,900 Active 4 DOM
-
2026-06-07days on market $89,900 Active 3 DOM
-
2026-06-05remarks 699-char remark
-
2026-06-05pricestatusdays on market $89,900 Active 1 DOM
-
2026-05-05status Pending
-
2025-12-08historical Contingent
-
2025-12-05status Active
-
2025-12-05price $80,000
-
2025-11-29status Pending
-
2025-11-28$100,000 Active
-
2025-11-07historical $100,000
-
1989-07-24soldstatus $59,500
-
1971-11-30soldstatus $28,000
ⓘ Source: listings_history table (triggers on properties + properties_extension) + one-shot
backfill from property_details.listing_events for pre-trigger history.
Tax reassessment forecast OH · Partial reset (capped growth)
- Current annual tax
- $1,172 · $98/mo
- Projected year-2 tax
- $1,287 · $107/mo
- Expected delta
- +$115/yr (+$10/mo · 9.8%)
ⓘ Screening estimate from a state-policy table — verify with the county assessor before closing.
Climate risk First Street
- Flood 1/10 Low FEMA zone X (unshaded) · 0% chance over 30 yrs
- Wildfire 1/10 Low
- Heat 3/10 Moderate 7 d/yr ≥101°F today · 16 d/yr by 30 yrs out
- Wind 2/10 Low
- Air quality 2/10 Low 1 unhealthy d/yr today · 3 by 30 yrs out
Nearby sold comps map
Loading sold comps map…
Walkable amenities ~0.75 mi
Loading nearby amenities…
Taxation est. · year 1
- Rental income
- $23,244
- − Mortgage interest
- −$5,036
- − Property taxes
- −$1,172
- − Insurance
- −$450
- − Repairs & maintenance
- −$1,860
- − Management
- −$1,860
- − Depreciation
- −$2,615
- Taxable income
- $10,252
- Est. tax owed @ 24.0%
- −$2,460
- After-tax cash flow
- $8,623/yr
For passive investors: Depreciation is non-cash, so a rental often shows a tax loss while cash-flowing — sheltering income. Rental losses are passive: they offset passive income freely, and up to $25,000/yr can offset ordinary (W-2) income if you actively participate and your MAGI is under $100k (phasing out to $0 by $150k); unused losses carry forward. On sale, claimed depreciation is recaptured at up to 25%, and gains may owe capital-gains tax (a 1031 exchange can defer both). Figures are a year-1 estimate at your 24.0% rate — not tax advice; consult a CPA.
Schools (NCES district)
- District
- Toledo City
- NCES district ID
- 3904490
- Math proficiency
- 15% ▼ -16.00%
- Reading proficiency
- 24% ▼ -13.00%
- Median HH income
- $32,137
- Composite
- 15.76/100
- National rank
- #9276
- State rank
- #634 of 656 in OH
Livability — Toledo
- Score
- 66/100
- State rank
- #645
- US rank
- #11442
Category grades
Schools grade is shown separately in the Schools card above.
Census & demographics
- Census place
- Toledo, OH
- County
- Lucas County · 380,724 people
- City population
- 280,811
- Metro
- Toledo, OH
- Population (ZIP)
- 24,898
- Household income
- $66,917
- Rent vs Own
- Severe rent burden
- 843.0
Population outlook (Lucas County) Hauer SSP2
- Today (2025)
- 420,751 people
- By 2030
- 410,187 · -2.5%
- By 2040
- 384,019 · -8.7%
- By 2050
- 355,125 · -15.6%
- By 2075
- 291,683 · -30.7%
- By 2100
- 233,670 · -44.5%
Race, ethnicity, and origin ACS 2023
- Neighborhood character
- Diverse neighborhood (Simpson 0.57)
- Race & ethnicity
- White 59% Black 29% Two or more races 7% Hispanic / Latino 4% Asian 3%
- Common ancestry
- Romanian 6% Italian 2% Lithuanian 1%
- Foreign-born
- 7% · Canada, China, South Korea
- Languages at home
- 92% English-only · Arabic 2% Other Indo-European 2% Spanish 1%
Political lean MEDSL · Lucas
- 2024 margin
- D (+12.6) · D 55.8% · R 43.2%
- 2008→2024 swing
- -18.9pp toward R · 2008: 31.4pp · 2024: 12.6pp
- All cycles
- 2024: D+12.6 2020: D+16.8 2016: D+17.4 2012: D+30.4 2008: D+31.4
Not yet ingested
- Civics
- —
Market trends
- HPI YoY
- ▼ -41.19%
- Current HPI
- 224.695
- Rent YoY
- ▲ 2.29%
- Metro
- Toledo, OH
- State GDP YoY
- ▲ 1.98%
- F500 in state
- 48
Industry mix (Fortune 500 HQ in OH)
| Industry | F500 HQs | Revenue |
|---|---|---|
| Insurance | 3 | $145B |
|
||
| Industrial Machinery | 3 | $49B |
|
||
| Financial Services | 3 | $24B |
|
||
| Consumer Goods | 2 | $93B |
|
||
| Aerospace / Defense | 2 | $47B |
|
||
| Utilities | 2 | $33B |
|
||
Price history
+185.7% since first listed9 events — show timeline
- 2026-05-05 Pending — NORIS
- 2025-12-08 Contingent — NORIS
- 2025-12-05 Relisted — NORIS
- 2025-12-05 Price Changed $80,000 NORIS
- 2025-11-29 Pending — NORIS
- 2025-11-28 Listed $100,000 NORIS
- 2025-11-07 Coming Soon $100,000 NORIS
- 1989-07-24 Sold (Public Records) $59,500 Public Records
- 1971-11-30 Sold (Public Records) $28,000 Public Records
Property tax history
-4.1%/yrLatest (2025): $1,172 · -25.7% YoY. Source: county tax records.
Cash-flow waterfall
monthlySold comps — $/sqft
last 12 mo · ≤1 miLoading sold comps…