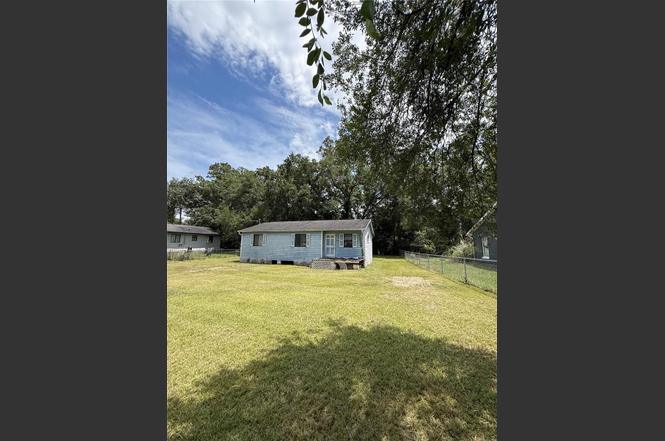
4600 SE 136th Ln · Belleview, FL
Flood risk 8/10 · Major
- FEMA flood zone
- X (unshaded)
- Chance of flooding over 30 yrs
- 0.99%
- Est. flood insurance / yr
- $507 – $1,088
Fire risk 4/10 · Minor
- Est. fire insurance / yr
- $947 – $1,759
Heat risk 8/10 · Major
- Hot days now (above 108°F)
- 7 days/yr
- Hot days in 30 yrs
- 21 days/yr
Wind risk 9/10 · Severe
- Chance of severe wind over 30 yrs
- 99.0%
Air-quality risk 3/10 · Minor
- Unhealthy air days now
- 3 days/yr
- Unhealthy air days in 30 yrs
- 4 days/yr
Risk factors via First Street. Map © Google.
Why this score? — see what drove the B+ grade
The composite is a weighted blend of 9 inputs, each scored 0–100. Each bar is that input's sub-score; the figure is the points it added to the 100-point composite (weight × sub-score).
- Cash flow +30.0/30.0
- ARV discount +15.0/15.0
- DSCR +10.0/10.0
- 1% rule +8.8/10.0
- Schools +3.6/10.0
- Livability +3.5/5.0
- Rent growth +2.5/5.0
- Condition / age +2.5/5.0
- Appreciation +0.0/10.0
$129,000
🖨 Deal sheet 📄 Offer letter ✓ Due diligence
Listing remarks
CASH ONLY. Potential in an Established Neighborhood! Welcome home to this 3-bedroom, 2-bath property located in desirable Belleview Heights Estates. Offering a functional layout with plenty of room to make it your own, this home features both a front and back deck, a fenced yard, and the convenience of a paved road frontage. Major updates include a newer roof, and the property is serviced by well and septic. Conveniently located just minutes from shopping, dining, medical facilities, banking, and everyday essentials, this home provides easy access to The Villages, Belleview, Ocala, I-75, US 441, US 301, and Hwy 25. Belleview's Regional Shopping Center, Publix, and numerous dining options ar
Key facts
- Well and septic
- Fenced yard
- Paved road frontage
Tags
Property features AI
Finance
- Other: Zoned R1; Total acreage: less than 1/4 acre (approx. 0.24 acres); Lot dimensions approximately 75 x 140; Living area about 984 square feet (per public records); Building area about 1,230 square feet (per public records)
- HOA & community: No association fees; Association approval not required; Pets allowed
Exterior
- Parking: Open parking
- Utilities: Well water; Septic tank; Cable available; Electricity available; Water available
- Home design: Single family residence; Residential property; One story; Faces north; Entry level: One
- Construction: Frame construction with wood siding; Shingle roof; Crawlspace foundation with pillar/post/pier
- Exterior features: Front porch; Rear porch; Storage; Cross fenced; Cleared and paved lot; Paved road access
Interior
- Kitchen: Range; Refrigerator
- Bedrooms: 3 bedrooms
- Flooring: Carpet; Laminate
- Bathrooms: 2 full bathrooms
- Heating & cooling: Electric heating; Central air conditioning
- Interior features: Ceiling fans
- Laundry & utility: Dedicated laundry room
Neighborhood map
What this means for you Summary
Snapshot
- This is a 3-bed/2.0-bath single-family listed at $129k.
Deal economics
- At list price, monthly cash flow is $446 ($5k/yr) — positive.
- The deal already cash-flows at list — no discount required.
- Meets the 1% rule at list price ($2k rent vs $129k).
- Cap rate 11.1% vs local median 4.5% in Belleview — top-decile yield for the area; either an underpriced asset or a hidden risk that comps aren't pricing in. Stress-test before assuming the spread holds.
Location & tenants
- Location reads 69/100 on livability (#458 in FL) — a middle-class / working-renter tenant base. Strengths: cost of living A+, housing A+, health & safety A+; Watch: schools D, crime F, amenities F.
- Marion (rural): math 42% / reading 43% proficiency, ranked #61 of 73 in FL (top 84%) — families likely to look elsewhere, expect single-tenant / working-renter base with shorter leases; 61% free/reduced lunch — lower-income household profile, screen leases tightly.
- Market conditions: 705 active listings in the ZIP; 5 comparable units currently listed for rent nearby; rentals leasing fast (median 14d on market — plan ~1-2 weeks tenant-placement turnaround); 7,071 units permitted in Marion County in 2024 (534 in 5+ unit buildings).
- This rent runs 32% of the median local income ($67k/yr) — at the standard rent-burdened threshold; future hikes will face affordability resistance.
Forward outlook
- Local home prices are declining (-3.0%/yr); year-one equity from $892 of loan paydown is wiped out by about $4k of value loss. Plan a longer hold.
- Marion County population projected at +13% by 2050 — modest demand growth; plan on rents tracking national, not racing it.
- At projected returns (-3.0% appreciation + 3.0% rent growth), your $36k cash investment doubles in ~8 years — after that, you're playing with house money.
Negotiation context
- Only 2 days on market — expect competitive offers; lowballing is unlikely to land.
- 5 sale attempts since 22y ago with the ask held roughly flat each time — persistent listings suggest the price (not the market) is what's stuck; bring a comps-based counter.
Risks & watch-outs
- Watch-outs: flood insurance adds $66/mo.
- Climate carrying-cost: severe flood risk; severe wind risk, 99% chance of damaging wind over 30y; extreme-heat days projected 7→21/yr by 2055 (HVAC capex compounding) — expect insurance premiums to compound above CPI over the hold.
Questions for the listing agent
- What's the actual annual flood-insurance premium (NFIP or private), and is the property in a SFHA with mandatory coverage?
- Is there a deadline driving the sale (1031 exchange, divorce, estate, relocation)? That informs how much negotiation room exists.
- Schools are D-rated, which usually means shorter tenancies and higher turnover. Who's the typical renter profile here, and what's been the actual vacancy rate?
- Crime grade is F in this area — have there been break-ins, vandalism, or insurance claims at this property in the last 3 years? What carrier currently insures it and at what premium?
- What's the average days-on-market for RENTAL listings here right now (not sales)? A rising rental-DOM trend means longer vacancies and softer asking-rent achievability than the comps imply.
- What's the recent tenant-quality profile in this submarket — average credit score on applications, eviction rate, late-payment / NSF rate, and stable-employment percentage? A property-management company in the area should have these aggregated.
- How much new for-sale + rental construction is in the pipeline within 1–3 miles? Heavy new supply typically softens prices + rents 12–24 months out; constrained supply supports both.
Investment metrics
- 1% rule
- 1.38% ✓
- Cap rate
- 11.06%
- Cash-on-cash
- 17.02%
- DSCR
- 1.76
- GRM
- 6.0
CMA / ARV
- ARV (on-the-fly)
- $190,896
- Comps found
- 9
Show comp detail 9 sales within ~0.75 mi
| Address | Dist | Beds/Ba | Sqft | Sold | Price | $/sf | Match |
|---|---|---|---|---|---|---|---|
| 14118 SE 45th Ct | 0.45mi | 3/1.5 | 1,014 (+3%) | 4mo | $169,900 | $168 | 69 |
| 13591 SE 44th Ter | 0.14mi | 3/2.0 | 1,056 (+7%) | 17mo | $211,000 | $200 | 68 |
| 4585 SE 136th St | 0.09mi | 3/2.0 | 1,121 (+14%) | 13mo | $235,000 | $210 | 62 |
| 13638 SE 53rd Ter | 0.69mi | 3/1.0 | 990 (+1%) | 8mo | $192,000 | $194 | 56 |
| 14060 SE 44th Ave | 0.43mi | 3/2.0 | 1,121 (+14%) | 6mo | $224,900 | $201 | 51 |
| 14289 SE 43rd Ter | 0.57mi | 3/2.0 | 1,119 (+14%) | 1mo | $227,900 | $204 | 50 |
| 3805 SE 138th Pl | 0.74mi | 3/2.0 | 936 (-5%) | 16mo | $180,000 | $192 | 44 |
| 13077 SE 47th Ct | 0.63mi | 2/2.0 (-1) | 1,040 (+6%) | 21mo | $162,000 | $156 | 38 |
| 4077 SE 140th Pl | 0.58mi | 2/1.5 (-1) | 840 (-15%) | 17mo | $48,725 | $58 | 28 |
Match score weights: distance 35% · size 25% · config 20% · recency 20%. Top-matched comps best support the ARV.
Projected returns pro-forma
-3.0% appreciation · 3.0% rent growth · sell at horizon
- IRR
- 5.4%
- Equity multiple
- 1.21×
- Total profit
- $7,561
- Equity at exit
- $19,234
- IRR
- 14.9%
- Equity multiple
- 2.20×
- Total profit
- $43,435
- Equity at exit
- $11,154
Cash invested: $36,120 (down + closing). Projections, not guarantees.
Landlord ↔ Tenant lean methodology
- Overall (STATE)
- 87 Strongly Landlord-Friendly
- State Florida
- 87 Strongly Landlord-Friendly · R+3
- County
- — inherits STATE
- City
- — inherits STATE
ZIP-level market 34491
- Home prices YoY
- -35.0%
- Active inventory
- 705
- Price-to-rent
- 6.0×
Monthly cashflow live
- Estimated rent
- $1,785 high interval (Pro) →
- Mortgage (P&I)
- −$676
- Tax from tax record
- −$168 /mo · $2,013/yr
- Insurance
- −$54
- Flood insurance flood zone
- −$66 /mo · $798/yr
- HOA
- −$0
- Vacancy / Maint / Mgmt
- −$375
- Net cashflow
- $446
Break-even live
UW: 25.0% down · 7.5% · 30yr · 1.5% tax · 5.0% vac · 8.0% maint · 8.0% mgmt
Financing live
Cash to close
- Down payment
- $32,250
- Closing costs
- $3,870
- Reserves months
- —
- Total cash needed
- —
Loan-product check · same deal, 3 products live
Conventional
25% down · 7.5% · 30yr
- Down + closing
- —
- Monthly P&I
- —
- Monthly cashflow
- —
- DSCR
- —
- Eligible?
- —
Personal DTI + credit; lowest rate.
DSCR
20% down · 8.5% · 30yr
- Down + closing
- —
- Monthly P&I
- —
- Monthly cashflow
- —
- DSCR
- —
- Eligible?
- —
No personal income docs; deal must DSCR.
Hard money
10% down · 12.0% · 12mo
- Down + closing
- —
- Monthly P&I
- —
- Monthly cashflow
- —
- DSCR
- —
- Eligible?
- —
Short-term bridge; refi at stabilization.
Rent comps 5 comps
| Address | Beds | Baths | Sqft | Rent | $/sqft | DOM | Units | Dist |
|---|---|---|---|---|---|---|---|---|
| 3934 SE 142nd St Summerfield, FL | 3.0 | 2.0 | 1000 | $1,499 | $1.50 | 13d | 1 | 0.81mi |
| 13678 SE 55th Ave Summerfield, FL | 3.0 | 2.0 | 960 | $1,499 | $1.56 | 21d | 1 | 0.82mi |
| 14025 SE 54th Ct Summerfield, FL | 2.0 | 1.5 | 1008 | $1,500 | $1.49 | 13d | 1 | 0.85mi |
| 3780 SE 141st Ln Summerfield, FL | 3.0 | 2.0 | 1066 | $1,595 | $1.50 | 21d | 1 | 0.89mi |
| 3780 SE 141st Ln Summerfield, FL | 3.0 | 2.0 | 1066 | $1,525 | $1.43 | 13d | 1 | 0.89mi |
Listing history 3 events
-
2026-06-18days on market $129,000 Active 2 DOM
-
2026-06-17remarks 699-char remark
-
2026-06-17$129,000 Active 1 DOM
ⓘ Source: listings_history table (triggers on properties + properties_extension) + one-shot
backfill from property_details.listing_events for pre-trigger history.
Tax reassessment forecast FL · Resets to sale price
- Current annual tax
- $2,013 · $168/mo
- Projected year-2 tax
- $2,013 · $168/mo
- Expected delta
- $0/yr ($0/mo · 0.0%)
ⓘ Screening estimate from a state-policy table — verify with the county assessor before closing.
Climate risk First Street
- Flood 8/10 Severe FEMA zone X (unshaded) · 99% chance over 30 yrs
- Wildfire 4/10 Moderate
- Heat 8/10 Severe 7 d/yr ≥108°F today · 21 d/yr by 30 yrs out
- Wind 9/10 Extreme 99% chance of damaging wind over 30 yrs
- Air quality 3/10 Moderate 3 unhealthy d/yr today · 4 by 30 yrs out
Nearby sold comps map
Loading sold comps map…
Walkable amenities ~0.75 mi
Loading nearby amenities…
Taxation est. · year 1
- Rental income
- $21,422
- − Mortgage interest
- −$7,226
- − Property taxes
- −$2,013
- − Insurance
- −$1,442
- − Repairs & maintenance
- −$1,714
- − Management
- −$1,714
- − Depreciation
- −$3,753
- Taxable income
- $3,560
- Est. tax owed @ 24.0%
- −$854
- After-tax cash flow
- $4,495/yr
For passive investors: Depreciation is non-cash, so a rental often shows a tax loss while cash-flowing — sheltering income. Rental losses are passive: they offset passive income freely, and up to $25,000/yr can offset ordinary (W-2) income if you actively participate and your MAGI is under $100k (phasing out to $0 by $150k); unused losses carry forward. On sale, claimed depreciation is recaptured at up to 25%, and gains may owe capital-gains tax (a 1031 exchange can defer both). Figures are a year-1 estimate at your 24.0% rate — not tax advice; consult a CPA.
Schools (NCES district)
- District
- Marion
- NCES district ID
- 1201260
- Math proficiency
- 42% ▼ -7.00%
- Reading proficiency
- 43% ▼ -4.00%
- Median HH income
- $40,015
- Composite
- 35.61/100
- National rank
- #4890
- State rank
- #61 of 73 in FL
Livability — Belleview
- Score
- 69/100
- State rank
- #458
- US rank
- #8314
Category grades
Schools grade is shown separately in the Schools card above.
Census & demographics
- County
- Marion County · 315,796 people
- City population
- 19,167
- Metro
- Ocala, FL
- Population (ZIP)
- 33,318
- Household income
- $66,679
- Rent vs Own
- Severe rent burden
- 256.0
Population outlook (Marion County) Hauer SSP2
- Today (2025)
- 365,905 people
- By 2030
- 376,768 · +3.0%
- By 2040
- 396,555 · +8.4%
- By 2050
- 412,723 · +12.8%
- By 2075
- 446,090 · +21.9%
- By 2100
- 436,193 · +19.2%
Race, ethnicity, and origin ACS 2023
- Neighborhood character
- Predominantly White (77%)
- Race & ethnicity
- White 77% Hispanic / Latino 14% Two or more races 9% Black 4% Asian 2%
- Hispanic origin (detail)
- Mexican 3% Puerto Rican 6% Cuban 1%
- Common ancestry
- Lithuanian 3% Slovak 2% Romanian 2%
- Foreign-born
- 8% · Canada, Vietnam, Jamaica
- Languages at home
- 85% English-only · Spanish 11% Vietnamese 1% French/Haitian/Cajun 1%
Political lean MEDSL · Marion
- 2024 margin
- Solid R (+31.6) · D 33.8% · R 65.5%
- 2008→2024 swing
- -20.0pp toward R · 2008: -11.6pp · 2024: -31.6pp
- All cycles
- 2024: R+31.6 2020: R+25.9 2016: R+26.2 2012: R+16.2 2008: R+11.6
Not yet ingested
- Civics
- —
Market trends
- HPI YoY
- ▼ -107.67%
- Current HPI
- 200.0792
- Rent YoY
- —
- Metro
- Ocala, FL
- State GDP YoY
- ▲ 3.28%
- F500 in state
- 36
Industry mix (Fortune 500 HQ in FL)
| Industry | F500 HQs | Revenue |
|---|---|---|
| Industrial Technology | 2 | $29B |
|
||
| Insurance | 2 | $17B |
|
||
| Retail | 1 | $60B |
|
||
| Technology Distribution | 1 | $58B |
|
||
| Homebuilding | 1 | $35B |
|
||
| Technology Manufacturing | 1 | $35B |
|
||
Price history
+85.6% since first listed9 events — show timeline
- 2026-06-16 Listed $129,000 Stellar MLS as Distributed by MLS Grid
- 2023-11-10 Pending — Stellar MLS as Distributed by MLS Grid
- 2023-11-02 Relisted — Stellar MLS as Distributed by MLS Grid
- 2023-06-02 Pending — Stellar MLS as Distributed by MLS Grid
- 2023-05-23 Listed $99,900 Stellar MLS as Distributed by MLS Grid
- 2013-08-19 Listing Removed — Stellar MLS as Distributed by MLS Grid
- 2013-04-30 Listed $41,900 Stellar MLS as Distributed by MLS Grid
- 2004-12-27 Listing Removed — Stellar MLS as Distributed by MLS Grid
- 2004-08-27 Listed $69,500 Stellar MLS as Distributed by MLS Grid
Property tax history
+9.0%/yrLatest (2025): $2,013 · +24.6% YoY. Source: county tax records.
Cash-flow waterfall
monthlySold comps — $/sqft
last 12 mo · ≤1 miLoading sold comps…