403 Transmitter Rd · Springfield, FL
Flood risk 1/10 · Minimal
- FEMA flood zone
- X (unshaded)
- Chance of flooding over 30 yrs
- 0.0%
- Est. flood insurance / yr
- $507 – $1,088
Fire risk 4/10 · Minor
- Est. fire insurance / yr
- $947 – $1,759
Heat risk 10/10 · Severe
- Hot days now (above 105°F)
- 5 days/yr
- Hot days in 30 yrs
- 15 days/yr
Wind risk 9/10 · Severe
- Chance of severe wind over 30 yrs
- 99.0%
Air-quality risk 1/10 · Minimal
- Unhealthy air days now
- 0 days/yr
- Unhealthy air days in 30 yrs
- 0 days/yr
Risk factors via First Street. Map © Google.
Why this score? — see what drove the D+ grade
The composite is a weighted blend of 9 inputs, each scored 0–100. Each bar is that input's sub-score; the figure is the points it added to the 100-point composite (weight × sub-score).
- ARV discount +15.0/15.0
- Cash flow +12.5/30.0
- Schools +4.3/10.0
- DSCR +3.7/10.0
- 1% rule +3.5/10.0
- Livability +3.0/5.0
- Rent growth +2.6/5.0
- Condition / age +2.5/5.0
- Appreciation +0.0/10.0
$199,000
🖨 Deal sheet (PDF) 📄 Offer letter ✓ Due diligence
Listing remarks
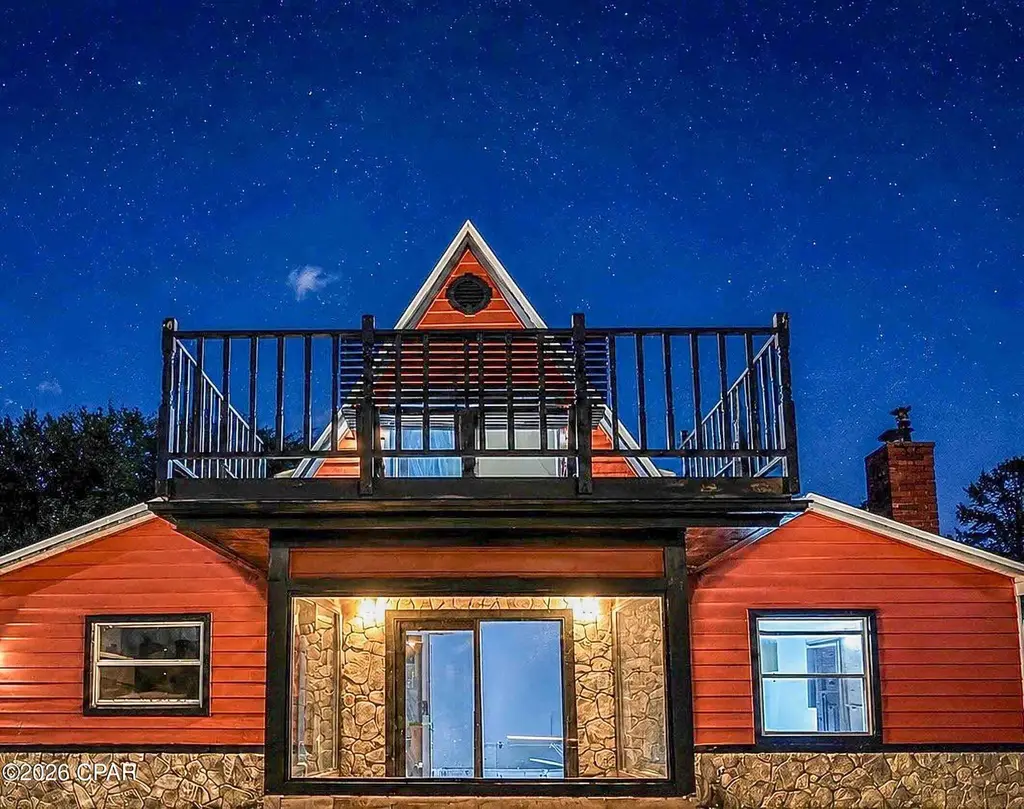
Remarkable opportunity for investors, first-time homebuyers, or anyone looking for an affordable property with flexibility and proven rental appeal. This charming home has previously been used as an Airbnb and has hosted military families in transition, buyers waiting on delayed closings, and guests needing an affordable place to stay with room for both family and belongings. Located directly across from Springfield Community Park and close to Tyndall Air Force Base, this property offers convenience, comfort, and income potential. It is also less than 30 minutes from Panama City Beach, making it a smart option for a short-term rental, long-term rental, or primary residence. As you enter the
Key facts
- 7,405 sq ft lot
- Garage
- Built 1978
Property features AI
Finance
- HOA & community: Short-term rentals allowed
Exterior
- Parking: Attached garage with 1.5 car capacity
- Home design: 2-story home; Slab foundation
- Construction: Composition/Shingle roof
- Exterior features: Fire pit; Porch; Balcony; Screened porch; Fenced yard
Interior
- Kitchen: Electric cooktop; Electric range
- Bedrooms: Primary bedroom; Bedroom on Second level; Bedroom on First level
- Bathrooms: 2 full bathrooms
- Heating & cooling: Central heating; Fireplace heating; Central air conditioning; Ceiling fans
- Interior features: Fireplace; Living room
Neighborhood map
What this means for you Summary
Snapshot
- This is a 3-bed/2.0-bath single-family listed at $199k.
Deal economics
- At list price, monthly cash flow is $-28 ($-336/yr) — negative.
- To cash-flow at today's rent, offer at most $194k (2.5% below list).
- To meet the 1% rule (rent ≥ 1% of price), the offer needs to be $170k (14.7% below list).
- Recommended offer: $170k (14.7% below list) — sets the bar for 1% rule.
- Cap rate 6.1% vs local median 4.7% in Springfield — top-decile yield for the area; either an underpriced asset or a hidden risk that comps aren't pricing in. Stress-test before assuming the spread holds.
Location & tenants
- Location reads 59/100 on livability (#826 in FL) — a working-class tenant base; expect higher turnover. Strengths: cost of living A+, housing A+, health & safety A+; Watch: schools D, employment D, crime F.
- Bay (suburban): math 51% / reading 51% proficiency, ranked #29 of 73 in FL (top 40%) — acceptable for families but not a draw, mixed tenant base, ~2y average lease.
- Market conditions: Rents flat; 258 active listings in the ZIP; 14 comparable units currently listed for rent nearby; rentals at typical pace (median 22d on market — plan ~3-4 weeks tenant-placement turnaround); 2,473 units permitted in Bay County in 2024 (559 in 5+ unit buildings).
- This rent runs 39% of the median local income ($53k/yr) — at the standard rent-burdened threshold; future hikes will face affordability resistance.
Forward outlook
- Local home prices are declining (-3.0%/yr); year-one equity from $1k of loan paydown is wiped out by about $6k of value loss. Plan a longer hold.
- Bay County population projected at +24% by 2050 — long-run rental-demand tailwind backs the buy-and-hold thesis.
Negotiation context
- It's been on market 20 days — a 2% lower offer ($196k) is reasonable based on typical stale-listing flexibility.
- 8 sale attempts since 17y ago with the ask held roughly flat each time — persistent listings suggest the price (not the market) is what's stuck; bring a comps-based counter.
- Current owner paid $144k; 38% above their basis — modest negotiation headroom, anchor on the comps not their cost.
Risks & watch-outs
- Climate carrying-cost: severe wind risk, 99% chance of damaging wind over 30y; extreme-heat days projected 5→15/yr by 2055 (HVAC capex compounding) — expect insurance premiums to compound above CPI over the hold.
Questions for the listing agent
- What do current leases actually rent for vs. the listed asking? Can we see a recent rent roll and the last 12 months of T-12 income?
- Built in 1978 — when were the roof, HVAC, electrical panel, plumbing, and water heater last replaced?
- Is there a deadline driving the sale (1031 exchange, divorce, estate, relocation)? That informs how much negotiation room exists.
- Schools are D-rated, which usually means shorter tenancies and higher turnover. Who's the typical renter profile here, and what's been the actual vacancy rate?
- Crime grade is F in this area — have there been break-ins, vandalism, or insurance claims at this property in the last 3 years? What carrier currently insures it and at what premium?
- The area grade is low — what's the realistic commute time and amenity access for the typical tenant pool here? Any planned neighborhood developments (good or bad) we should know about?
- What's the average days-on-market for RENTAL listings here right now (not sales)? A rising rental-DOM trend means longer vacancies and softer asking-rent achievability than the comps imply.
- What's the recent tenant-quality profile in this submarket — average credit score on applications, eviction rate, late-payment / NSF rate, and stable-employment percentage? A property-management company in the area should have these aggregated.
- How much new for-sale + rental construction is in the pipeline within 1–3 miles? Heavy new supply typically softens prices + rents 12–24 months out; constrained supply supports both.
Investment metrics
- 1% rule
- 0.85% ✗
- Cap rate
- 6.12%
- Cash-on-cash
- -0.60%
- DSCR
- 0.97
- GRM
- 9.8
CMA / ARV
- ARV (on-the-fly)
- $300,228
- Comps found
- 12
Show comp detail 12 sales within ~0.75 mi
| Address | Dist | Beds/Ba | Sqft | Sold | Price | $/sf | Match |
|---|---|---|---|---|---|---|---|
| 3727 E 3rd St | 0.18mi | 3/2.0 | 1,490 (-2%) | 4mo | $137,200 | $92 | 84 |
| 3721 E 3rd St | 0.21mi | 3/2.0 | 1,394 (-8%) | 4mo | $263,310 | $189 | 72 |
| 303 Detroit Ave | 0.16mi | 3/2.0 | 1,349 (-12%) | 7mo | $299,000 | $222 | 68 |
| 620 Helen Ave | 0.34mi | 4/2.5 (+1) | 1,647 (+8%) | 6mo | $287,000 | $174 | 59 |
| 718 School Ave | 0.68mi | 3/2.0 | 1,450 (-5%) | 3mo | $315,000 | $217 | 58 |
| 720 School Ave | 0.62mi | 3/2.0 | 1,394 (-8%) | 0mo | $300,000 | $215 | 57 |
| 4109 Sue Ln | 0.61mi | 3/2.0 | 1,639 (+8%) | 4mo | $290,000 | $177 | 56 |
| 718 Joan Ln | 0.65mi | 3/3.0 | 1,422 (-7%) | 0mo | $280,000 | $197 | 54 |
| 4819 Alameda St | 0.46mi | 3/2.0 | 1,312 (-14%) | 9mo | $255,000 | $194 | 48 |
| 724 Sheffield Ave | 0.63mi | 3/2.0 | 1,316 (-14%) | 6mo | $294,000 | $223 | 43 |
| 116 Moody Dr | 0.67mi | 3/2.0 | 1,300 (-15%) | 5mo | $287,000 | $221 | 40 |
| 5123 Collins St | 0.70mi | 3/1.0 | 1,304 (-14%) | 8mo | $130,000 | $100 | 33 |
Match score weights: distance 35% · size 25% · config 20% · recency 20%. Top-matched comps best support the ARV.
Projected returns pro-forma
-3.0% appreciation · 0.45% rent growth · sell at horizon
- IRR
- -20.2%
- Equity multiple
- 0.31×
- Total profit
- $-38,255
- Equity at exit
- $29,672
- IRR
- -20.0%
- Equity multiple
- 0.07×
- Total profit
- $-52,077
- Equity at exit
- $17,206
Cash invested: $55,720 (down + closing). Projections, not guarantees.
Landlord ↔ Tenant lean methodology
- Overall (STATE)
- 87 Strongly Landlord-Friendly
- State Florida
- 87 Strongly Landlord-Friendly · R+3
- County
- — inherits STATE
- City
- — inherits STATE
ZIP-level market 32401
- Home prices YoY
- -32.9%
- Rents YoY
- 0.5%
- Active inventory
- 258
- Price-to-rent
- 9.8×
Monthly cashflow live
- Estimated rent
- $1,697 high interval (Pro) →
- Mortgage (P&I)
- −$1,044
- Tax from tax record
- −$242 /mo · $2,905/yr
- Insurance
- −$83
- HOA
- −$0
- Vacancy / Maint / Mgmt
- −$356
- Net cashflow
- $-28
Break-even live
Sensitivity live
| Price | -10% $85 | -5% $28 | +0% $-28 | +5% $-84 | +10% $-141 |
|---|---|---|---|---|---|
| Rent | -10% $-162 | -5% $-95 | +0% $-28 | +5% $39 | +10% $106 |
| Rate | -1.0pp $72 | -0.5pp $23 | base $-28 | +0.5pp $-80 | +1.0pp $-132 |
UW: 25.0% down · 7.5% · 30yr · 1.5% tax · 5.0% vac · 8.0% maint · 8.0% mgmt
Financing live
Cash to close
- Down payment
- $49,750
- Closing costs
- $5,970
- Reserves months
- —
- Total cash needed
- —
Loan-product check · same deal, 3 products live
Conventional
25% down · 7.5% · 30yr
- Down + closing
- —
- Monthly P&I
- —
- Monthly cashflow
- —
- DSCR
- —
- Eligible?
- —
Personal DTI + credit; lowest rate.
DSCR
20% down · 8.5% · 30yr
- Down + closing
- —
- Monthly P&I
- —
- Monthly cashflow
- —
- DSCR
- —
- Eligible?
- —
No personal income docs; deal must DSCR.
Hard money
10% down · 12.0% · 12mo
- Down + closing
- —
- Monthly P&I
- —
- Monthly cashflow
- —
- DSCR
- —
- Eligible?
- —
Short-term bridge; refi at stabilization.
Rent comps 14 comps
| Address | Beds | Baths | Sqft | Rent | $/sqft | DOM | Units | Dist |
|---|---|---|---|---|---|---|---|---|
| 5101 Willow St Panama City, FL | 3.0 | 2.0 | 1099 | $1,500 | $1.36 | 14d | 1 | 0.64mi |
| 208 North Highway 22 A Unit 33 Panama City, FL | 3.0 | 2.0 | 1080 | $1,350 | $1.25 | 22d | 1 | 0.68mi |
| 3719 E 8th Ct Panama City, FL | 1.0–4.0 | 1.0–1.5 | 950 | $1,300 | $1.37 | 22d | 1 | 0.73mi |
| 906 Kevin Ct Panama City, FL | 3.0 | 2.0 | 1266 | $1,795 | $1.42 | 22d | 1 | 0.90mi |
| 526 Camellia Ave Panama City, FL | 3.0 | 2.0 | 1375 | $1,950 | $1.42 | 22d | 1 | 0.92mi |
| 129 Seneca Ave Panama City, FL | 3.0 | 2.0 | 1449 | $1,495 | $1.03 | 14d | 1 | 0.93mi |
| 420 Raven Ln Panama City, FL | 3.0 | 2.0 | 1251 | $1,750 | $1.40 | 22d | 1 | 1.10mi |
| 4837 S Lakewood Dr Panama City, FL | 2.0 | 1.5 | 1116 | $1,500 | $1.34 | 22d | 1 | 1.12mi |
| 222 N Gray Ave Panama City, FL | 3.0 | 2.0 | 1953 | $1,650 | $0.84 | 22d | 1 | 1.12mi |
| 5817 Jasmine Ct Panama City, FL | 4.0 | 2.5 | 1633 | $2,000 | $1.22 | 14d | 1 | 1.24mi |
| 1401 Transmitter Rd Unit 15 Panama City, FL | 3.0 | 2.0 | 1100 | $1,395 | $1.27 | 14d | 1 | 1.27mi |
| 229 Callaway Chase Ln Panama City, FL | 3.0 | 2.5 | 1200 | $1,650 | $1.38 | 14d | 1 | 1.27mi |
| 509 Phillips Ct Panama City, FL | 3.0 | 2.0 | 1411 | $1,700 | $1.20 | 14d | 1 | 1.47mi |
| 6101 Harvey St #3 Panama City, FL | 2.0 | 1.5 | 1108 | $1,050 | $0.95 | 22d | 1 | 1.49mi |
Listing history 17 events
-
2026-06-19days on market $199,000 Active 20 DOM
-
2026-06-18days on market $199,000 Active 19 DOM
-
2026-06-17days on market $199,000 Active 18 DOM
-
2026-06-16days on market $199,000 Active 17 DOM
-
2026-06-15days on market $199,000 Active 16 DOM
-
2026-06-14pricedays on market $199,000 Active 14 DOM
-
2026-06-13days on market $199,900 Active 13 DOM
-
2026-06-10days on market $199,900 Active 11 DOM
-
2026-06-09days on market $199,900 Active 10 DOM
-
2026-06-08days on market $199,900 Active 9 DOM
-
2026-06-07days on market $199,900 Active 8 DOM
-
2026-06-05days on market $199,900 Active 5 DOM
-
2026-06-03days on market $199,900 Active 4 DOM
-
2026-06-02days on market $199,900 Active 3 DOM
-
2026-06-01days on market $199,900 Active 2 DOM
-
2026-05-30remarks 699-char remark
-
2026-05-30$199,900 Active 1 DOM
ⓘ Source: listings_history table (triggers on properties + properties_extension) + one-shot
backfill from property_details.listing_events for pre-trigger history.
Tax reassessment forecast FL · Resets to sale price
- Current annual tax
- $2,905 · $242/mo
- Projected year-2 tax
- $2,905 · $242/mo
- Expected delta
- $0/yr ($0/mo · 0.0%)
ⓘ Screening estimate from a state-policy table — verify with the county assessor before closing.
Climate risk First Street
- Flood 1/10 Low FEMA zone X (unshaded) · 0% chance over 30 yrs
- Wildfire 4/10 Moderate
- Heat 10/10 Extreme 5 d/yr ≥105°F today · 15 d/yr by 30 yrs out
- Wind 9/10 Extreme 99% chance of damaging wind over 30 yrs
- Air quality 1/10 Low 0 unhealthy d/yr today · 0 by 30 yrs out
Nearby sold comps map
Loading sold comps map…
Walkable amenities ~0.75 mi
Loading nearby amenities…
Taxation est. · year 1
- Rental income
- $20,362
- − Mortgage interest
- −$11,147
- − Property taxes
- −$2,905
- − Insurance
- −$995
- − Repairs & maintenance
- −$1,629
- − Management
- −$1,629
- − Depreciation
- −$5,789
- Taxable loss
- −$3,731
- Est. tax savings @ 24.0%
- +$896
- After-tax cash flow
- $559/yr
For passive investors: Depreciation is non-cash, so a rental often shows a tax loss while cash-flowing — sheltering income. Rental losses are passive: they offset passive income freely, and up to $25,000/yr can offset ordinary (W-2) income if you actively participate and your MAGI is under $100k (phasing out to $0 by $150k); unused losses carry forward. On sale, claimed depreciation is recaptured at up to 25%, and gains may owe capital-gains tax (a 1031 exchange can defer both). Figures are a year-1 estimate at your 24.0% rate — not tax advice; consult a CPA.
Schools (NCES district)
- District
- Bay
- NCES district ID
- 1200090
- Math proficiency
- 51% ▼ -8.00%
- Reading proficiency
- 51% ▼ -7.00%
- Median HH income
- $47,740
- Composite
- 43.41/100
- National rank
- #3014
- State rank
- #29 of 73 in FL
Livability — Springfield
- Score
- 59/100
- State rank
- #826
- US rank
- #20265
Category grades
Schools grade is shown separately in the Schools card above.
Census & demographics
- Census place
- Springfield, FL
- County
- Bay County · 163,593 people
- Metro
- Panama City, FL
- Population (ZIP)
- 18,947
- Household income
- $52,523
- Rent vs Own
- Severe rent burden
- 935.0
Population outlook (Bay County) Hauer SSP2
- Today (2025)
- 206,264 people
- By 2030
- 217,740 · +5.6%
- By 2040
- 238,738 · +15.7%
- By 2050
- 255,545 · +23.9%
- By 2075
- 288,295 · +39.8%
- By 2100
- 288,638 · +39.9%
Race, ethnicity, and origin ACS 2023
- Neighborhood character
- Diverse neighborhood (Simpson 0.57)
- Race & ethnicity
- White 60% Black 23% Hispanic / Latino 11% Two or more races 8% Asian 2%
- Hispanic origin (detail)
- Mexican 5% Puerto Rican 2%
- Common ancestry
- Italian 2% Lithuanian 2% Slovak 2%
- Foreign-born
- 9% · Canada, Vietnam
- Languages at home
- 89% English-only · Spanish 8% Other Indo-European 1% German/W. Germanic 1%
Political lean MEDSL · Bay
- 2024 margin
- Solid R (+47.4) · D 25.8% · R 73.1% · Other 1.1%
- 2008→2024 swing
- -6.6pp toward R · 2008: -40.7pp · 2024: -47.4pp
- All cycles
- 2024: R+47.4 2020: R+43.5 2016: R+46.3 2012: R+43.6 2008: R+40.7
Not yet ingested
- Civics
- —
Market trends
- HPI YoY
- ▼ -142.12%
- Current HPI
- 290.3312
- Rent YoY
- ▲ 0.45%
- Metro
- Panama City, FL
- State GDP YoY
- ▲ 3.28%
- F500 in state
- 36
Industry mix (Fortune 500 HQ in FL)
| Industry | F500 HQs | Revenue |
|---|---|---|
| Industrial Technology | 2 | $29B |
|
||
| Insurance | 2 | $17B |
|
||
| Retail | 1 | $60B |
|
||
| Technology Distribution | 1 | $58B |
|
||
| Homebuilding | 1 | $35B |
|
||
| Technology Manufacturing | 1 | $35B |
|
||
Price history
+387.6% since first listed22 events — show timeline
- 2026-05-30 Listed $199,900 CPARMLS
- 2026-04-29 Listing Removed — CPARMLS
- 2026-04-07 Price Changed $209,000 CPARMLS
- 2026-03-09 Price Changed $219,000 CPARMLS
- 2026-02-23 Listed $224,000 CPARMLS
- 2022-10-15 Price Changed $248,400 CPARMLS
- 2022-09-20 Price Changed $248,900 CPARMLS
- 2022-08-10 Listed $249,900 CPARMLS
- 2021-12-14 Listing Removed — CPARMLS
- 2021-12-14 Listing Removed — CPARMLS
- 2021-12-09 Listing Removed — CPARMLS
- 2019-11-25 Sold (MLS) $144,000 CPARMLS
- 2019-09-30 Listed $144,000 CPARMLS
- 2018-10-24 Listing Removed — CPARMLS
- 2018-06-06 Listed $126,999 CPARMLS
- 2018-02-23 Listed $144,900 CPARMLS
- 2013-01-07 Sold (Public Records) $90,000 Public Records
- 2010-11-26 Listed $125,000 CPARMLS
- 2009-07-23 Listed $139,900 CPARMLS
- 2002-04-24 Sold (Public Records) $66,000 Public Records
- 1992-04-01 Sold (Public Records) $47,500 Public Records
- 1984-06-01 Sold (Public Records) $41,000 Public Records
Property tax history
+13.6%/yrLatest (2025): $2,905 · +5.2% YoY. Source: county tax records.
Cash-flow waterfall
monthlySold comps — $/sqft
last 12 mo · ≤1 miLoading sold comps…