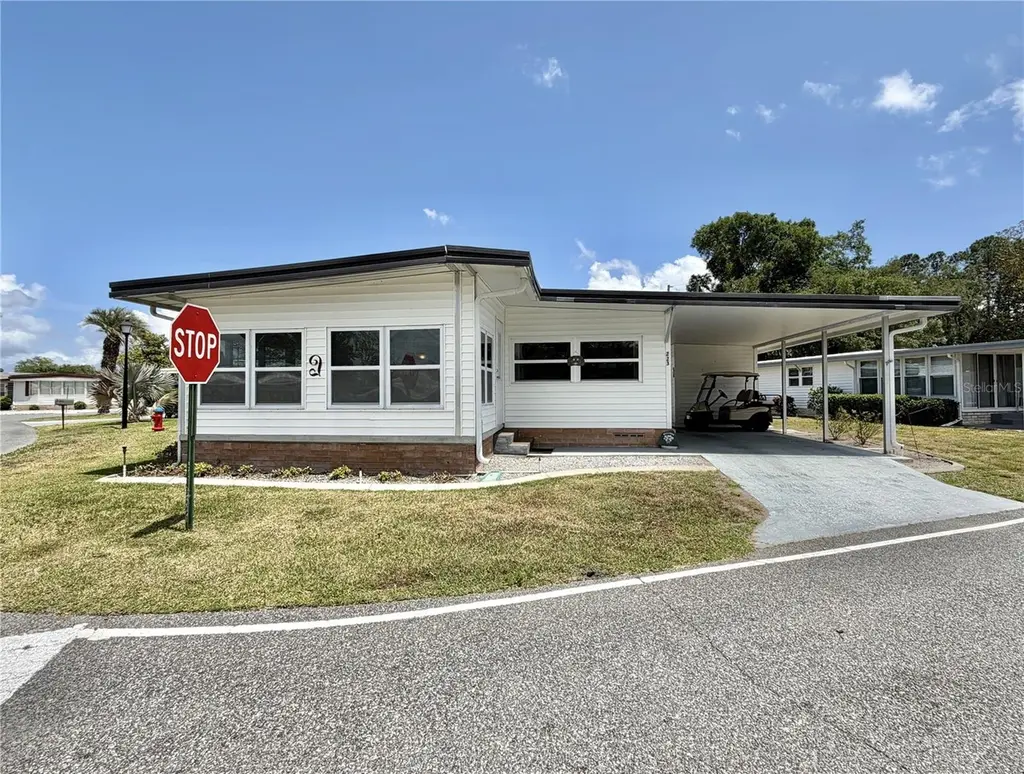
223 Hawthorne Blvd · Leesburg, FL
Flood risk 1/10 · Minimal
- FEMA flood zone
- X (unshaded)
- Chance of flooding over 30 yrs
- 0.0%
- Est. flood insurance / yr
- $507 – $1,088
Fire risk 3/10 · Minor
- Est. fire insurance / yr
- $947 – $1,759
Heat risk 8/10 · Major
- Hot days now (above 108°F)
- 7 days/yr
- Hot days in 30 yrs
- 22 days/yr
Wind risk 9/10 · Severe
- Chance of severe wind over 30 yrs
- 99.0%
Air-quality risk 2/10 · Minimal
- Unhealthy air days now
- 1 days/yr
- Unhealthy air days in 30 yrs
- 1 days/yr
Risk factors via First Street. Map © Google.
Why this score? — see what drove the F grade
The composite is a weighted blend of 9 inputs, each scored 0–100. Each bar is that input's sub-score; the figure is the points it added to the 100-point composite (weight × sub-score).
- ARV discount +9.2/15.0
- 1% rule +4.6/10.0
- Cash flow +4.2/30.0
- Schools +4.2/10.0
- Livability +3.1/5.0
- Condition / age +2.5/5.0
- Rent growth +2.3/5.0
- DSCR +0.0/10.0
- Appreciation +0.0/10.0
$119,000
🖨 Deal sheet (PDF) 📄 Offer letter ✓ Due diligence
Listing remarks
Welcome to your charming fully furnished retreat at Hawthorne Blvd, with a Bonus Golf Cart! Step inside to a spacious, thoughtfully designed floor plan where cozy carpeted living spaces and inviting bedrooms create a sense of comfort and ease. Natural light pours in through newer windows (2019), giving the home a bright, uplifting feel throughout the day. At the front of the home, the sunlit Florida room offers a special place to slow down and savor the moment, perfect for morning coffee, quiet reading, or gathering with friends in a relaxed, cheerful setting. The layout is both functional and comforting, featuring a walk-in shower in the master bath for a touch of everyday luxury, while th
Key facts
- Durable vinyl siding
- Florida room
- Waterfront community
Tags
Property features AI
Finance
- Other: Furnished; Association fee is required
- Financial info: Total monthly fees listed as $397; total annual fees listed as $4,764
- HOA & community: Member of Hawthorne Resident Cooperative Association, Inc.; Monthly HOA fee of $397 (includes cable TV, pool, grounds maintenance, management, private road, recreational facilities, sewer and water); Community amenities: clubhouse, fitness center, pool, tennis courts, pickleball, shuffleboard, spa/hot tub, trails, storage, recreation facilities, wheelchair access, street lights; golf carts allowed; Senior community; pets not allowed
Exterior
- Parking: Carport with 1 space
- Security: Gated community (community amenity)
- Utilities: Private water; Private sewer; Electricity connected; Cable connected; Fire hydrant on site; Water connected; Sewer connected
- Home design: Mobile home (double wide); One level; Northwest-facing
- Construction: Metal frame and wood frame construction with vinyl siding; Roof over
- Exterior features: Awnings; Exterior lighting; Private mailbox; Asphalt road
Interior
- Kitchen: Range; Microwave; Refrigerator; Exhaust fan; Electric water heater
- Bedrooms: 2 bedrooms
- Flooring: Carpet; Crawlspace foundation
- Bathrooms: 2 full bathrooms
- Heating & cooling: Central heating; Central air conditioning
- Interior features: Dining area; Thermostat; Window treatments
- Laundry & utility: Washer; Dryer; Laundry room
Neighborhood map
What this means for you Summary
Snapshot
- This is a 2-bed/2.0-bath manufactured listed at $119k.
Deal economics
- At list price, monthly cash flow is $-322 ($-4k/yr) — negative.
- To cash-flow at today's rent, offer at most $62k (47.7% below list).
- To meet the 1% rule (rent ≥ 1% of price), the offer needs to be $114k (4.2% below list).
- Recommended offer: $62k (47.7% below list) — sets the bar for cash-flow.
- Cap rate 3.0% vs local median 4.3% in Leesburg — below-typical yield; the buyer is paying a premium for something (appreciation thesis, condition, location) that the cap rate doesn't capture.
Location & tenants
- Location reads 62/100 on livability (#751 in FL) — a middle-class / working-renter tenant base. Strengths: cost of living A+, housing A+; Watch: crime D, amenities F, commute F.
- Lake (suburban): math 49% / reading 50% proficiency, ranked #37 of 73 in FL (top 51%) — families likely to look elsewhere, expect single-tenant / working-renter base with shorter leases.
- Zoned schools: Leesburg Elementary School (math 31% / reading 32%, grade F, #1,841 of 2,144 statewide, top 86%, 822 students, 71% FRL); Oak Park Middle School (math 32% / reading 36%, grade F, #426 of 571 statewide, top 75%, 575 students, 70% FRL); Leesburg High School (math 24% / reading 32%, grade F, #464 of 667 statewide, top 70%, 1,641 students, 58% FRL) — zoned schools average 66% FRL vs 49% district-wide (17 pts higher); higher-poverty schools than district average — tighter screening recommended.
- Zoned-school proficiency averages 31% at this address vs 50% district-wide (-18 pts) — the specific schools serving this property underperform the Lake average; the district grade overstates school quality for this exact location.
- Market conditions: Rents soft (-0.9%/yr); 804 active listings in the ZIP; 4,799 units permitted in Lake County in 2024 (814 in 5+ unit buildings).
Forward outlook
- Local home prices are declining (-3.0%/yr); year-one equity from $823 of loan paydown is wiped out by about $4k of value loss. Plan a longer hold.
- Lake County population projected at +37% by 2050 — long-run rental-demand tailwind backs the buy-and-hold thesis.
Negotiation context
- It's been on market 54 days — a 3% lower offer ($115k) is reasonable based on typical stale-listing flexibility.
Risks & watch-outs
- Watch-outs: HOA is 35% of rent.
- Climate carrying-cost: severe wind risk, 99% chance of damaging wind over 30y; extreme-heat days projected 7→22/yr by 2055 (HVAC capex compounding) — expect insurance premiums to compound above CPI over the hold.
Questions for the listing agent
- What do current leases actually rent for vs. the listed asking? Can we see a recent rent roll and the last 12 months of T-12 income?
- It's been on market 54 days. Have you received any prior offers? Is the seller open to a 48% concession, seller financing, or rate buy-down credit?
- Built in 1973 — when were the roof, HVAC, electrical panel, plumbing, and water heater last replaced?
- What does the HOA fee cover, when was the last increase, and are there any pending special assessments or reserve-fund shortfalls?
- Is there a deadline driving the sale (1031 exchange, divorce, estate, relocation)? That informs how much negotiation room exists.
- Schools are D-rated, which usually means shorter tenancies and higher turnover. Who's the typical renter profile here, and what's been the actual vacancy rate?
- Crime grade is D in this area — have there been break-ins, vandalism, or insurance claims at this property in the last 3 years? What carrier currently insures it and at what premium?
- The area grade is low — what's the realistic commute time and amenity access for the typical tenant pool here? Any planned neighborhood developments (good or bad) we should know about?
- What's the average days-on-market for RENTAL listings here right now (not sales)? A rising rental-DOM trend means longer vacancies and softer asking-rent achievability than the comps imply.
- What's the recent tenant-quality profile in this submarket — average credit score on applications, eviction rate, late-payment / NSF rate, and stable-employment percentage? A property-management company in the area should have these aggregated.
- How much new for-sale + rental construction is in the pipeline within 1–3 miles? Heavy new supply typically softens prices + rents 12–24 months out; constrained supply supports both.
Investment metrics
- 1% rule
- 0.96% ✗
- Cap rate
- 3.05%
- Cash-on-cash
- -11.58%
- DSCR
- 0.48
- GRM
- 8.7
CMA / ARV
- ARV (on-the-fly)
- $123,648
- Comps found
- 7
Show comp detail 7 sales within ~0.75 mi
| Address | Dist | Beds/Ba | Sqft | Sold | Price | $/sf | Match |
|---|---|---|---|---|---|---|---|
| 117 Dogwood Trl | 0.13mi | 2/2.0 | 1,152 (+4%) | 4mo | $165,000 | $143 | 84 |
| 202 Aspen Cir | 0.17mi | 2/2.0 | 1,176 (+6%) | 4mo | $95,000 | $81 | 78 |
| 115 Bougainvillea Dr | 0.30mi | 2/2.0 | 1,200 (+9%) | 0mo | $142,000 | $118 | 71 |
| 129 Dogwood Trl | 0.19mi | 2/2.0 | 1,024 (-7%) | 12mo | $115,000 | $112 | 69 |
| 129 Hibiscus Way | 0.34mi | 2/2.0 | 1,200 (+9%) | 8mo | $112,500 | $94 | 63 |
| 145 Royal Palm Dr | 0.46mi | 2/2.0 | 1,266 (+15%) | 1mo | $45,000 | $36 | 53 |
| 28426 Helena Run Dr | 0.64mi | 2/2.0 | 1,064 (-4%) | 19mo | $154,900 | $146 | 48 |
Match score weights: distance 35% · size 25% · config 20% · recency 20%. Top-matched comps best support the ARV.
Projected returns pro-forma
-3.0% appreciation · 0.0% rent growth · sell at horizon
- IRR
- -43.1%
- Equity multiple
- -0.29×
- Total profit
- $-42,846
- Equity at exit
- $17,743
- IRR
- —
- Equity multiple
- -1.27×
- Total profit
- $-75,529
- Equity at exit
- $10,289
Cash invested: $33,320 (down + closing). Projections, not guarantees.
Landlord ↔ Tenant lean methodology
- Overall (STATE)
- 87 Strongly Landlord-Friendly
- State Florida
- 87 Strongly Landlord-Friendly · R+3
- County
- — inherits STATE
- City
- — inherits STATE
ZIP-level market 34748
- Home prices YoY
- -25.3%
- Rents YoY
- -0.9%
- Active inventory
- 804
- Price-to-rent
- 8.7×
Monthly cashflow live
- Estimated rent
- $1,140 medium interval (Pro) →
- Mortgage (P&I)
- −$624
- Tax from tax record
- −$152 /mo · $1,818/yr
- Insurance
- −$50
- HOA
- −$397
- Lot rent leased land?
- −$0
- Vacancy / Maint / Mgmt
- −$239
- Net cashflow
- $-322
Break-even live
Sensitivity live
| Price | -10% $-254 | -5% $-288 | +0% $-322 | +5% $-355 | +10% $-389 |
|---|---|---|---|---|---|
| Rent | -10% $-412 | -5% $-367 | +0% $-322 | +5% $-277 | +10% $-232 |
| Rate | -1.0pp $-262 | -0.5pp $-291 | base $-322 | +0.5pp $-352 | +1.0pp $-384 |
UW: 25.0% down · 7.5% · 30yr · 1.5% tax · 5.0% vac · 8.0% maint · 8.0% mgmt
Financing live
Cash to close
- Down payment
- $29,750
- Closing costs
- $3,570
- Reserves months
- —
- Total cash needed
- —
Loan-product check · same deal, 3 products live
Conventional
25% down · 7.5% · 30yr
- Down + closing
- —
- Monthly P&I
- —
- Monthly cashflow
- —
- DSCR
- —
- Eligible?
- —
Personal DTI + credit; lowest rate.
DSCR
20% down · 8.5% · 30yr
- Down + closing
- —
- Monthly P&I
- —
- Monthly cashflow
- —
- DSCR
- —
- Eligible?
- —
No personal income docs; deal must DSCR.
Hard money
10% down · 12.0% · 12mo
- Down + closing
- —
- Monthly P&I
- —
- Monthly cashflow
- —
- DSCR
- —
- Eligible?
- —
Short-term bridge; refi at stabilization.
HOA detail
- Monthly dues
- $397 · $4,764/yr
Listing history 16 events
-
2026-06-22days on market $119,000 Active 54 DOM
-
2026-06-21days on market $119,000 Active 53 DOM
-
2026-06-18days on market $119,000 Active 50 DOM
-
2026-06-17days on market $119,000 Active 49 DOM
-
2026-06-16days on market $119,000 Active 48 DOM
-
2026-06-15days on market $119,000 Active 47 DOM
-
2026-06-13days on market $119,000 Active 45 DOM
-
2026-06-09days on market $119,000 Active 41 DOM
-
2026-06-08days on market $119,000 Active 40 DOM
-
2026-06-07days on market $119,000 Active 39 DOM
-
2026-06-04days on market $119,000 Active 36 DOM
-
2026-06-03days on market $119,000 Active 35 DOM
-
2026-06-02days on market $119,000 Active 34 DOM
-
2026-06-01days on market $119,000 Active 33 DOM
-
2026-05-31days on market $119,000 Active 32 DOM
-
2026-04-30$119,000 Active
ⓘ Source: listings_history table (triggers on properties + properties_extension) + one-shot
backfill from property_details.listing_events for pre-trigger history.
Tax reassessment forecast FL · Resets to sale price
- Current annual tax
- $1,818 · $152/mo
- Projected year-2 tax
- $1,818 · $152/mo
- Expected delta
- $0/yr ($0/mo · 0.0%)
ⓘ Screening estimate from a state-policy table — verify with the county assessor before closing.
Climate risk First Street
- Flood 1/10 Low FEMA zone X (unshaded) · 0% chance over 30 yrs
- Wildfire 3/10 Moderate
- Heat 8/10 Severe 7 d/yr ≥108°F today · 22 d/yr by 30 yrs out
- Wind 9/10 Extreme 99% chance of damaging wind over 30 yrs
- Air quality 2/10 Low 1 unhealthy d/yr today · 1 by 30 yrs out
Nearby sold comps map
Loading sold comps map…
Walkable amenities ~0.75 mi
Loading nearby amenities…
Taxation est. · year 1
- Rental income
- $13,679
- − Mortgage interest
- −$6,666
- − Property taxes
- −$1,818
- − Insurance
- −$595
- − Repairs & maintenance
- −$1,094
- − Management
- −$1,094
- − HOA
- −$4,764
- − Depreciation
- −$3,462
- Taxable loss
- −$5,815
- Est. tax savings @ 24.0%
- +$1,396
- After-tax cash flow
- $-2,464/yr
For passive investors: Depreciation is non-cash, so a rental often shows a tax loss while cash-flowing — sheltering income. Rental losses are passive: they offset passive income freely, and up to $25,000/yr can offset ordinary (W-2) income if you actively participate and your MAGI is under $100k (phasing out to $0 by $150k); unused losses carry forward. On sale, claimed depreciation is recaptured at up to 25%, and gains may owe capital-gains tax (a 1031 exchange can defer both). Figures are a year-1 estimate at your 24.0% rate — not tax advice; consult a CPA.
Schools (NCES district)
- District
- Lake
- NCES district ID
- 1201050
- Math proficiency
- 49% ▼ -7.00%
- Reading proficiency
- 50% ▼ -4.00%
- Median HH income
- $46,632
- Composite
- 42.05/100
- National rank
- #3327
- State rank
- #37 of 73 in FL
Livability — Leesburg
- Score
- 62/100
- State rank
- #751
- US rank
- #16429
Category grades
Schools grade is shown separately in the Schools card above.
Census & demographics
- County
- Lake County · 364,602 people
- City population
- 70,232
- Metro
- Orlando-Kissimmee-Sanford, FL
- Population (ZIP)
- 48,095
- Household income
- $58,192
- Rent vs Own
- Severe rent burden
- 1745.0
Population outlook (Lake County) Hauer SSP2
- Today (2025)
- 386,640 people
- By 2030
- 417,107 · +7.9%
- By 2040
- 476,676 · +23.3%
- By 2050
- 531,296 · +37.4%
- By 2075
- 648,303 · +67.7%
- By 2100
- 698,530 · +80.7%
Race, ethnicity, and origin ACS 2023
- Neighborhood character
- Majority White (64%)
- Race & ethnicity
- White 64% Black 16% Hispanic / Latino 15% Two or more races 9% Asian 1%
- Hispanic origin (detail)
- Mexican 4% Puerto Rican 5% Cuban 3%
- Common ancestry
- Romanian 3% Lithuanian 3% Slovak 2%
- Foreign-born
- 9% · Canada, Vietnam, Jamaica
- Languages at home
- 88% English-only · Spanish 10% French/Haitian/Cajun 1%
Political lean MEDSL · Lake
- 2024 margin
- Strong R (+24.7) · D 37.3% · R 62.0%
- 2008→2024 swing
- -11.2pp toward R · 2008: -13.5pp · 2024: -24.7pp
- All cycles
- 2024: R+24.7 2020: R+20.0 2016: R+23.1 2012: R+17.1 2008: R+13.5
Not yet ingested
- Civics
- —
Market trends
- HPI YoY
- ▼ -88.97%
- Current HPI
- 262.1766
- Rent YoY
- ▼ -0.95%
- Metro
- Orlando-Kissimmee-Sanford, FL
- State GDP YoY
- ▲ 3.28%
- F500 in state
- 36
Industry mix (Fortune 500 HQ in FL)
| Industry | F500 HQs | Revenue |
|---|---|---|
| Industrial Technology | 2 | $29B |
|
||
| Insurance | 2 | $17B |
|
||
| Retail | 1 | $60B |
|
||
| Technology Distribution | 1 | $58B |
|
||
| Homebuilding | 1 | $35B |
|
||
| Technology Manufacturing | 1 | $35B |
|
||
Price history
1 event — show timeline
- 2026-04-30 Listed $119,000 Stellar MLS as Distributed by MLS Grid
Property tax history
+8.6%/yrLatest (2025): $1,818 · +3.8% YoY. Source: county tax records.
Cash-flow waterfall
monthlySold comps — $/sqft
last 12 mo · ≤1 miLoading sold comps…