 🏗️ New Construction
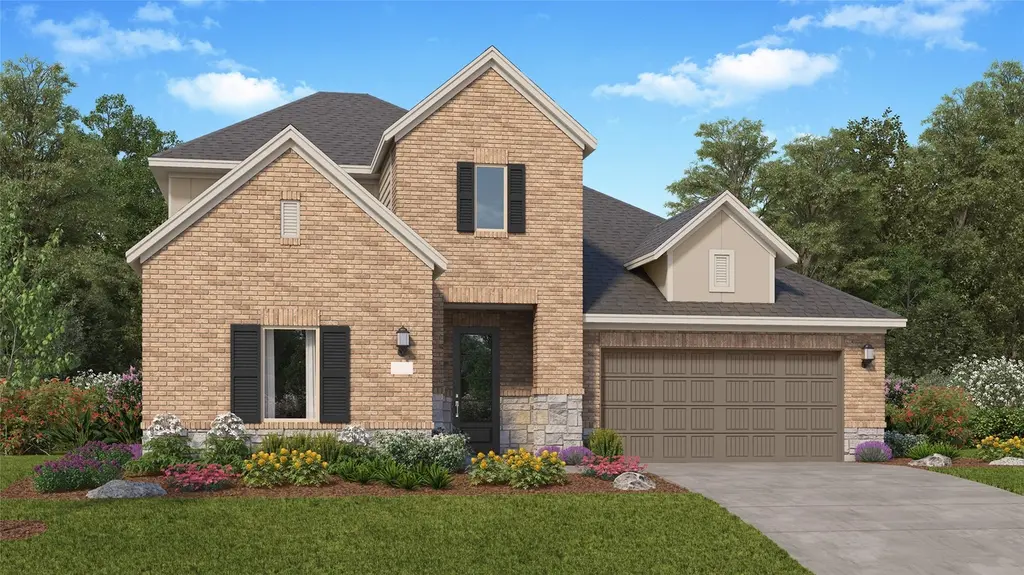
15063 Goujon Gates Dr · Porter Heights, TX
Flood risk No data
- FEMA flood zone
- —
- Chance of flooding over 30 yrs
- —
- Est. flood insurance / yr
- —
Fire risk No data
- Est. fire insurance / yr
- —
Heat risk No data
- Hot days now (above threshold)
- —
- Hot days in 30 yrs
- —
Wind risk No data
- Chance of severe wind over 30 yrs
- —
Air-quality risk No data
- Unhealthy air days now
- —
- Unhealthy air days in 30 yrs
- —
Risk factors via First Street. Map © Google.
Why this score? — see what drove the F grade
The composite is a weighted blend of 9 inputs, each scored 0–100. Each bar is that input's sub-score; the figure is the points it added to the 100-point composite (weight × sub-score).
- ARV discount +7.5/15.0
- Cash flow +6.7/30.0
- Schools +5.1/10.0
- Rent growth +3.3/5.0
- Livability +3.2/5.0
- Condition / age +2.5/5.0
- DSCR +1.0/10.0
- 1% rule +0.9/10.0
- Appreciation +0.0/10.0
$328,991
🖨 Deal sheet (PDF) 📄 Offer letter ✓ Due diligence
Listing remarks
The Somerset Floor Plan - The first level of this two-story home is host to a generous open floorplan shared between the kitchen, dining room and family room. The covered patio is great for entertaining guests. Also on the first floor is a secondary bedroom and office off the entry, as well as the owner’s suite at the back of the home. Two more secondary bedrooms are situated upstairs, surrounding a versatile game room. The completion date, prices and features may vary and are subject to change. Please verify with Lennar directly. Photos are for illustrative purposes only.
Key facts
- Secondary bedroom
- Open floorplan
- Covered patio
Tags
Property features AI
Finance
- HOA & community: Community association: C.I.A. Services; Annual association fee of $1,185
Exterior
- Parking: Attached garage
- Utilities: Public water; Public sewer
- Home design: Residential property; Under construction (new construction); Slab foundation
- Construction: Built in 2026; Brick and stucco construction; Composition roof
- Exterior features: Back yard fence; Subdivision lot
Interior
- Kitchen: Dishwasher; Electric oven; Electric range; Gas oven; Gas range
- Bedrooms: Total rooms: 8
- Flooring: Carpet; Vinyl
- Bathrooms: 3 full bathrooms; 1 half bathroom
- Heating & cooling: Central heating (electric and gas); Central air (electric and gas)
- Interior features: Breakfast bar; Double vanity; Kitchen open to family room; Primary bedroom with private bath; Separate shower; Tub with shower
- Laundry & utility: Washer hookup; Electric dryer hookup; Gas dryer hookup
Neighborhood map
What this means for you Summary
Snapshot
- This is a 4-bed/3.5-bath land listed at $329k.
Deal economics
- At list price, monthly cash flow is $-669 ($-8k/yr) — negative.
- To cash-flow at today's rent, offer at most $305k (7.2% below list).
- To meet the 1% rule (rent ≥ 1% of price), the offer needs to be $251k (23.8% below list).
- Recommended offer: $251k (23.8% below list) — sets the bar for 1% rule.
- Cap rate 4.4% vs local median 2.5% in Porter Heights — top-decile yield for the area; either an underpriced asset or a hidden risk that comps aren't pricing in. Stress-test before assuming the spread holds.
Location & tenants
- Location reads 65/100 on livability (#663 in TX) — a middle-class / working-renter tenant base. Strengths: crime A+, employment A+, cost of living A+; Watch: amenities F, commute F, health & safety F.
- Conroe ISD (other): math 57% / reading 57% proficiency, ranked #69 of 826 in TX (top 8%) — acceptable for families but not a draw, mixed tenant base, ~2y average lease.
- Zoned schools: San Jacinto El (math 35% / reading 37%, grade F, #1,921 of 4,322 statewide, top 45%, 547 students, 81% FRL); Caney Creek H S (math 33% / reading 42%, grade F, #888 of 1,632 statewide, top 55%, 2,504 students, 79% FRL) — zoned schools average 80% FRL vs 34% district-wide (46 pts higher); higher-poverty schools than district average — tighter screening recommended.
- Zoned-school proficiency averages 37% at this address vs 57% district-wide (-20 pts) — the specific schools serving this property underperform the Conroe ISD average; the district grade overstates school quality for this exact location.
- Market conditions: Rents rising (+3.3%/yr); 1111 active listings in the ZIP; solid renter incomes; 13,259 units permitted in Montgomery County in 2024 (1,402 in 5+ unit buildings).
- This rent runs 36% of the median local income ($85k/yr) — at the standard rent-burdened threshold; future hikes will face affordability resistance.
Forward outlook
- Local home prices are declining (-3.0%/yr); year-one equity from $3k of loan paydown is wiped out by about $13k of value loss. Plan a longer hold.
- Montgomery County population projected at +65% by 2050 — long-run rental-demand tailwind backs the buy-and-hold thesis.
Negotiation context
- It's been on market 21 days — a 2% lower offer ($324k) is reasonable based on typical stale-listing flexibility.
- 2 sale attempts with the ask held roughly flat each time — persistent listings suggest the price (not the market) is what's stuck; bring a comps-based counter.
Questions for the listing agent
- What do current leases actually rent for vs. the listed asking? Can we see a recent rent roll and the last 12 months of T-12 income?
- What does the HOA fee cover, when was the last increase, and are there any pending special assessments or reserve-fund shortfalls?
- Is there a deadline driving the sale (1031 exchange, divorce, estate, relocation)? That informs how much negotiation room exists.
- Schools are F-rated, which usually means shorter tenancies and higher turnover. Who's the typical renter profile here, and what's been the actual vacancy rate?
- The area grade is low — what's the realistic commute time and amenity access for the typical tenant pool here? Any planned neighborhood developments (good or bad) we should know about?
- What's the average days-on-market for RENTAL listings here right now (not sales)? A rising rental-DOM trend means longer vacancies and softer asking-rent achievability than the comps imply.
- What's the recent tenant-quality profile in this submarket — average credit score on applications, eviction rate, late-payment / NSF rate, and stable-employment percentage? A property-management company in the area should have these aggregated.
- How much new for-sale + rental construction is in the pipeline within 1–3 miles? Heavy new supply typically softens prices + rents 12–24 months out; constrained supply supports both.
Investment metrics
- 1% rule
- 0.59% ✗
- Cap rate
- 4.40%
- Cash-on-cash
- -6.77%
- DSCR
- 0.70
- GRM
- 14.1
CMA / ARV
- ARV (median comp)
- $423,567
- List price
- $328,991
- Delta
- -22.33%
- Verdict
- UNDERPRICED
- Comps
- 20 within 1.0 mi
Projected returns pro-forma
-3.0% appreciation · 3.3% rent growth · sell at horizon
- IRR
- -27.8%
- Equity multiple
- 0.07×
- Total profit
- $-110,612
- Equity at exit
- $63,155
- IRR
- -25.6%
- Equity multiple
- -0.25×
- Total profit
- $-148,579
- Equity at exit
- $36,622
Cash invested: $118,599 (down + closing). Projections, not guarantees.
Landlord ↔ Tenant lean methodology
- Overall (STATE)
- 87 Strongly Landlord-Friendly
- State Texas
- 87 Strongly Landlord-Friendly · R+5
- County
- — inherits STATE
- City
- — inherits STATE
ZIP-level market 77302
- Rents YoY
- 3.3%
- Active inventory
- 1111
- Price-to-rent
- 10.9×
Monthly cashflow live
- Estimated rent
- $2,508 medium interval (Pro) →
- Mortgage (P&I)
- −$2,221
- Tax from tax record
- −$154 /mo · $1,846/yr
- Insurance
- −$176
- HOA
- −$99
- Vacancy / Maint / Mgmt
- −$527
- Net cashflow
- $-669
Break-even live
Sensitivity live
| Price | -10% $-429 | -5% $-549 | +0% $-669 | +5% $-789 | +10% $-909 |
|---|---|---|---|---|---|
| Rent | -10% $-867 | -5% $-768 | +0% $-669 | +5% $-570 | +10% $-471 |
| Rate | -1.0pp $-456 | -0.5pp $-561 | base $-669 | +0.5pp $-779 | +1.0pp $-890 |
UW: 25.0% down · 7.5% · 30yr · 1.5% tax · 5.0% vac · 8.0% maint · 8.0% mgmt
Financing live
Cash to close
- Down payment
- $105,892
- Closing costs
- $12,707
- Reserves months
- —
- Total cash needed
- —
Loan-product check · same deal, 3 products live
Conventional
25% down · 7.5% · 30yr
- Down + closing
- —
- Monthly P&I
- —
- Monthly cashflow
- —
- DSCR
- —
- Eligible?
- —
Personal DTI + credit; lowest rate.
DSCR
20% down · 8.5% · 30yr
- Down + closing
- —
- Monthly P&I
- —
- Monthly cashflow
- —
- DSCR
- —
- Eligible?
- —
No personal income docs; deal must DSCR.
Hard money
10% down · 12.0% · 12mo
- Down + closing
- —
- Monthly P&I
- —
- Monthly cashflow
- —
- DSCR
- —
- Eligible?
- —
Short-term bridge; refi at stabilization.
HOA detail
- Monthly dues
- $99 · $1,188/yr
Listing history 18 events
-
2026-06-07status $328,991 Pending 21 DOM
-
2026-06-04days on market $328,991 Active 21 DOM
-
2026-06-03days on market $328,991 Active 20 DOM
-
2026-06-02days on market $328,991 Active 19 DOM
-
2026-06-01days on market $328,991 Active 18 DOM
-
2026-05-31days on market $328,991 Active 17 DOM
-
2026-05-14$328,991 Active 585-char remark
-
2026-05-14historical
-
2026-05-05price $328,991
-
2026-04-28price $328,990
-
2026-04-28price $328,990
-
2026-04-24price $333,440
-
2026-04-23price $333,440
-
2026-04-04price $342,440
-
2026-04-03price $342,440
-
2026-02-13$354,990 Active
-
2026-01-21price $354,990
-
2026-01-21$427,990 Active
ⓘ Source: listings_history table (triggers on properties + properties_extension) + one-shot
backfill from property_details.listing_events for pre-trigger history.
Tax reassessment forecast TX · Resets to sale price
- Current annual tax
- $1,846 · $154/mo
- Projected year-2 tax
- $6,021 · $502/mo
- Expected delta
- +$4,175/yr (+$348/mo · 226.2%)
ⓘ Screening estimate from a state-policy table — verify with the county assessor before closing.
Nearby sold comps map
Loading sold comps map…
Walkable amenities ~0.75 mi
Loading nearby amenities…
Taxation est. · year 1
- Rental income
- $30,101
- − Mortgage interest
- −$23,726
- − Property taxes
- −$1,846
- − Insurance
- −$2,118
- − Repairs & maintenance
- −$2,408
- − Management
- −$2,408
- − HOA
- −$1,188
- − Depreciation
- −$12,322
- Taxable loss
- −$15,915
- Est. tax savings @ 24.0%
- +$3,820
- After-tax cash flow
- $-4,207/yr
For passive investors: Depreciation is non-cash, so a rental often shows a tax loss while cash-flowing — sheltering income. Rental losses are passive: they offset passive income freely, and up to $25,000/yr can offset ordinary (W-2) income if you actively participate and your MAGI is under $100k (phasing out to $0 by $150k); unused losses carry forward. On sale, claimed depreciation is recaptured at up to 25%, and gains may owe capital-gains tax (a 1031 exchange can defer both). Figures are a year-1 estimate at your 24.0% rate — not tax advice; consult a CPA.
Schools (NCES district)
- District
- Conroe ISD
- NCES district ID
- 4815000
- Math proficiency
- 57% ▼ -6.00%
- Reading proficiency
- 57% ▼ -1.00%
- Median HH income
- $71,541
- Composite
- 50.65/100
- National rank
- #1833
- State rank
- #69 of 826 in TX
Livability — Porter Heights
- Score
- 65/100
- State rank
- #663
- US rank
- #12479
Category grades
Schools grade is shown separately in the Schools card above.
Census & demographics
- County
- Montgomery County · 663,713 people
- Metro
- Houston-The Woodlands-Sugar Land, TX
- Population (ZIP)
- 21,546
- Household income
- $84,673
- Rent vs Own
- Severe rent burden
- 205.0
Population outlook (Montgomery County) Hauer SSP2
- Today (2025)
- 713,896 people
- By 2030
- 805,263 · +12.8%
- By 2040
- 992,708 · +39.1%
- By 2050
- 1,179,590 · +65.2%
- By 2075
- 1,628,084 · +128.1%
- By 2100
- 1,937,880 · +171.5%
Race, ethnicity, and origin ACS 2023
- Neighborhood character
- Majority White (63%)
- Race & ethnicity
- White 63% Hispanic / Latino 29% Two or more races 19% Black 3% Asian 1%
- Hispanic origin (detail)
- Mexican 26% Puerto Rican 1%
- Common ancestry
- Lithuanian 3% Italian 2% Slovak 2%
- Foreign-born
- 13% · Canada, Vietnam, China
- Languages at home
- 78% English-only · Spanish 20% Russian/Polish/Slavic 1% Other Indo-European 0%
Political lean MEDSL · Montgomery
- 2024 margin
- Solid R (+45.5) · D 26.8% · R 72.3%
- 2008→2024 swing
- +7.2pp toward D · 2008: -52.7pp · 2024: -45.5pp
- All cycles
- 2024: R+45.5 2020: R+43.8 2016: R+51.4 2012: R+60.7 2008: R+52.7
Not yet ingested
- Civics
- —
Market trends
- HPI YoY
- ▼ -187.56%
- Current HPI
- 262.1879
- Rent YoY
- ▲ 3.30%
- Metro
- Houston-The Woodlands-Sugar Land, TX
- State GDP YoY
- ▲ 3.95%
- F500 in state
- 110
Industry mix (Fortune 500 HQ in TX)
| Industry | F500 HQs | Revenue |
|---|---|---|
| Energy | 16 | $1,198B |
|
||
| Technology | 5 | $198B |
|
||
| Engineering / Construction | 4 | $72B |
|
||
| Energy Services | 3 | $60B |
|
||
| Utilities | 3 | $41B |
|
||
| Healthcare | 2 | $330B |
|
||
Price history
-23.1% since first listed8 events — show timeline
- 2026-06-05 Pending — HARMLS
- 2026-05-14 Listing Removed — HARMLS
- 2026-05-14 Listed $328,991 HARMLS
- 2026-04-28 Price Changed $328,990 HARMLS
- 2026-04-23 Price Changed $333,440 HARMLS
- 2026-04-03 Price Changed $342,440 HARMLS
- 2026-01-21 Price Changed $354,990 HARMLS
- 2026-01-21 Listed $427,990 HARMLS
Cash-flow waterfall
monthlySold comps — $/sqft
last 12 mo · ≤1 miLoading sold comps…