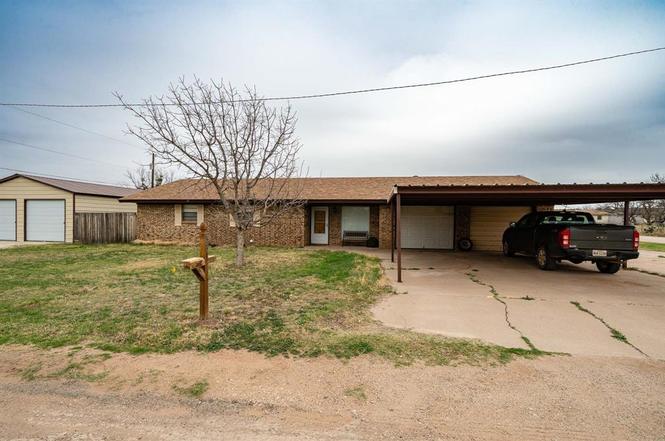
531 Avenue N N · Anson, TX
Flood risk 4/10 · Minor
- FEMA flood zone
- A
- Chance of flooding over 30 yrs
- 0.21%
- Est. flood insurance / yr
- $1,009 – $1,996
Fire risk 4/10 · Minor
- Est. fire insurance / yr
- $1,222 – $2,270
Heat risk 7/10 · Major
- Hot days now (above 106°F)
- 7 days/yr
- Hot days in 30 yrs
- 20 days/yr
Wind risk 4/10 · Minor
- Chance of severe wind over 30 yrs
- 10.0%
Air-quality risk 1/10 · Minimal
- Unhealthy air days now
- 0 days/yr
- Unhealthy air days in 30 yrs
- 0 days/yr
Risk factors via First Street. Map © Google.
Why this score? — see what drove the B- grade
The composite is a weighted blend of 9 inputs, each scored 0–100. Each bar is that input's sub-score; the figure is the points it added to the 100-point composite (weight × sub-score).
- Cash flow +30.0/30.0
- 1% rule +10.0/10.0
- DSCR +10.0/10.0
- Appreciation +7.1/10.0
- Livability +3.5/5.0
- Schools +2.8/10.0
- Rent growth +2.5/5.0
- Condition / age +2.5/5.0
- ARV discount +0.0/15.0
$189,900
🖨 Deal sheet (PDF) 📄 Offer letter ✓ Due diligence
Listing remarks
Charming 3-Bedroom Home with Shop! This 3-bedroom, 2-bath home offers comfort, space, and excellent potential. Located close to schools in the highly regarded Anson school district, this property is perfect for families, first-time buyers, or anyone looking to enjoy the slower pace of small town living. The home is in solid condition and well maintained, providing a great foundation for buyers who want to add their own style with cosmetic updates. With a functional layout and generous living spaces, it's easy to imagine transforming this house into your dream home. Outside, you'll find plenty of parking and workspace options. In addition to the attached two car garage, there is a two-car ca
Key facts
- Insulated metal shop
- Functional layout
- 0.33 acre lot
Tags
Property features AI
Finance
- Other: Directions: From Hwy 277 in Anson turn west on 6th Street; house is on the corner of 6th and Ave N.
- Financial info: Listing terms: Cash or Conventional; Listing agreement: Exclusive Agency; Second mortgage: No
- HOA & community: No homeowners association
Exterior
- Parking: Attached carport; Carport (2 spaces); Covered parking (4 covered spaces); 2-car garage; garage faces front
- Utilities: City water; City sewer; Not in a municipal utility district
- Home design: Single family residence; Residential property; One-story; Accessory unit present; Preowned (built in 1979); Property attached
- Construction: Brick construction; Composition roof; Slab foundation; Year built 1979
- Exterior features: Covered porch(es); Covered, enclosed rear porch; Chain link fence; Corner, level lot; Workshop with electric
Interior
- Kitchen: Electric oven
- Bedrooms: 3 bedrooms; Primary bedroom on main level with ensuite bath
- Flooring: Carpet
- Bathrooms: 2 full bathrooms
- Heating & cooling: Central heating; Central air conditioning
- Interior features: Eat-in kitchen; High-speed internet available; One living area; One dining area; Room count includes 2 main rooms
- Laundry & utility: Utility room
Neighborhood map
What this means for you Summary
Snapshot
- This is a 3-bed/2.0-bath single-family listed at $190k.
Deal economics
- At list price, monthly cash flow is $957 ($11k/yr) — positive.
- The deal already cash-flows at list — no discount required.
- Meets the 1% rule at list price ($3k rent vs $190k).
- Recommended offer: $179k (6.0% below list) — sets the bar for market timing.
Location & tenants
- Location reads 70/100 on livability (#377 in TX) — a middle-class / working-renter tenant base. Strengths: crime A+, cost of living A+, housing A-; Watch: health & safety C-, employment D, amenities F.
- Anson ISD (rural): math 29% / reading 37% proficiency, ranked #565 of 826 in TX (top 68%) — families likely to look elsewhere, expect single-tenant / working-renter base with shorter leases.
- Zoned schools: Anson El (math 17% / reading 32%, grade F, #3,052 of 4,322 statewide, top 74%, 368 students, 68% FRL); Anson Middle (math 37% / reading 37%, grade F, #756 of 1,662 statewide, top 47%, 167 students, 65% FRL); Anson H S (math 47% / reading 44%, grade D-, #630 of 1,632 statewide, top 39%, 217 students, 51% FRL).
- Market conditions: 73 active listings in the ZIP; 1 units permitted in Jones County in 2024 (0 in 5+ unit buildings).
Forward outlook
- In year one you build about $9k of equity ($1k loan paydown + $8k appreciation (4.1% local appreciation)).
- Jones County population projected at +13% by 2050 — modest demand growth; plan on rents tracking national, not racing it.
- At projected returns (4.1% appreciation + 3.0% rent growth), your $53k cash investment doubles in ~3 years — after that, you're playing with house money.
- By year 4, paydown + projected appreciation supports a ~$31k cash-out refi (75% LTV) — recoverable capital for the next deal without selling this one.
Negotiation context
- It's been on market 68 days — a 6% lower offer ($179k) is reasonable based on typical stale-listing flexibility.
Risks & watch-outs
- Watch-outs: flood insurance adds $125/mo.
- Climate carrying-cost: in FEMA flood zone A (mandatory federal flood insurance); extreme-heat days projected 7→20/yr by 2055 (HVAC capex compounding) — expect insurance premiums to compound above CPI over the hold.
Questions for the listing agent
- It's been on market 68 days. Have you received any prior offers? Is the seller open to a 6% concession, seller financing, or rate buy-down credit?
- Built in 1979 — when were the roof, HVAC, electrical panel, plumbing, and water heater last replaced?
- What's the actual annual flood-insurance premium (NFIP or private), and is the property in a SFHA with mandatory coverage?
- Why hasn't it sold? Are there any deal-killer items the seller is aware of (foundation, flood, title, zoning, code violations)?
- Is there a deadline driving the sale (1031 exchange, divorce, estate, relocation)? That informs how much negotiation room exists.
- Schools are D-rated, which usually means shorter tenancies and higher turnover. Who's the typical renter profile here, and what's been the actual vacancy rate?
- What's the average days-on-market for RENTAL listings here right now (not sales)? A rising rental-DOM trend means longer vacancies and softer asking-rent achievability than the comps imply.
- What's the recent tenant-quality profile in this submarket — average credit score on applications, eviction rate, late-payment / NSF rate, and stable-employment percentage? A property-management company in the area should have these aggregated.
- How much new for-sale + rental construction is in the pipeline within 1–3 miles? Heavy new supply typically softens prices + rents 12–24 months out; constrained supply supports both.
Investment metrics
- 1% rule
- 1.64% ✓
- Cap rate
- 13.13%
- Cash-on-cash
- 24.41%
- DSCR
- 2.09
- GRM
- 5.1
CMA / ARV
- ARV (on-the-fly)
- $134,280
- Comps found
- 12
Show comp detail 12 sales within ~0.75 mi
| Address | Dist | Beds/Ba | Sqft | Sold | Price | $/sf | Match |
|---|---|---|---|---|---|---|---|
| 531 Avenue N N | 0.00mi | 3/2.0 | 1,492 (0%) | 1mo | $189,900 | $127 | 99 |
| 715 Avenue J | 0.59mi | 3/2.0 | 1,538 (+3%) | 1mo | $249,999 | $163 | 67 |
| 1520 Avenue N | 0.44mi | 3/2.0 | 1,574 (+6%) | 10mo | $60,000 | $38 | 62 |
| 1311 Westover Dr | 0.50mi | 3/2.0 | 1,356 (-9%) | 2mo | $189,000 | $139 | 60 |
| 1921 Avenue O | 0.64mi | 3/2.0 | 1,384 (-7%) | 1mo | $70,000 | $51 | 57 |
| 1331 Avenue N | 0.35mi | 2/1.0 (-1) | 1,334 (-11%) | 2mo | $120,000 | $90 | 55 |
| 1720 Avenue K | 0.64mi | 2/1.0 (-1) | 1,553 (+4%) | 5mo | $74,900 | $48 | 50 |
| 414 Commercial Ave | 0.58mi | 3/2.0 | 1,336 (-10%) | 9mo | $159,900 | $120 | 48 |
| 1301 Avenue I | 0.67mi | 3/1.5 | 1,340 (-10%) | 6mo | $65,000 | $49 | 45 |
| 400 Commercial Ave | 0.61mi | 3/1.0 | 1,277 (-14%) | 4mo | $157,500 | $123 | 40 |
| 801 Avenue J | 0.57mi | 2/1.0 (-1) | 1,296 (-13%) | 9mo | $69,900 | $54 | 35 |
| 223 Avenue L | 0.61mi | 4/1.0 (+1) | 1,280 (-14%) | 8mo | $98,000 | $77 | 32 |
Match score weights: distance 35% · size 25% · config 20% · recency 20%. Top-matched comps best support the ARV.
Projected returns pro-forma
4.13% appreciation · 3.0% rent growth · sell at horizon
- IRR
- 30.1%
- Equity multiple
- 2.80×
- Total profit
- $95,577
- Equity at exit
- $97,743
- IRR
- 29.5%
- Equity multiple
- 5.54×
- Total profit
- $241,452
- Equity at exit
- $161,044
Cash invested: $53,172 (down + closing). Projections, not guarantees.
Landlord ↔ Tenant lean methodology
- Overall (STATE)
- 87 Strongly Landlord-Friendly
- State Texas
- 87 Strongly Landlord-Friendly · R+5
- County
- — inherits STATE
- City
- — inherits STATE
ZIP-level market 79501
- Home prices YoY
- 2.9%
- Active inventory
- 73
- Price-to-rent
- 5.1×
Monthly cashflow live
- Estimated rent
- $3,109 medium interval (Pro) →
- Mortgage (P&I)
- −$996
- Tax from tax record
- −$299 /mo · $3,590/yr
- Insurance
- −$79
- Flood insurance flood zone
- −$125 /mo · $1,502/yr
- HOA
- −$0
- Vacancy / Maint / Mgmt
- −$653
- Net cashflow
- $957
Break-even live
Sensitivity live
| Price | -10% $1,064 | -5% $1,010 | +0% $957 | +5% $903 | +10% $849 |
|---|---|---|---|---|---|
| Rent | -10% $711 | -5% $834 | +0% $957 | +5% $1,079 | +10% $1,202 |
| Rate | -1.0pp $1,052 | -0.5pp $1,005 | base $957 | +0.5pp $907 | +1.0pp $857 |
UW: 25.0% down · 7.5% · 30yr · 1.5% tax · 5.0% vac · 8.0% maint · 8.0% mgmt
Financing live
Cash to close
- Down payment
- $47,475
- Closing costs
- $5,697
- Reserves months
- —
- Total cash needed
- —
Loan-product check · same deal, 3 products live
Conventional
25% down · 7.5% · 30yr
- Down + closing
- —
- Monthly P&I
- —
- Monthly cashflow
- —
- DSCR
- —
- Eligible?
- —
Personal DTI + credit; lowest rate.
DSCR
20% down · 8.5% · 30yr
- Down + closing
- —
- Monthly P&I
- —
- Monthly cashflow
- —
- DSCR
- —
- Eligible?
- —
No personal income docs; deal must DSCR.
Hard money
10% down · 12.0% · 12mo
- Down + closing
- —
- Monthly P&I
- —
- Monthly cashflow
- —
- DSCR
- —
- Eligible?
- —
Short-term bridge; refi at stabilization.
Listing history 6 events
-
2026-05-13status Pending
-
2026-04-28historical Active Option Contract
-
2026-03-06$189,900 Active
-
2012-06-08soldstatus
-
1995-06-27soldstatus
-
1990-03-11soldstatus
ⓘ Source: listings_history table (triggers on properties + properties_extension) + one-shot
backfill from property_details.listing_events for pre-trigger history.
Tax reassessment forecast TX · Resets to sale price
- Current annual tax
- $3,590 · $299/mo
- Projected year-2 tax
- $3,590 · $299/mo
- Expected delta
- $0/yr ($0/mo · -0.0%)
ⓘ Screening estimate from a state-policy table — verify with the county assessor before closing.
Climate risk First Street
- Flood 4/10 Moderate FEMA zone A · 21% chance over 30 yrs
- Wildfire 4/10 Moderate
- Heat 7/10 Severe 7 d/yr ≥106°F today · 20 d/yr by 30 yrs out
- Wind 4/10 Moderate 10% chance of damaging wind over 30 yrs
- Air quality 1/10 Low 0 unhealthy d/yr today · 0 by 30 yrs out
Nearby sold comps map
Loading sold comps map…
Walkable amenities ~0.75 mi
Loading nearby amenities…
Taxation est. · year 1
- Rental income
- $37,305
- − Mortgage interest
- −$10,637
- − Property taxes
- −$3,590
- − Insurance
- −$2,452
- − Repairs & maintenance
- −$2,984
- − Management
- −$2,984
- − Depreciation
- −$5,524
- Taxable income
- $9,133
- Est. tax owed @ 24.0%
- −$2,192
- After-tax cash flow
- $9,287/yr
For passive investors: Depreciation is non-cash, so a rental often shows a tax loss while cash-flowing — sheltering income. Rental losses are passive: they offset passive income freely, and up to $25,000/yr can offset ordinary (W-2) income if you actively participate and your MAGI is under $100k (phasing out to $0 by $150k); unused losses carry forward. On sale, claimed depreciation is recaptured at up to 25%, and gains may owe capital-gains tax (a 1031 exchange can defer both). Figures are a year-1 estimate at your 24.0% rate — not tax advice; consult a CPA.
Schools (NCES district)
- District
- Anson ISD
- NCES district ID
- 4808400
- Math proficiency
- 29% ▼ -9.00%
- Reading proficiency
- 37% ▼ -3.00%
- Median HH income
- $45,223
- Composite
- 28.21/100
- National rank
- #6805
- State rank
- #565 of 826 in TX
Livability — Anson
- Score
- 70/100
- State rank
- #377
- US rank
- #7976
Category grades
Schools grade is shown separately in the Schools card above.
Census & demographics
- Census place
- Anson, TX
- City population
- 2,635
- Population (ZIP)
- 2,635
Population outlook (Jones County) Hauer SSP2
- Today (2025)
- 19,845 people
- By 2030
- 20,213 · +1.9%
- By 2040
- 21,446 · +8.1%
- By 2050
- 22,499 · +13.4%
- By 2075
- 23,272 · +17.3%
- By 2100
- 20,420 · +2.9%
Race, ethnicity, and origin ACS 2023
- Neighborhood character
- Predominantly White (65%)
- Race & ethnicity
- White 65% Hispanic / Latino 31% Two or more races 12% Black 2%
- Hispanic origin (detail)
- Mexican 24%
- Common ancestry
- Slovak 4% Serbian 2% Scotch-Irish 1%
- Foreign-born
- 5% · Canada, Vietnam
- Languages at home
- 81% English-only · Spanish 19%
Political lean MEDSL · Jones
- 2024 margin
- Solid R (+73.2) · D 13.1% · R 86.2%
- 2008→2024 swing
- -27.1pp toward R · 2008: -46.1pp · 2024: -73.2pp
- All cycles
- 2024: R+73.2 2020: R+69.1 2016: R+65.4 2012: R+54.5 2008: R+46.1
Not yet ingested
- Civics
- —
Market trends
- HPI YoY
- ▲ 4.13%
- Current HPI
- 148.5884
- Rent YoY
- —
- Metro
- —
- State GDP YoY
- ▲ 3.95%
- F500 in state
- 110
Industry mix (Fortune 500 HQ in TX)
| Industry | F500 HQs | Revenue |
|---|---|---|
| Energy | 16 | $1,198B |
|
||
| Technology | 5 | $198B |
|
||
| Engineering / Construction | 4 | $72B |
|
||
| Energy Services | 3 | $60B |
|
||
| Utilities | 3 | $41B |
|
||
| Healthcare | 2 | $330B |
|
||
Price history
6 events — show timeline
- 2026-05-13 Pending — NTREIS
- 2026-04-28 Contingent — NTREIS
- 2026-03-06 Listed $189,900 NTREIS
- 2012-06-08 Sold (Public Records) — Public Records
- 1995-06-27 Sold (Public Records) — Public Records
- 1990-03-11 Sold (Public Records) — Public Records
Property tax history
+4.5%/yrLatest (2025): $3,590 · +20.7% YoY. Source: county tax records.
Cash-flow waterfall
monthlySold comps — $/sqft
last 12 mo · ≤1 miLoading sold comps…