6570 Tulip · Lumberton, TX
Flood risk 1/10 · Minimal
- FEMA flood zone
- X (unshaded)
- Chance of flooding over 30 yrs
- 0.0%
- Est. flood insurance / yr
- $507 – $1,088
Fire risk 5/10 · Moderate
- Est. fire insurance / yr
- $1,222 – $2,270
Heat risk 9/10 · Severe
- Hot days now (above 111°F)
- 7 days/yr
- Hot days in 30 yrs
- 25 days/yr
Wind risk 9/10 · Severe
- Chance of severe wind over 30 yrs
- 99.0%
Air-quality risk 2/10 · Minimal
- Unhealthy air days now
- 1 days/yr
- Unhealthy air days in 30 yrs
- 1 days/yr
Risk factors via First Street. Map © Google.
Why this score? — see what drove the B grade
The composite is a weighted blend of 9 inputs, each scored 0–100. Each bar is that input's sub-score; the figure is the points it added to the 100-point composite (weight × sub-score).
- Cash flow +30.0/30.0
- 1% rule +10.0/10.0
- DSCR +10.0/10.0
- ARV discount +7.5/15.0
- Schools +4.3/10.0
- Livability +3.8/5.0
- Rent growth +2.5/5.0
- Condition / age +2.5/5.0
- Appreciation +0.0/10.0
$130,000
🖨 Deal sheet (PDF) 📄 Offer letter ✓ Due diligence
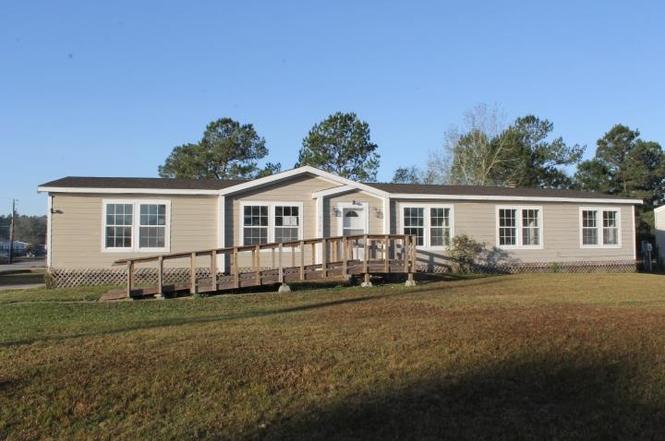
Listing remarks
HUD CASE # 493-830977. Sold as is. 4 bedroom, 2 bath manufactured home located on a corner lot in the Garden Village Addition in Lumberton. The home offers 2 spacious living areas, one featuring a wood burning fireplace, a large kitchen with a breakfast bar, and a bonus room ideal for a home office. Outdoor features include large wooden covered deck and an outbuilding for additional storage.
Key facts
- Bonus room
- Large kitchen
- Corner lot
Tags
Neighborhood map
What this means for you Summary
Snapshot
- This is a 4-bed/2.0-bath manufactured listed at $130k.
Deal economics
- At list price, monthly cash flow is $1k ($13k/yr) — positive.
- The deal already cash-flows at list — no discount required.
- Meets the 1% rule at list price ($3k rent vs $130k).
- Recommended offer: $118k (9.0% below list) — sets the bar for market timing.
- Cap rate 16.4% vs local median 3.2% in Lumberton — top-decile yield for the area; either an underpriced asset or a hidden risk that comps aren't pricing in. Stress-test before assuming the spread holds.
Location & tenants
- Location reads 75/100 on livability (#160 in TX, #4,326 nationally) — a middle-class / working-renter tenant base. Strengths: crime A+, employment A+, cost of living A+; Watch: amenities F, commute F.
- Lumberton ISD (suburban): math 48% / reading 50% proficiency, ranked #173 of 826 in TX (top 21%) — families likely to look elsewhere, expect single-tenant / working-renter base with shorter leases.
- Zoned schools: Lumberton Pri (math 54% / reading 58%, grade C+, #574 of 4,322 statewide, top 14%, 982 students, 43% FRL); Lumberton Middle (math 47% / reading 51%, grade C-, #378 of 1,662 statewide, top 23%, 969 students, 35% FRL); Lumberton H S (math 55% / reading 61%, grade C, #320 of 1,632 statewide, top 20%, 1,229 students, 30% FRL).
- Market conditions: 318 active listings in the ZIP; 3 comparable units currently listed for rent nearby; rentals lingering (median 45d on market — plan ~5-8 weeks vacancy on turnover, expect pricing pressure); 67% of comp listings sitting > 30 days — soft ceiling on asking rent; solid renter incomes; 358 units permitted in Hardin County in 2024 (0 in 5+ unit buildings).
- This rent runs 32% of the median local income ($96k/yr) — at the standard rent-burdened threshold; future hikes will face affordability resistance.
Forward outlook
- Local home prices are declining (-3.0%/yr); year-one equity from $899 of loan paydown is wiped out by about $4k of value loss. Plan a longer hold.
- At projected returns (-3.0% appreciation + 3.0% rent growth), your $36k cash investment doubles in ~4 years — after that, you're playing with house money.
Negotiation context
- It's been on market 105 days — a 9% lower offer ($118k) is reasonable based on typical stale-listing flexibility.
- 2 sale attempts since 2y ago; this cycle's ask has dropped $40k (24%) from the opening price — seller is motivated, your offer sets the floor, not the list.
Risks & watch-outs
- Climate carrying-cost: severe wind risk, 99% chance of damaging wind over 30y; moderate wildfire risk; extreme-heat days projected 7→25/yr by 2055 (HVAC capex compounding) — expect insurance premiums to compound above CPI over the hold.
Questions for the listing agent
- It's been on market 105 days. Have you received any prior offers? Is the seller open to a 9% concession, seller financing, or rate buy-down credit?
- Why hasn't it sold? Are there any deal-killer items the seller is aware of (foundation, flood, title, zoning, code violations)?
- Is there a deadline driving the sale (1031 exchange, divorce, estate, relocation)? That informs how much negotiation room exists.
- What's the average days-on-market for RENTAL listings here right now (not sales)? A rising rental-DOM trend means longer vacancies and softer asking-rent achievability than the comps imply.
- What's the recent tenant-quality profile in this submarket — average credit score on applications, eviction rate, late-payment / NSF rate, and stable-employment percentage? A property-management company in the area should have these aggregated.
- How much new for-sale + rental construction is in the pipeline within 1–3 miles? Heavy new supply typically softens prices + rents 12–24 months out; constrained supply supports both.
Investment metrics
- 1% rule
- 1.96% ✓
- Cap rate
- 16.44%
- Cash-on-cash
- 36.24%
- DSCR
- 2.61
- GRM
- 4.3
CMA / ARV
No comps found within radius.
Projected returns pro-forma
-3.0% appreciation · 3.0% rent growth · sell at horizon
- IRR
- 32.0%
- Equity multiple
- 2.35×
- Total profit
- $48,991
- Equity at exit
- $19,383
- IRR
- 39.1%
- Equity multiple
- 4.65×
- Total profit
- $133,002
- Equity at exit
- $11,240
Cash invested: $36,400 (down + closing). Projections, not guarantees.
Landlord ↔ Tenant lean methodology
- Overall (STATE)
- 87 Strongly Landlord-Friendly
- State Texas
- 87 Strongly Landlord-Friendly · R+5
- County
- — inherits STATE
- City
- — inherits STATE
ZIP-level market 77657
- Active inventory
- 318
- Price-to-rent
- 4.3×
Monthly cashflow live
- Estimated rent
- $2,547 medium interval (Pro) →
- Mortgage (P&I)
- −$682
- Tax from tax record
- −$177 /mo · $2,127/yr
- Insurance
- −$54
- HOA
- −$0
- Vacancy / Maint / Mgmt
- −$535
- Net cashflow
- $1,099
Break-even live
Sensitivity live
| Price | -10% $1,173 | -5% $1,136 | +0% $1,099 | +5% $1,062 | +10% $1,026 |
|---|---|---|---|---|---|
| Rent | -10% $898 | -5% $999 | +0% $1,099 | +5% $1,200 | +10% $1,300 |
| Rate | -1.0pp $1,165 | -0.5pp $1,132 | base $1,099 | +0.5pp $1,066 | +1.0pp $1,031 |
UW: 25.0% down · 7.5% · 30yr · 1.5% tax · 5.0% vac · 8.0% maint · 8.0% mgmt
Financing live
Cash to close
- Down payment
- $32,500
- Closing costs
- $3,900
- Reserves months
- —
- Total cash needed
- —
Loan-product check · same deal, 3 products live
Conventional
25% down · 7.5% · 30yr
- Down + closing
- —
- Monthly P&I
- —
- Monthly cashflow
- —
- DSCR
- —
- Eligible?
- —
Personal DTI + credit; lowest rate.
DSCR
20% down · 8.5% · 30yr
- Down + closing
- —
- Monthly P&I
- —
- Monthly cashflow
- —
- DSCR
- —
- Eligible?
- —
No personal income docs; deal must DSCR.
Hard money
10% down · 12.0% · 12mo
- Down + closing
- —
- Monthly P&I
- —
- Monthly cashflow
- —
- DSCR
- —
- Eligible?
- —
Short-term bridge; refi at stabilization.
Rent comps 3 comps
| Address | Beds | Baths | Sqft | Rent | $/sqft | DOM | Units | Dist |
|---|---|---|---|---|---|---|---|---|
| 322 N Lhs Dr Lumberton, TX | 3.0 | 2.0 | 1664 | $1,500 | $0.90 | 45d | 1 | 0.57mi |
| 102 Remington Cir Lumberton, TX | 4.0 | 2.0 | 2079 | $2,825 | $1.36 | 45d | 1 | 0.74mi |
| 6395 Jenny Ln Lumberton, TX | 4.0 | 2.0 | 2274 | $2,800 | $1.23 | 25d | 1 | 0.82mi |
Listing history 11 events
-
2026-04-21status Pending
-
2026-04-07price $130,000
-
2026-03-26price $142,800
-
2026-02-20price $156,400
-
2026-01-06$170,000 Active
-
2025-07-28historical
-
2024-09-18price $124,900
-
2024-06-06price $119,900
-
2024-05-30price $124,900
-
2024-05-16$129,000 Active
-
2007-05-04soldstatus
ⓘ Source: listings_history table (triggers on properties + properties_extension) + one-shot
backfill from property_details.listing_events for pre-trigger history.
Tax reassessment forecast TX · Resets to sale price
- Current annual tax
- $2,127 · $177/mo
- Projected year-2 tax
- $2,379 · $198/mo
- Expected delta
- +$252/yr (+$21/mo · 11.8%)
ⓘ Screening estimate from a state-policy table — verify with the county assessor before closing.
Climate risk First Street
- Flood 1/10 Low FEMA zone X (unshaded) · 0% chance over 30 yrs
- Wildfire 5/10 Major
- Heat 9/10 Extreme 7 d/yr ≥111°F today · 25 d/yr by 30 yrs out
- Wind 9/10 Extreme 99% chance of damaging wind over 30 yrs
- Air quality 2/10 Low 1 unhealthy d/yr today · 1 by 30 yrs out
Nearby sold comps map
Loading sold comps map…
Walkable amenities ~0.75 mi
Loading nearby amenities…
Taxation est. · year 1
- Rental income
- $30,568
- − Mortgage interest
- −$7,282
- − Property taxes
- −$2,127
- − Insurance
- −$650
- − Repairs & maintenance
- −$2,445
- − Management
- −$2,445
- − Depreciation
- −$3,782
- Taxable income
- $11,836
- Est. tax owed @ 24.0%
- −$2,841
- After-tax cash flow
- $10,350/yr
For passive investors: Depreciation is non-cash, so a rental often shows a tax loss while cash-flowing — sheltering income. Rental losses are passive: they offset passive income freely, and up to $25,000/yr can offset ordinary (W-2) income if you actively participate and your MAGI is under $100k (phasing out to $0 by $150k); unused losses carry forward. On sale, claimed depreciation is recaptured at up to 25%, and gains may owe capital-gains tax (a 1031 exchange can defer both). Figures are a year-1 estimate at your 24.0% rate — not tax advice; consult a CPA.
Schools (NCES district)
- District
- Lumberton ISD
- NCES district ID
- 4813530
- Math proficiency
- 48% ▼ -5.00%
- Reading proficiency
- 50% ▼ -4.00%
- Median HH income
- $62,996
- Composite
- 43.2/100
- National rank
- #3063
- State rank
- #173 of 826 in TX
Livability — Lumberton
- Score
- 75/100
- State rank
- #160
- US rank
- #4326
Category grades
Schools grade is shown separately in the Schools card above.
Census & demographics
- Census place
- Lumberton, TX
- County
- Hardin County · 39,783 people
- City population
- 22,258
- Metro
- Beaumont-Port Arthur, TX
- Population (ZIP)
- 22,258
- Household income
- $95,718
- Rent vs Own
- Severe rent burden
- 147.0
Population outlook (Hardin County) Hauer SSP2
- Today (2025)
- 57,780 people
- By 2030
- 58,296 · +0.9%
- By 2040
- 58,421 · +1.1%
- By 2050
- 57,391 · -0.7%
- By 2075
- 53,132 · -8.0%
- By 2100
- 44,905 · -22.3%
Race, ethnicity, and origin ACS 2023
- Neighborhood character
- Predominantly White (89%)
- Race & ethnicity
- White 89% Hispanic / Latino 5% Two or more races 5%
- Hispanic origin (detail)
- Mexican 4%
- Common ancestry
- Lithuanian 10% Serbian 3% Slovak 2%
- Foreign-born
- 2% · Canada
- Languages at home
- 97% English-only · Spanish 2%
Political lean MEDSL · Hardin
- 2024 margin
- Solid R (+75.8) · D 11.9% · R 87.7%
- 2008→2024 swing
- -14.6pp toward R · 2008: -61.2pp · 2024: -75.8pp
- All cycles
- 2024: R+75.8 2020: R+73.8 2016: R+73.9 2012: R+67.6 2008: R+61.2
Not yet ingested
- Civics
- —
Market trends
- HPI YoY
- ▼ -160.56%
- Current HPI
- 156.2265
- Rent YoY
- —
- Metro
- Beaumont-Port Arthur, TX
- State GDP YoY
- ▲ 3.95%
- F500 in state
- 110
Industry mix (Fortune 500 HQ in TX)
| Industry | F500 HQs | Revenue |
|---|---|---|
| Energy | 16 | $1,198B |
|
||
| Technology | 5 | $198B |
|
||
| Engineering / Construction | 4 | $72B |
|
||
| Energy Services | 3 | $60B |
|
||
| Utilities | 3 | $41B |
|
||
| Healthcare | 2 | $330B |
|
||
Price history
+0.8% since first listed11 events — show timeline
- 2026-04-21 Pending — BBOR
- 2026-04-07 Price Changed $130,000 BBOR
- 2026-03-26 Price Changed $142,800 BBOR
- 2026-02-20 Price Changed $156,400 BBOR
- 2026-01-06 Listed $170,000 BBOR
- 2025-07-28 Listing Removed — HARMLS
- 2024-09-18 Price Changed $124,900 HARMLS
- 2024-06-06 Price Changed $119,900 HARMLS
- 2024-05-30 Price Changed $124,900 HARMLS
- 2024-05-16 Listed $129,000 HARMLS
- 2007-05-04 Sold (Public Records) — Public Records
Property tax history
+0.7%/yrLatest (2025): $2,127 · -0.8% YoY. Source: county tax records.
Cash-flow waterfall
monthlySold comps — $/sqft
last 12 mo · ≤1 miLoading sold comps…