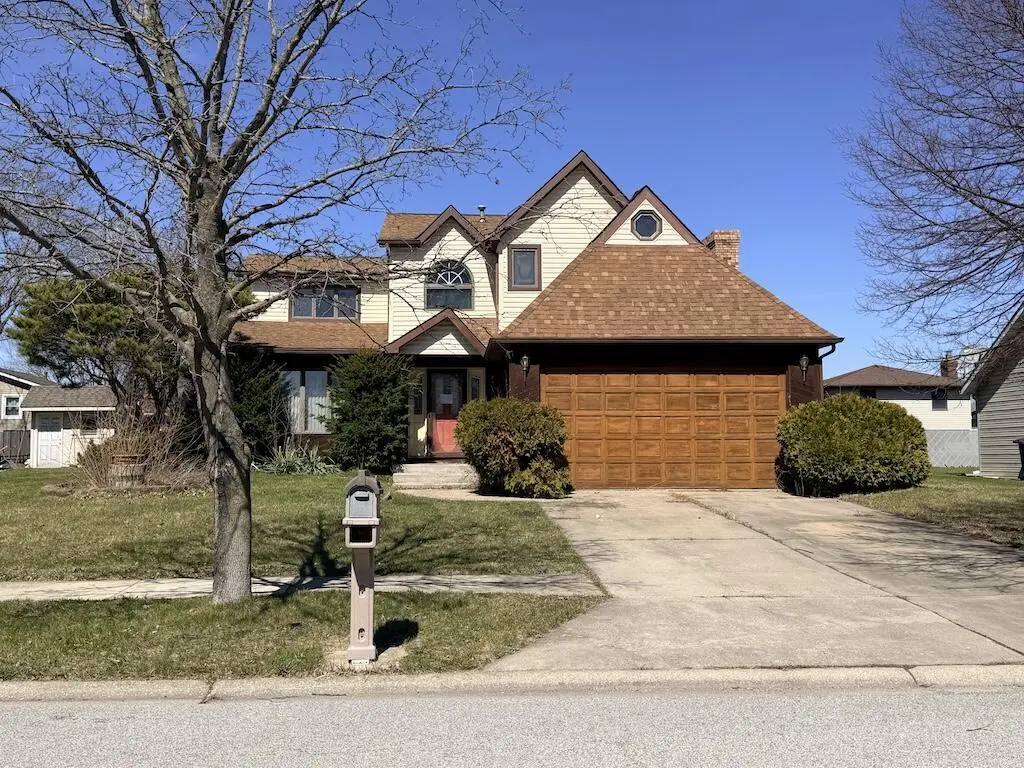
1604 W 99th Pl · Crown Point, IN
Flood risk 1/10 · Minimal
- FEMA flood zone
- X (unshaded)
- Chance of flooding over 30 yrs
- 0.0%
- Est. flood insurance / yr
- $507 – $1,088
Fire risk 1/10 · Minimal
- Est. fire insurance / yr
- $717 – $1,331
Heat risk 3/10 · Minor
- Hot days now (above 101°F)
- 7 days/yr
- Hot days in 30 yrs
- 16 days/yr
Wind risk 2/10 · Minimal
- Chance of severe wind over 30 yrs
- —
Air-quality risk 2/10 · Minimal
- Unhealthy air days now
- 1 days/yr
- Unhealthy air days in 30 yrs
- 1 days/yr
Risk factors via First Street. Map © Google.
Why this score? — see what drove the C+ grade
The composite is a weighted blend of 9 inputs, each scored 0–100. Each bar is that input's sub-score; the figure is the points it added to the 100-point composite (weight × sub-score).
- Cash flow +22.7/30.0
- ARV discount +15.0/15.0
- DSCR +7.3/10.0
- 1% rule +5.7/10.0
- Livability +3.9/5.0
- Rent growth +3.1/5.0
- Schools +2.6/10.0
- Condition / age +2.5/5.0
- Appreciation +0.0/10.0
$244,000
🖨 Deal sheet 📄 Offer letter ✓ Due diligence
Listing remarks MLS
Custom built 3-4 bedroom cape cod with 3 bathrooms. 6 panel doors, ceramic bath, jacuzzi and full brick wall fireplace in the main floor family room. Great floor plan. Capture the lovely backyard and deck off the dining room. 5 ceiling fans. ALL appliances stay. Attached 2 car garage. MUST see to appreciate. Priced to sell. Seller is providing a 13 month home warranty for new buyer.
Key facts
- 9,757 sq ft lot
- 2 garage spots
- Built 1990
Property features AI
Exterior
- Parking: Attached garage; 2 garage spaces
- Utilities: Public water; Public sewer
- Home design: One and one-half story; Built in 1990
- Construction: Crawl space basement
- Exterior features: Neighborhood view
Interior
- Kitchen: Microwave; Refrigerator; Range
- Bedrooms: Primary bedroom; Bedroom 2; Bedroom 3
- Bathrooms: 2 full bathrooms; 1 half bathroom
- Heating & cooling: Central air conditioning; Ceiling fans; Forced air heating; Natural gas heating
- Interior features: Ceiling fans; Family room fireplace (1 fireplace)
Neighborhood map
What this means for you Summary
Snapshot
- This is a 3-bed/2.5-bath single-family listed at $244k.
Deal economics
- At list price, monthly cash flow is $419 ($5k/yr) — positive.
- The deal already cash-flows at list — no discount required.
- Meets the 1% rule at list price ($3k rent vs $244k).
- Cap rate 8.4% vs local median 3.4% in Crown Point — top-decile yield for the area; either an underpriced asset or a hidden risk that comps aren't pricing in. Stress-test before assuming the spread holds.
Location & tenants
- Location reads 77/100 on livability (#45 in IN, #3,244 nationally) — a middle-class / working-renter tenant base. Strengths: crime A+, employment A+, cost of living A+; Watch: amenities F, commute F, health & safety D-.
- Merrillville Community School Corporation (suburban): math 22% / reading 36% proficiency, ranked #240 of 301 in IN (top 80%) — low school quality limits family demand, transient renter base, plan for 1-2y turnover.
- Market conditions: Rents rising (+2.5%/yr); 739 active listings in the ZIP; 3 comparable units currently listed for rent nearby; rentals leasing fast (median 6d on market — plan ~1-2 weeks tenant-placement turnaround); solid renter incomes; 1,642 units permitted in Lake County in 2024 (14 in 5+ unit buildings).
Forward outlook
- Local home prices are declining (-3.0%/yr); year-one equity from $2k of loan paydown is wiped out by about $7k of value loss. Plan a longer hold.
- Lake County population projected to shrink 7% by 2050 — rents likely to lag national; underwrite the cash flow, not the appreciation.
Negotiation context
- Only 11 days on market — expect competitive offers; lowballing is unlikely to land.
- 6 sale attempts since 28y ago with the ask held roughly flat each time — persistent listings suggest the price (not the market) is what's stuck; bring a comps-based counter.
Questions for the listing agent
- Is there a deadline driving the sale (1031 exchange, divorce, estate, relocation)? That informs how much negotiation room exists.
- Schools are B-rated — typically a magnet for longer-tenancy family renters. What's the average tenant stay here, and is there a school-zone premium baked into asking?
- What's the average days-on-market for RENTAL listings here right now (not sales)? A rising rental-DOM trend means longer vacancies and softer asking-rent achievability than the comps imply.
- What's the recent tenant-quality profile in this submarket — average credit score on applications, eviction rate, late-payment / NSF rate, and stable-employment percentage? A property-management company in the area should have these aggregated.
- How much new for-sale + rental construction is in the pipeline within 1–3 miles? Heavy new supply typically softens prices + rents 12–24 months out; constrained supply supports both.
Investment metrics
- 1% rule
- 1.07% ✓
- Cap rate
- 8.35%
- Cash-on-cash
- 7.36%
- DSCR
- 1.33
- GRM
- 7.8
CMA / ARV
- ARV (median comp)
- $338,413
- List price
- $244,000
- Delta
- -27.90%
- Verdict
- UNDERPRICED
- Comps
- 20 within 1.0 mi
Show comp detail 12 sales within ~0.75 mi
| Address | Dist | Beds/Ba | Sqft | Sold | Price | $/sf | Match |
|---|---|---|---|---|---|---|---|
| 1547 W 99th Ave | 0.04mi | 3/2.0 | 2,274 (+2%) | 0mo | $335,000 | $147 | 92 |
| 1522 W 99th Ave | 0.10mi | 4/2.0 (+1) | 2,254 (+1%) | 10mo | $350,000 | $155 | 77 |
| 1735 W 98th Pl | 0.20mi | 3/2.0 | 2,087 (-6%) | 6mo | $295,000 | $141 | 73 |
| 1215 Westbrook Ct | 0.53mi | 3/2.5 | 2,124 (-4%) | 4mo | $449,000 | $211 | 65 |
| 1235 W 99th Ave | 0.44mi | 3/3.0 | 2,092 (-6%) | 6mo | $358,800 | $172 | 63 |
| 1305 Westbrook Dr | 0.43mi | 4/2.5 (+1) | 2,103 (-5%) | 6mo | $385,000 | $183 | 61 |
| 1608 W 95th Ct | 0.56mi | 4/2.0 (+1) | 2,220 (-0%) | 10mo | $318,000 | $143 | 58 |
| 10036 Fillmore Ct | 0.14mi | 4/3.0 (+1) | 1,958 (-12%) | 14mo | $345,000 | $176 | 55 |
| 1424 W 94th Pl | 0.61mi | 3/2.0 | 2,118 (-5%) | 9mo | $305,000 | $144 | 55 |
| 1810 W 95th Ct | 0.63mi | 3/2.0 | 2,420 (+9%) | 2mo | $232,500 | $96 | 53 |
| 2150 W 95th Ave | 0.75mi | 4/2.5 (+1) | 2,300 (+4%) | 2mo | $320,000 | $139 | 53 |
| 9540 Cleveland St | 0.65mi | 3/2.0 | 2,371 (+7%) | 10mo | $290,000 | $122 | 48 |
Match score weights: distance 35% · size 25% · config 20% · recency 20%. Top-matched comps best support the ARV.
Projected returns pro-forma
-3.0% appreciation · 2.53% rent growth · sell at horizon
- IRR
- -5.6%
- Equity multiple
- 0.79×
- Total profit
- $-14,063
- Equity at exit
- $36,381
- IRR
- 3.5%
- Equity multiple
- 1.25×
- Total profit
- $17,182
- Equity at exit
- $21,097
Cash invested: $68,320 (down + closing). Projections, not guarantees.
Landlord ↔ Tenant lean methodology
- Overall (STATE)
- 90 Strongly Landlord-Friendly
- State Indiana
- 90 Strongly Landlord-Friendly · R+11
- County
- — inherits STATE
- City
- — inherits STATE
ZIP-level market 46307
- Rents YoY
- 2.5%
- Active inventory
- 739
- Price-to-rent
- 7.8×
Monthly cashflow live
- Estimated rent
- $2,609 medium interval (Pro) →
- Mortgage (P&I)
- −$1,280
- Tax from tax record
- −$260 /mo · $3,126/yr
- Insurance
- −$102
- HOA
- −$0
- Vacancy / Maint / Mgmt
- −$548
- Net cashflow
- $419
Break-even live
UW: 25.0% down · 7.5% · 30yr · 1.5% tax · 5.0% vac · 8.0% maint · 8.0% mgmt
Financing live
Cash to close
- Down payment
- $61,000
- Closing costs
- $7,320
- Reserves months
- —
- Total cash needed
- —
Loan-product check · same deal, 3 products live
Conventional
25% down · 7.5% · 30yr
- Down + closing
- —
- Monthly P&I
- —
- Monthly cashflow
- —
- DSCR
- —
- Eligible?
- —
Personal DTI + credit; lowest rate.
DSCR
20% down · 8.5% · 30yr
- Down + closing
- —
- Monthly P&I
- —
- Monthly cashflow
- —
- DSCR
- —
- Eligible?
- —
No personal income docs; deal must DSCR.
Hard money
10% down · 12.0% · 12mo
- Down + closing
- —
- Monthly P&I
- —
- Monthly cashflow
- —
- DSCR
- —
- Eligible?
- —
Short-term bridge; refi at stabilization.
Rent comps 3 comps
| Address | Beds | Baths | Sqft | Rent | $/sqft | DOM | Units | Dist |
|---|---|---|---|---|---|---|---|---|
| 1400 W 97th Ave Crown Point, IN | 3.0 | 3.0 | 1928 | $2,800 | $1.45 | 6d | 1 | 0.34mi |
| 925 W 89th Pl Merrillville, IN | 3.0 | 2.5 | 2292 | $2,850 | $1.24 | 7d | 1 | 1.31mi |
| 827 Veterans Ln Crown Point, IN | 2.0 | 2.0 | 1555 | $2,395 | $1.54 | 1d | 1 | 1.48mi |
Listing history 11 events
-
2026-05-05status Pending 375-char remark
-
2026-04-24$244,000 Active 375-char remark
-
2021-08-20soldstatus $276,500 385-char remark
Show marketing remark (385 chars)
Custom built 3-4 bedroom cape cod with 3 bathrooms. 6 panel doors, ceramic bath, jacuzzi and full brick wall fireplace in the main floor family room. Great floor plan. Capture the lovely backyard and deck off the dining room. 5 ceiling fans. ALL appliances stay. Attached 2 car garage. MUST see to appreciate. Priced to sell. Seller is providing a 13 month home warranty for new buyer.
-
2021-06-04$274,900 385-char remark
Show marketing remark (385 chars)
Custom built 3-4 bedroom cape cod with 3 bathrooms. 6 panel doors, ceramic bath, jacuzzi and full brick wall fireplace in the main floor family room. Great floor plan. Capture the lovely backyard and deck off the dining room. 5 ceiling fans. ALL appliances stay. Attached 2 car garage. MUST see to appreciate. Priced to sell. Seller is providing a 13 month home warranty for new buyer.
-
2002-09-16$153,900
-
2002-09-12historical
-
2002-06-11$153,900
-
1999-08-03historical
-
1999-05-03$165,000
-
1999-03-15historical
-
1998-09-15$175,900
ⓘ Source: listings_history table (triggers on properties + properties_extension) + one-shot
backfill from property_details.listing_events for pre-trigger history.
Tax reassessment forecast IN · Partial reset (capped growth)
- Current annual tax
- $3,126 · $260/mo
- Projected year-2 tax
- $3,126 · $260/mo
- Expected delta
- $0/yr ($0/mo · 0.0%)
ⓘ Screening estimate from a state-policy table — verify with the county assessor before closing.
Climate risk First Street
- Flood 1/10 Low FEMA zone X (unshaded) · 0% chance over 30 yrs
- Wildfire 1/10 Low
- Heat 3/10 Moderate 7 d/yr ≥101°F today · 16 d/yr by 30 yrs out
- Wind 2/10 Low
- Air quality 2/10 Low 1 unhealthy d/yr today · 1 by 30 yrs out
Nearby sold comps map
Loading sold comps map…
Walkable amenities ~0.75 mi
Loading nearby amenities…
Taxation est. · year 1
- Rental income
- $31,303
- − Mortgage interest
- −$13,668
- − Property taxes
- −$3,126
- − Insurance
- −$1,220
- − Repairs & maintenance
- −$2,504
- − Management
- −$2,504
- − Depreciation
- −$7,098
- Taxable income
- $1,183
- Est. tax owed @ 24.0%
- −$284
- After-tax cash flow
- $4,745/yr
For passive investors: Depreciation is non-cash, so a rental often shows a tax loss while cash-flowing — sheltering income. Rental losses are passive: they offset passive income freely, and up to $25,000/yr can offset ordinary (W-2) income if you actively participate and your MAGI is under $100k (phasing out to $0 by $150k); unused losses carry forward. On sale, claimed depreciation is recaptured at up to 25%, and gains may owe capital-gains tax (a 1031 exchange can defer both). Figures are a year-1 estimate at your 24.0% rate — not tax advice; consult a CPA.
Schools (NCES district)
- District
- Merrillville Community School Corporation
- NCES district ID
- 1809690
- Math proficiency
- 22% ▼ -17.00%
- Reading proficiency
- 36% ▼ -8.00%
- Median HH income
- $54,401
- Composite
- 25.74/100
- National rank
- #7375
- State rank
- #240 of 301 in IN
Livability — Crown Point
- Score
- 77/100
- State rank
- #45
- US rank
- #3244
Category grades
Schools grade is shown separately in the Schools card above.
Census & demographics
- Census place
- Crown Point, IN
- County
- Lake County · 422,878 people
- City population
- 71,673
- Metro
- Chicago-Naperville-Elgin, IL-IN-WI
- Population (ZIP)
- 71,673
- Household income
- $107,800
- Rent vs Own
- Severe rent burden
- 705.0
Population outlook (Lake County) Hauer SSP2
- Today (2025)
- 484,026 people
- By 2030
- 478,091 · -1.2%
- By 2040
- 462,974 · -4.3%
- By 2050
- 449,894 · -7.1%
- By 2075
- 436,169 · -9.9%
- By 2100
- 426,607 · -11.9%
Race, ethnicity, and origin ACS 2023
- Neighborhood character
- Predominantly White (76%)
- Race & ethnicity
- White 76% Hispanic / Latino 12% Two or more races 10% Black 7% Asian 2%
- Hispanic origin (detail)
- Mexican 9% Puerto Rican 1%
- Common ancestry
- Romanian 12% Iranian 3% Lithuanian 2%
- Foreign-born
- 7% · Canada, Vietnam
- Languages at home
- 88% English-only · Spanish 5% Russian/Polish/Slavic 3% Other Indo-European 1%
Political lean MEDSL · Lake
- 2024 margin
- Lean D (+5.6) · D 52.1% · R 46.5% · Other 1.5%
- 2008→2024 swing
- -28.6pp toward R · 2008: 34.3pp · 2024: 5.6pp
- All cycles
- 2024: D+5.6 2020: D+15.1 2016: D+20.6 2012: D+31.0 2008: D+34.3
Not yet ingested
- Civics
- —
Market trends
- HPI YoY
- ▼ -164.91%
- Current HPI
- 226.0335
- Rent YoY
- ▲ 2.53%
- Metro
- Chicago-Naperville-Elgin, IL-IN-WI
- State GDP YoY
- ▲ 2.90%
- F500 in state
- 18
Industry mix (Fortune 500 HQ in IN)
| Industry | F500 HQs | Revenue |
|---|---|---|
| Industrial Machinery | 2 | $37B |
|
||
| Healthcare | 1 | $177B |
|
||
| Pharmaceuticals | 1 | $45B |
|
||
| Metals / Steel | 1 | $18B |
|
||
| Agriculture | 1 | $17B |
|
||
| Packaging | 1 | $12B |
|
||
Price history
+38.7% since first listed11 events — show timeline
- 2026-05-05 Pending — NIRA MLS as Distributed by MLS Grid
- 2026-04-24 Listed $244,000 NIRA MLS as Distributed by MLS Grid
- 2021-08-20 Sold (MLS) $276,500 NIRA MLS as Distributed by MLS Grid
- 2021-06-04 Listed $274,900 NIRA MLS as Distributed by MLS Grid
- 2002-09-16 Listed $153,900 NIRA MLS as Distributed by MLS Grid
- 2002-09-12 Listing Removed — NIRA MLS as Distributed by MLS Grid
- 2002-06-11 Listed $153,900 NIRA MLS as Distributed by MLS Grid
- 1999-08-03 Listing Removed — NIRA MLS as Distributed by MLS Grid
- 1999-05-03 Listed $165,000 NIRA MLS as Distributed by MLS Grid
- 1999-03-15 Listing Removed — NIRA MLS as Distributed by MLS Grid
- 1998-09-15 Listed $175,900 NIRA MLS as Distributed by MLS Grid
Property tax history
+2.4%/yrLatest (2024): $3,126 · +0.5% YoY. Source: county tax records.
Cash-flow waterfall
monthlySold comps — $/sqft
last 12 mo · ≤1 miLoading sold comps…