 36-Plex
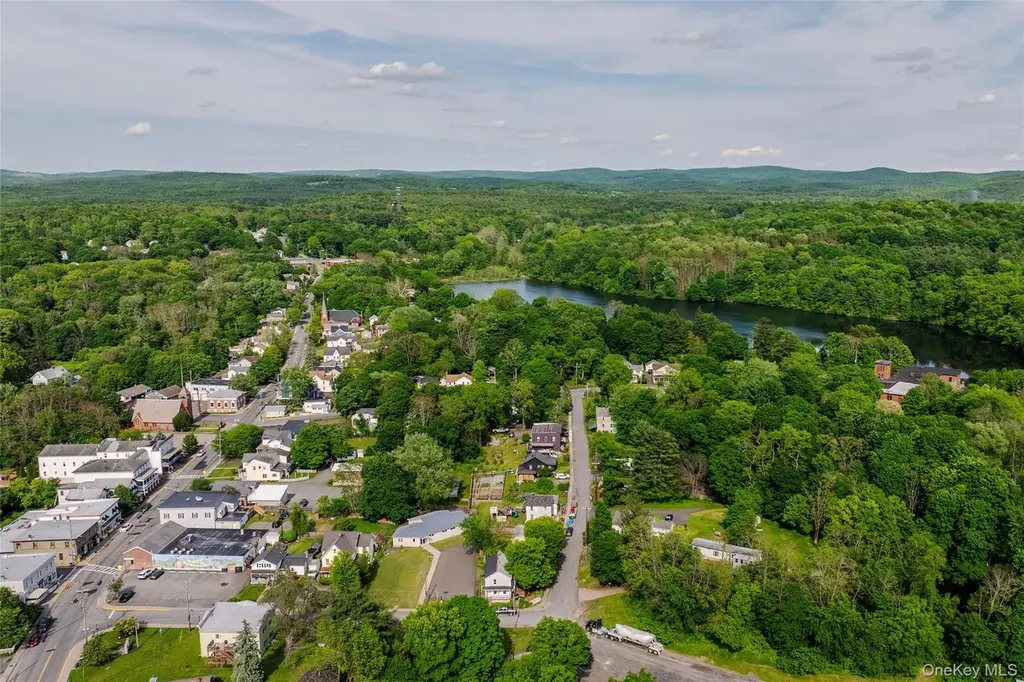
7 Canal St · Philmont, NY
Flood risk 1/10 · Minimal
- FEMA flood zone
- —
- Chance of flooding over 30 yrs
- 0.0%
- Est. flood insurance / yr
- —
Fire risk 5/10 · Moderate
- Est. fire insurance / yr
- $691 – $1,283
Heat risk 3/10 · Minor
- Hot days now (above 95°F)
- 7 days/yr
- Hot days in 30 yrs
- 16 days/yr
Wind risk 4/10 · Minor
- Chance of severe wind over 30 yrs
- 9.0%
Air-quality risk 2/10 · Minimal
- Unhealthy air days now
- 1 days/yr
- Unhealthy air days in 30 yrs
- 2 days/yr
Risk factors via First Street. Map © Google.
Why this score? — see what drove the B grade
The composite is a weighted blend of 9 inputs, each scored 0–100. Each bar is that input's sub-score; the figure is the points it added to the 100-point composite (weight × sub-score).
- Cash flow +30.0/30.0
- DSCR +10.0/10.0
- 1% rule +8.8/10.0
- ARV discount +7.5/15.0
- Appreciation +4.6/10.0
- Schools +4.5/10.0
- Livability +3.0/5.0
- Rent growth +2.5/5.0
- Condition / age +2.5/5.0
$4,125,000
🖨 Deal sheet 📄 Offer letter ✓ Due diligence
Multi-family units
County records classify this as Multi-Family (5+ Unit). Listing-text estimate: 36 units. confirmed
5+ unit building — per-unit beds/baths from public records are typically unavailable; the breakdown below (if shown) is an estimate from the listing text.
Listing remarks
The Philmont Collection presents a rare opportunity to acquire a 36-unit multifamily portfolio encompassing nine buildings across seven tax lots in the heart of Philmont's National Register Historic District. Spanning approximately 26,606 square feet, the collection combines immediate scale, strong in-place cash flow, historic character, and meaningful redevelopment potential within one of the Hudson Valley's most closely watched village investment markets. Strategically clustered within a few walkable blocks of one another, the portfolio includes seven stabilized income-producing assets together with two historic value-add buildings, creating a level of operational efficiency and market pr
Key facts
- Capital improvements
- 1.96 acre lot
- 2 garage spots
Tags
Property features AI
Exterior
- Parking: Driveway; 2-car garage
- Utilities: Public sewer; Electricity connected; Sewer connected; Water connected
- Home design: Duplex
- Construction: Wood siding construction
- Exterior features: Wood siding; Not waterfront
Interior
- Bedrooms: Includes a bedroom on the first floor
- Bathrooms: First-floor full bathroom
- Heating & cooling: Baseboard heating; Heat pump; Oil heating; Ductless cooling
- Interior features: First-floor bedroom; First-floor full bath; High ceilings; Full common basement with storage space
Neighborhood map
What this means for you Summary
Snapshot
- This is a 36 × 2-bed/1-bath units multifamily listed at $4.12M.
Deal economics
- At list price, monthly cash flow is $17k ($199k/yr) — positive. Per door: $460/mo.
- The deal already cash-flows at list — no discount required.
- Meets the 1% rule at list price ($57k rent vs $4.12M).
- Recommended offer: $4.06M (1.5% below list) — sets the bar for market timing.
Location & tenants
- Location reads 60/100 on livability (#958 in NY) — a middle-class / working-renter tenant base. Strengths: housing A+, cost of living B; Watch: crime F, amenities F, commute F.
- Taconic Hills Central School District (rural): math 53% / reading 51% proficiency, ranked #335 of 590 in NY (top 57%) — acceptable for families but not a draw, mixed tenant base, ~2y average lease.
- Zoned schools: Taconic Hills Elementary School (math 53% / reading 50%, grade C-, #1,041 of 2,108 statewide, top 50%, 562 students, 57% FRL); Taconic Hillsjunior/Senior High School (math 52% / reading 52%, grade D+, #946 of 1,100 statewide, top 88%, 502 students, 45% FRL).
- Market conditions: 12 active listings in the ZIP; 136 units permitted in Columbia County in 2024 (0 in 5+ unit buildings).
Forward outlook
- Local home prices are declining (-0.8%/yr); year-one equity from $29k of loan paydown is wiped out by about $33k of value loss. Plan a longer hold.
- Columbia County population projected at -22% by 2050 — secular population decline; favor cash flow + early exit over multi-decade hold.
- At projected returns (-0.8% appreciation + 3.0% rent growth), your $1.16M cash investment doubles in ~6 years — after that, you're playing with house money.
Negotiation context
- It's been on market 18 days — a 2% lower offer ($4.06M) is reasonable based on typical stale-listing flexibility.
- 3 sale attempts since 2y ago with the ask held roughly flat each time — persistent listings suggest the price (not the market) is what's stuck; bring a comps-based counter.
- Current owner paid $2.52M; list at $4.12M implies a 63% gain — meaningful room to come down on a strong offer.
Risks & watch-outs
- Watch-outs: built in 1920 — expect roof / HVAC / electrical / plumbing capex.
- Climate carrying-cost: moderate wildfire risk — expect insurance premiums to compound above CPI over the hold.
Questions for the listing agent
- Can we see the unit-by-unit rent roll, current vacancy, and any below-market leases? What's the average tenancy length?
- What capital expenditures (roof, boiler, parking lot, exteriors) have been made in the last 5 years, and what's planned in the next 2?
- Built in 1920 — when were the roof, HVAC, electrical panel, plumbing, and water heater last replaced?
- Is there a deadline driving the sale (1031 exchange, divorce, estate, relocation)? That informs how much negotiation room exists.
- Schools are F-rated, which usually means shorter tenancies and higher turnover. Who's the typical renter profile here, and what's been the actual vacancy rate?
- Crime grade is F in this area — have there been break-ins, vandalism, or insurance claims at this property in the last 3 years? What carrier currently insures it and at what premium?
- What's the average days-on-market for RENTAL listings here right now (not sales)? A rising rental-DOM trend means longer vacancies and softer asking-rent achievability than the comps imply.
- What's the recent tenant-quality profile in this submarket — average credit score on applications, eviction rate, late-payment / NSF rate, and stable-employment percentage? A property-management company in the area should have these aggregated.
- How much new apartment / multifamily construction is in the pipeline within 1–3 miles? Heavy new supply (>2% of stock underway) typically softens rents 12–24 months out; light construction supports rent growth.
Investment metrics
- 1% rule
- 1.38% ✓
- Cap rate
- 11.11%
- Cash-on-cash
- 17.22%
- DSCR
- 1.77
- GRM
- 6.0
CMA / ARV
- ARV (on-the-fly)
- $382,406
- Comps found
- 1
Show comp detail 1 sale within ~0.75 mi
| Address | Dist | Beds/Ba | Sqft | Sold | Price | $/sf | Match |
|---|---|---|---|---|---|---|---|
| 162 Main St St | 0.43mi | 6/3.0 | 5,524 (+3%) | 22mo | $390,000 | $71 | 57 |
Match score weights: distance 35% · size 25% · config 20% · recency 20%. Top-matched comps best support the ARV.
Projected returns pro-forma
-0.79% appreciation · 3.0% rent growth · sell at horizon
- IRR
- 14.8%
- Equity multiple
- 1.68×
- Total profit
- $784,413
- Equity at exit
- $1,036,910
- IRR
- 20.4%
- Equity multiple
- 3.10×
- Total profit
- $2,421,893
- Equity at exit
- $1,124,328
Cash invested: $1,155,000 (down + closing). Projections, not guarantees.
Landlord ↔ Tenant lean methodology
- Overall (STATE)
- 15 Strongly Tenant-Friendly
- State New York
- 15 Strongly Tenant-Friendly · D+10
- County
- — inherits STATE
- City
- — inherits STATE
ZIP-level market 12565
- Home prices YoY
- -0.2%
- Active inventory
- 12
- Price-to-rent
- 216.9×
Monthly cashflow live
- Estimated rent
- $57,061 medium interval (Pro) →
- Mortgage (P&I)
- −$21,632
- Tax est. 1.5%
- −$5,156 /mo · $61,875/yr
- Insurance
- −$1,719
- HOA
- −$0
- Vacancy / Maint / Mgmt
- −$11,983
- Net cashflow
- $16,571
Break-even live
Sensitivity live
| Price | -10% $19,422 | -5% $17,997 | +0% $16,571 | +5% $15,146 | +10% $13,721 |
|---|---|---|---|---|---|
| Rent | -10% $12,063 | -5% $14,317 | +0% $16,571 | +5% $18,825 | +10% $21,079 |
| Rate | -1.0pp $18,649 | -0.5pp $17,620 | base $16,571 | +0.5pp $15,502 | +1.0pp $14,415 |
36-unit breakdown (identical units grouped — click to expand)
| Units | Beds | Baths | Est. rent |
|---|---|---|---|
| 36× units | 2 | 1 | $57,060 |
| #1 | 2 | 1 | $1,585 |
| #2 | 2 | 1 | $1,585 |
| #3 | 2 | 1 | $1,585 |
| #4 | 2 | 1 | $1,585 |
| #5 | 2 | 1 | $1,585 |
| #6 | 2 | 1 | $1,585 |
| #7 | 2 | 1 | $1,585 |
| #8 | 2 | 1 | $1,585 |
| #9 | 2 | 1 | $1,585 |
| #10 | 2 | 1 | $1,585 |
| #11 | 2 | 1 | $1,585 |
| #12 | 2 | 1 | $1,585 |
| #13 | 2 | 1 | $1,585 |
| #14 | 2 | 1 | $1,585 |
| #15 | 2 | 1 | $1,585 |
| #16 | 2 | 1 | $1,585 |
| #17 | 2 | 1 | $1,585 |
| #18 | 2 | 1 | $1,585 |
| #19 | 2 | 1 | $1,585 |
| #20 | 2 | 1 | $1,585 |
| #21 | 2 | 1 | $1,585 |
| #22 | 2 | 1 | $1,585 |
| #23 | 2 | 1 | $1,585 |
| #24 | 2 | 1 | $1,585 |
| #25 | 2 | 1 | $1,585 |
| #26 | 2 | 1 | $1,585 |
| #27 | 2 | 1 | $1,585 |
| #28 | 2 | 1 | $1,585 |
| #29 | 2 | 1 | $1,585 |
| #30 | 2 | 1 | $1,585 |
| #31 | 2 | 1 | $1,585 |
| #32 | 2 | 1 | $1,585 |
| #33 | 2 | 1 | $1,585 |
| #34 | 2 | 1 | $1,585 |
| #35 | 2 | 1 | $1,585 |
| #36 | 2 | 1 | $1,585 |
| Total (36 units) | $57,061 | ||
UW: 25.0% down · 7.5% · 30yr · 1.5% tax · 5.0% vac · 8.0% maint · 8.0% mgmt
Financing live
Cash to close
- Down payment
- $1,031,250
- Closing costs
- $123,750
- Reserves months
- —
- Total cash needed
- —
Loan-product check · same deal, 3 products live
Conventional
25% down · 7.5% · 30yr
- Down + closing
- —
- Monthly P&I
- —
- Monthly cashflow
- —
- DSCR
- —
- Eligible?
- —
Personal DTI + credit; lowest rate.
DSCR
20% down · 8.5% · 30yr
- Down + closing
- —
- Monthly P&I
- —
- Monthly cashflow
- —
- DSCR
- —
- Eligible?
- —
No personal income docs; deal must DSCR.
Hard money
10% down · 12.0% · 12mo
- Down + closing
- —
- Monthly P&I
- —
- Monthly cashflow
- —
- DSCR
- —
- Eligible?
- —
Short-term bridge; refi at stabilization.
Listing history 14 events
-
2026-06-19days on market $4,125,000 Active 18 DOM
-
2026-06-18days on market $4,125,000 Active 17 DOM
-
2026-06-17days on market $4,125,000 Active 16 DOM
-
2026-06-16days on market $4,125,000 Active 15 DOM
-
2026-06-15days on market $4,125,000 Active 14 DOM
-
2026-06-14days on market $4,125,000 Active 12 DOM
-
2026-06-12days on market $4,125,000 Active 11 DOM
-
2026-06-09days on market $4,125,000 Active 8 DOM
-
2026-06-08days on market $4,125,000 Active 7 DOM
-
2026-06-07days on market $4,125,000 Active 6 DOM
-
2026-06-07days on market $4,125,000 Active 5 DOM
-
2026-06-04days on market $4,125,000 Active 2 DOM
-
2026-06-02remarks 699-char remark
-
2026-06-02$4,125,000 Active 1 DOM
ⓘ Source: listings_history table (triggers on properties + properties_extension) + one-shot
backfill from property_details.listing_events for pre-trigger history.
Climate risk First Street
- Flood 1/10 Low 0% chance over 30 yrs
- Wildfire 5/10 Major
- Heat 3/10 Moderate 7 d/yr ≥95°F today · 16 d/yr by 30 yrs out
- Wind 4/10 Moderate 9% chance of damaging wind over 30 yrs
- Air quality 2/10 Low 1 unhealthy d/yr today · 2 by 30 yrs out
Nearby sold comps map
Loading sold comps map…
Walkable amenities ~0.75 mi
Loading nearby amenities…
Taxation est. · year 1
- Rental income
- $684,732
- − Mortgage interest
- −$231,064
- − Property taxes
- −$61,875
- − Insurance
- −$20,625
- − Repairs & maintenance
- −$54,779
- − Management
- −$54,779
- − Depreciation
- −$120,000
- Taxable income
- $141,611
- Est. tax owed @ 24.0%
- −$33,987
- After-tax cash flow
- $164,868/yr
For passive investors: Depreciation is non-cash, so a rental often shows a tax loss while cash-flowing — sheltering income. Rental losses are passive: they offset passive income freely, and up to $25,000/yr can offset ordinary (W-2) income if you actively participate and your MAGI is under $100k (phasing out to $0 by $150k); unused losses carry forward. On sale, claimed depreciation is recaptured at up to 25%, and gains may owe capital-gains tax (a 1031 exchange can defer both). Figures are a year-1 estimate at your 24.0% rate — not tax advice; consult a CPA.
Schools (NCES district)
- District
- Taconic Hills Central School District
- NCES district ID
- 3628620
- Math proficiency
- 53% ▲ 10.00%
- Reading proficiency
- 51% ▲ 11.00%
- Median HH income
- $57,329
- Composite
- 45.16/100
- National rank
- #2676
- State rank
- #335 of 590 in NY
Livability — Philmont
- Score
- 60/100
- State rank
- #958
- US rank
- #18780
Category grades
Schools grade is shown separately in the Schools card above.
Census & demographics
- Census place
- Philmont, NY
- City population
- 1,575
- Population (ZIP)
- 1,575
Population outlook (Columbia County) Hauer SSP2
- Today (2025)
- 58,662 people
- By 2030
- 56,557 · -3.6%
- By 2040
- 51,324 · -12.5%
- By 2050
- 45,790 · -21.9%
- By 2075
- 35,232 · -39.9%
- By 2100
- 25,846 · -55.9%
Race, ethnicity, and origin ACS 2023
- Neighborhood character
- Predominantly White (79%)
- Race & ethnicity
- White 79% Black 15% Hispanic / Latino 4% Two or more races 4%
- Common ancestry
- Slovak 5% Iranian 4% Romanian 3%
- Foreign-born
- 10% · Canada
Political lean MEDSL · Columbia
- 2024 margin
- D (+14.7) · D 57.4% · R 42.6%
- 2008→2024 swing
- +1.3pp toward D · 2008: 13.4pp · 2024: 14.7pp
- All cycles
- 2024: D+14.7 2020: D+16.7 2016: D+1.4 2012: D+11.7 2008: D+13.4
Not yet ingested
- Civics
- —
Market trends
- HPI YoY
- ▼ -0.79%
- Current HPI
- 377.9813
- Rent YoY
- —
- Metro
- —
- State GDP YoY
- ▲ 2.60%
- F500 in state
- 92
Industry mix (Fortune 500 HQ in NY)
| Industry | F500 HQs | Revenue |
|---|---|---|
| Financial Services | 10 | $950B |
|
||
| Consumer Goods | 9 | $162B |
|
||
| Insurance | 4 | $225B |
|
||
| Telecommunications | 2 | $144B |
|
||
| Pharmaceuticals | 2 | $112B |
|
||
| Media / Entertainment | 2 | $69B |
|
||
Price history
+81.3% since first listed7 events — show timeline
- 2026-05-12 Listed $4,125,000 OneKey® MLS as Distributed by MLS Grid
- 2024-05-09 Rental Removed $1,400 CGNDMLS
- 2024-05-04 Listed for Rent $1,400 CGNDMLS
- 2024-04-28 Rental Removed $1,400 CGNDMLS
- 2024-04-23 Listed for Rent $1,400 CGNDMLS
- 2022-09-13 Sold (Public Records) $2,525,000 Public Records
- 2005-10-24 Sold (Public Records) $2,275,000 Public Records
Property tax history
-0.6%/yrLatest (2025): $4,776 · -0.7% YoY. Source: county tax records.
Cash-flow waterfall
monthlySold comps — $/sqft
last 12 mo · ≤1 miLoading sold comps…