 8-Plex
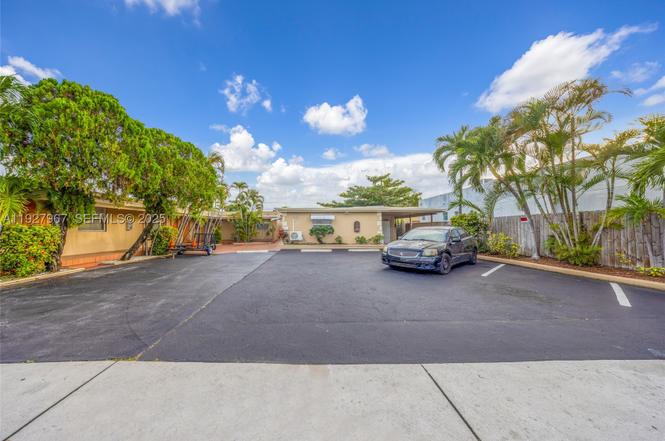
6124 Pembroke Rd · Miramar, FL
Flood risk 1/10 · Minimal
- FEMA flood zone
- X (shaded)
- Chance of flooding over 30 yrs
- 0.0%
- Est. flood insurance / yr
- $507 – $1,088
Fire risk 1/10 · Minimal
- Est. fire insurance / yr
- $947 – $1,759
Heat risk 10/10 · Severe
- Hot days now (above 105°F)
- 6 days/yr
- Hot days in 30 yrs
- 22 days/yr
Wind risk 10/10 · Severe
- Chance of severe wind over 30 yrs
- 99.0%
Air-quality risk 2/10 · Minimal
- Unhealthy air days now
- 2 days/yr
- Unhealthy air days in 30 yrs
- 2 days/yr
Risk factors via First Street. Map © Google.
Why this score? — see what drove the C grade
The composite is a weighted blend of 9 inputs, each scored 0–100. Each bar is that input's sub-score; the figure is the points it added to the 100-point composite (weight × sub-score).
- Cash flow +22.5/30.0
- ARV discount +7.5/15.0
- DSCR +7.2/10.0
- 1% rule +6.3/10.0
- Schools +4.1/10.0
- Livability +4.0/5.0
- Rent growth +2.6/5.0
- Condition / age +2.5/5.0
- Appreciation +0.0/10.0
$1,350,000
🖨 Deal sheet 📄 Offer letter ✓ Due diligence
Multi-family units
County records classify this as Multi-Family (5+ Unit). Listing-text estimate: 8 units. confirmed
5+ unit building — per-unit beds/baths from public records are typically unavailable; the breakdown below (if shown) is an estimate from the listing text.
Listing remarks
Exceptional value-add multifamily opportunity at 6124 Pembroke Road, Miramar, FL 33023. This 8-unit property includes two 1BD/1BA apartments and six studio units, offering a versatile mix in a high-demand rental corridor. Seven of the eight tenants are on month-to-month leases, allowing immediate upside through rent adjustments or renovations. The property produces $140,520 in current annual gross income, translating to an impressive near-7% going-in cap rate from day one—without raising rents. Ideally located on highly trafficked Pembroke Road, just off 441, the asset is extremely easy to rent and centrally positioned close to major highways and essentials. Additional highlights incl
Key facts
- Renovated interiors
- 8 parking spots
- Built 1975
Tags
Property features AI
Finance
- Other: Zoning: ML
- Financial info: Units are month-to-month tenancy for listed unit types; Actual listed rents: Efficiency units at $1,400; 1-bedroom units at $1,500; Rent includes gardener, hot water, pest control, sewer, and water
- HOA & community: No HOA information provided
Exterior
- Parking: Total of 8 parking spaces; Some units listed with 'Other Parking' (unit descriptions)
- Security: No security features provided
- Utilities: Cable available; Public sewer
- Home design: Single-story building
- Construction: Block construction; Built-up roof; Resale property
- Exterior features: Less than quarter acre lot
Interior
- Kitchen: No specific kitchen appliance details provided
- Bedrooms: Two 1-bedroom units (each with 1 bathroom); Six efficiency units (studio-style, each with 1 bathroom)
- Flooring: Tile flooring; Vinyl flooring
- Bathrooms: Multiple full bathrooms (each unit has 1 full bath)
- Heating & cooling: Zoned heating; Zoned cooling
- Interior features: Tile and vinyl flooring
- Laundry & utility: No specific laundry appliance details provided
Neighborhood map
What this means for you Summary
Snapshot
- This is a 8 × 2-bed/8.0-bath units multifamily listed at $1.35M.
Deal economics
- At list price, monthly cash flow is $2k ($27k/yr) — positive. Per door: $284/mo.
- The deal already cash-flows at list — no discount required.
- Meets the 1% rule at list price ($15k rent vs $1.35M).
- Recommended offer: $1.19M (12.0% below list) — sets the bar for market timing.
- Cap rate 8.3% vs local median 3.3% in Miramar — top-decile yield for the area; either an underpriced asset or a hidden risk that comps aren't pricing in. Stress-test before assuming the spread holds.
Location & tenants
- Location reads 80/100 on livability (#111 in FL, #1,721 nationally) — a professional / high-income tenant draw. Strengths: housing A+, health & safety A+, crime A; Watch: commute D+, cost of living D+, amenities D.
- Broward (suburban): math 42% / reading 53% proficiency, ranked #46 of 73 in FL (top 63%) — families likely to look elsewhere, expect single-tenant / working-renter base with shorter leases.
- Market conditions: Rents flat; 286 active listings in the ZIP; 2,111 units permitted in Broward County in 2024 (1,265 in 5+ unit buildings).
- At $15,248/mo this rent would consume 245% of the median local household income ($75k/yr) (locally 2567% of renters already pay >50% of income on rent) — very limited rent-growth headroom before tenants either downsize or default.
Forward outlook
- Local home prices are declining (-3.0%/yr); year-one equity from $9k of loan paydown is wiped out by about $40k of value loss. Plan a longer hold.
- Broward County population projected at +34% by 2050 — long-run rental-demand tailwind backs the buy-and-hold thesis.
Negotiation context
- It's been on market 175 days — a 12% lower offer ($1.19M) is reasonable based on typical stale-listing flexibility.
- Current owner paid $200k; list at $1.35M implies a 575% gain — meaningful room to come down on a strong offer.
Risks & watch-outs
- Climate carrying-cost: severe wind risk, 99% chance of damaging wind over 30y; extreme-heat days projected 6→22/yr by 2055 (HVAC capex compounding) — expect insurance premiums to compound above CPI over the hold.
Questions for the listing agent
- It's been on market 175 days. Have you received any prior offers? Is the seller open to a 12% concession, seller financing, or rate buy-down credit?
- Can we see the unit-by-unit rent roll, current vacancy, and any below-market leases? What's the average tenancy length?
- What capital expenditures (roof, boiler, parking lot, exteriors) have been made in the last 5 years, and what's planned in the next 2?
- Built in 1975 — when were the roof, HVAC, electrical panel, plumbing, and water heater last replaced?
- Why hasn't it sold? Are there any deal-killer items the seller is aware of (foundation, flood, title, zoning, code violations)?
- Is there a deadline driving the sale (1031 exchange, divorce, estate, relocation)? That informs how much negotiation room exists.
- Schools are B-rated — typically a magnet for longer-tenancy family renters. What's the average tenant stay here, and is there a school-zone premium baked into asking?
- What's the average days-on-market for RENTAL listings here right now (not sales)? A rising rental-DOM trend means longer vacancies and softer asking-rent achievability than the comps imply.
- What's the recent tenant-quality profile in this submarket — average credit score on applications, eviction rate, late-payment / NSF rate, and stable-employment percentage? A property-management company in the area should have these aggregated.
- How much new apartment / multifamily construction is in the pipeline within 1–3 miles? Heavy new supply (>2% of stock underway) typically softens rents 12–24 months out; light construction supports rent growth.
Investment metrics
- 1% rule
- 1.13% ✓
- Cap rate
- 8.31%
- Cash-on-cash
- 7.22%
- DSCR
- 1.32
- GRM
- 7.4
CMA / ARV
No comps found within radius.
Projected returns pro-forma
-3.0% appreciation · 0.34% rent growth · sell at horizon
- IRR
- -8.4%
- Equity multiple
- 0.70×
- Total profit
- $-113,185
- Equity at exit
- $201,289
- IRR
- -2.9%
- Equity multiple
- 0.83×
- Total profit
- $-64,704
- Equity at exit
- $116,723
Cash invested: $378,000 (down + closing). Projections, not guarantees.
Landlord ↔ Tenant lean methodology
- Overall (STATE)
- 87 Strongly Landlord-Friendly
- State Florida
- 87 Strongly Landlord-Friendly · R+3
- County
- — inherits STATE
- City
- — inherits STATE
ZIP-level market 33023
- Rents YoY
- 0.3%
- Active inventory
- 286
- Price-to-rent
- 59.0×
Monthly cashflow live
- Estimated rent
- $15,248 medium interval (Pro) →
- Mortgage (P&I)
- −$7,080
- Tax from tax record
- −$2,130 /mo · $25,560/yr
- Insurance
- −$562
- HOA
- −$0
- Vacancy / Maint / Mgmt
- −$3,202
- Net cashflow
- $2,274
Break-even live
8-unit breakdown (identical units grouped — click to expand)
| Units | Beds | Baths | Est. rent |
|---|---|---|---|
| 8× units | 2 | 8 | $15,248 |
| #1 | 2 | 8 | $1,906 |
| #2 | 2 | 8 | $1,906 |
| #3 | 2 | 8 | $1,906 |
| #4 | 2 | 8 | $1,906 |
| #5 | 2 | 8 | $1,906 |
| #6 | 2 | 8 | $1,906 |
| #7 | 2 | 8 | $1,906 |
| #8 | 2 | 8 | $1,906 |
| Total (8 units) | $15,248 | ||
UW: 25.0% down · 7.5% · 30yr · 1.5% tax · 5.0% vac · 8.0% maint · 8.0% mgmt
Financing live
Cash to close
- Down payment
- $337,500
- Closing costs
- $40,500
- Reserves months
- —
- Total cash needed
- —
Loan-product check · same deal, 3 products live
Conventional
25% down · 7.5% · 30yr
- Down + closing
- —
- Monthly P&I
- —
- Monthly cashflow
- —
- DSCR
- —
- Eligible?
- —
Personal DTI + credit; lowest rate.
DSCR
20% down · 8.5% · 30yr
- Down + closing
- —
- Monthly P&I
- —
- Monthly cashflow
- —
- DSCR
- —
- Eligible?
- —
No personal income docs; deal must DSCR.
Hard money
10% down · 12.0% · 12mo
- Down + closing
- —
- Monthly P&I
- —
- Monthly cashflow
- —
- DSCR
- —
- Eligible?
- —
Short-term bridge; refi at stabilization.
Listing history 17 events
-
2026-06-18days on market $1,350,000 Active 175 DOM
-
2026-06-17days on market $1,350,000 Active 174 DOM
-
2026-06-16days on market $1,350,000 Active 173 DOM
-
2026-06-15days on market $1,350,000 Active 172 DOM
-
2026-06-13days on market $1,350,000 Active 170 DOM
-
2026-06-09days on market $1,350,000 Active 166 DOM
-
2026-06-07days on market $1,350,000 Active 164 DOM
-
2026-06-04days on market $1,350,000 Active 161 DOM
-
2026-06-03days on market $1,350,000 Active 160 DOM
-
2026-06-02days on market $1,350,000 Active 159 DOM
-
2026-06-01days on market $1,350,000 Active 158 DOM
-
2026-05-31days on market $1,350,000 Active 157 DOM
-
2026-01-20price $1,350,000
-
2025-12-25$1,400,000 Active
-
1998-08-28soldstatus $200,000
-
1998-08-28soldstatus $200,000
-
1976-08-01soldstatus $57,000
ⓘ Source: listings_history table (triggers on properties + properties_extension) + one-shot
backfill from property_details.listing_events for pre-trigger history.
Tax reassessment forecast FL · Resets to sale price
- Current annual tax
- $25,560 · $2,130/mo
- Projected year-2 tax
- $25,560 · $2,130/mo
- Expected delta
- $0/yr ($0/mo · 0.0%)
ⓘ Screening estimate from a state-policy table — verify with the county assessor before closing.
Climate risk First Street
- Flood 1/10 Low FEMA zone X (shaded) · 0% chance over 30 yrs
- Wildfire 1/10 Low
- Heat 10/10 Extreme 6 d/yr ≥105°F today · 22 d/yr by 30 yrs out
- Wind 10/10 Extreme 99% chance of damaging wind over 30 yrs
- Air quality 2/10 Low 2 unhealthy d/yr today · 2 by 30 yrs out
Nearby sold comps map
Loading sold comps map…
Walkable amenities ~0.75 mi
Loading nearby amenities…
Taxation est. · year 1
- Rental income
- $182,976
- − Mortgage interest
- −$75,621
- − Property taxes
- −$25,560
- − Insurance
- −$6,750
- − Repairs & maintenance
- −$14,638
- − Management
- −$14,638
- − Depreciation
- −$39,273
- Taxable income
- $6,496
- Est. tax owed @ 24.0%
- −$1,559
- After-tax cash flow
- $25,728/yr
For passive investors: Depreciation is non-cash, so a rental often shows a tax loss while cash-flowing — sheltering income. Rental losses are passive: they offset passive income freely, and up to $25,000/yr can offset ordinary (W-2) income if you actively participate and your MAGI is under $100k (phasing out to $0 by $150k); unused losses carry forward. On sale, claimed depreciation is recaptured at up to 25%, and gains may owe capital-gains tax (a 1031 exchange can defer both). Figures are a year-1 estimate at your 24.0% rate — not tax advice; consult a CPA.
Schools (NCES district)
- District
- Broward
- NCES district ID
- 1200180
- Math proficiency
- 42% ▼ -18.00%
- Reading proficiency
- 53% ▼ -5.00%
- Median HH income
- $52,139
- Composite
- 40.88/100
- National rank
- #3621
- State rank
- #46 of 73 in FL
Livability — Miramar
- Score
- 80/100
- State rank
- #111
- US rank
- #1721
Category grades
Schools grade is shown separately in the Schools card above.
Census & demographics
- Census place
- Miramar, FL
- County
- Broward County · 1,963,430 people
- City population
- 214,427
- Metro
- Miami-Fort Lauderdale-Pompano Beach, FL
- Population (ZIP)
- 72,344
- Household income
- $74,709
- Rent vs Own
- Severe rent burden
- 2567.0
Population outlook (Broward County) Hauer SSP2
- Today (2025)
- 2,207,033 people
- By 2030
- 2,360,704 · +7.0%
- By 2040
- 2,661,208 · +20.6%
- By 2050
- 2,946,698 · +33.5%
- By 2075
- 3,602,273 · +63.2%
- By 2100
- 3,970,984 · +79.9%
Race, ethnicity, and origin ACS 2023
- Neighborhood character
- Diverse neighborhood (Simpson 0.60)
- Race & ethnicity
- Black 51% Hispanic / Latino 37% Two or more races 19% White 8% Asian 2%
- Hispanic origin (detail)
- Mexican 2% Puerto Rican 5% Cuban 9% Dominican 6%
- Common ancestry
- Hispanic 14%
- Foreign-born
- 44% · Canada, Jamaica, Dominican Republic
- Languages at home
- 50% English-only · Spanish 32% French/Haitian/Cajun 13% Other Indo-European 1%
Political lean MEDSL · Broward
- 2024 margin
- D (+17.0) · D 58.0% · R 41.0%
- 2008→2024 swing
- -17.8pp toward R · 2008: 34.7pp · 2024: 17.0pp
- All cycles
- 2024: D+17.0 2020: D+29.8 2016: D+35.0 2012: D+34.9 2008: D+34.7
Not yet ingested
- Civics
- —
Market trends
- HPI YoY
- ▼ -442.33%
- Current HPI
- 534.7664
- Rent YoY
- ▲ 0.34%
- Metro
- Miami-Fort Lauderdale-Pompano Beach, FL
- State GDP YoY
- ▲ 3.28%
- F500 in state
- 36
Industry mix (Fortune 500 HQ in FL)
| Industry | F500 HQs | Revenue |
|---|---|---|
| Industrial Technology | 2 | $29B |
|
||
| Insurance | 2 | $17B |
|
||
| Retail | 1 | $60B |
|
||
| Technology Distribution | 1 | $58B |
|
||
| Homebuilding | 1 | $35B |
|
||
| Technology Manufacturing | 1 | $35B |
|
||
Price history
+2268.4% since first listed5 events — show timeline
- 2026-01-20 Price Changed $1,350,000 MARMLS
- 2025-12-25 Listed $1,400,000 MARMLS
- 1998-08-28 Sold (Public Records) $200,000 Public Records
- 1998-08-28 Sold (Public Records) $200,000 Public Records
- 1976-08-01 Sold (Public Records) $57,000 Public Records
Property tax history
+7.2%/yrLatest (2025): $25,560 · +10.5% YoY. Source: county tax records.
Cash-flow waterfall
monthlySold comps — $/sqft
last 12 mo · ≤1 miLoading sold comps…