 Duplex
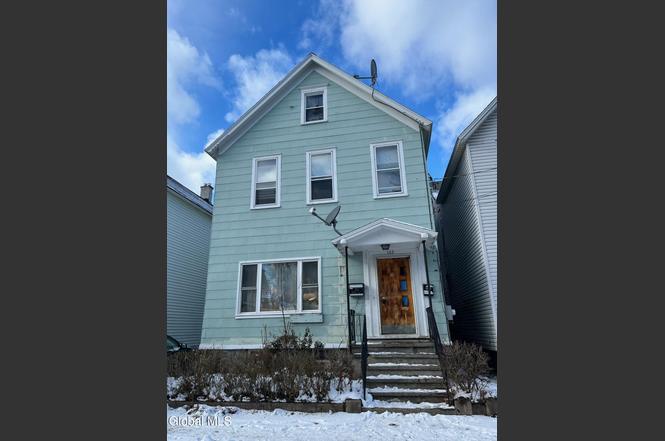
102 Degraff St · Schenectady, NY
Flood risk 1/10 · Minimal
- FEMA flood zone
- X (unshaded)
- Chance of flooding over 30 yrs
- 0.0%
- Est. flood insurance / yr
- $473 – $860
Fire risk 1/10 · Minimal
- Est. fire insurance / yr
- $691 – $1,283
Heat risk 4/10 · Minor
- Hot days now (above 95°F)
- 7 days/yr
- Hot days in 30 yrs
- 16 days/yr
Wind risk 3/10 · Minor
- Chance of severe wind over 30 yrs
- 5.0%
Air-quality risk 1/10 · Minimal
- Unhealthy air days now
- 0 days/yr
- Unhealthy air days in 30 yrs
- 0 days/yr
Risk factors via First Street. Map © Google.
Why this score? — see what drove the B+ grade
The composite is a weighted blend of 9 inputs, each scored 0–100. Each bar is that input's sub-score; the figure is the points it added to the 100-point composite (weight × sub-score).
- Cash flow +30.0/30.0
- ARV discount +15.0/15.0
- 1% rule +10.0/10.0
- DSCR +10.0/10.0
- Livability +3.9/5.0
- Schools +3.0/10.0
- Rent growth +2.5/5.0
- Condition / age +2.5/5.0
- Appreciation +0.0/10.0
$179,000
🖨 Deal sheet 📄 Offer letter ✓ Due diligence
Multi-family units
County records classify this as Multi-Family (2-4 Unit). Listing-text estimate: 2 units. confirmed
Listing remarks MLS
Well maintained two family in the heart of Schenectady, close to Downtown, Rivers Casino, Union College and Central Park, owner occupied for 40+ years. 3 bedrooms on the first floor and 4 bedrooms on the second floor, fenced yard, patio and detached garage. Modern furnaces and hot water heaters. Tiled baths and hardwood floors throughout, some under wall to wall. Come take a look! Agent is seller. Very Good Condition
Key facts
- Tiled bath
- Fenced-in backyard
- Hardwood floors
Tags
Property features AI
Finance
- Financial info: Two-unit property; Tenants pay trash collection, sewer, water, cable TV, electricity and gas
Exterior
- Parking: Detached garage (1 garage space, 1 total parking space)
- Utilities: Public water; Public sewer; Cable available
- Home design: Duplex; Below-grade finished area included
- Construction: Shingle siding; Asphalt roof
- Exterior features: Chain link fencing; Level lot
Interior
- Bedrooms: Unit 1: 3 bedrooms; Unit 2: 4 bedrooms
- Flooring: Carpet; Ceramic tile; Hardwood; Linoleum
- Bathrooms: 2 full bathrooms (one on first level, one on second level)
- Heating & cooling: Forced-air heating; Natural gas heating
- Interior features: Bilco door basement access; Full basement; Carpet, ceramic tile, hardwood and linoleum flooring
- Laundry & utility: Laundry located in basement
Neighborhood map
What this means for you Summary
Snapshot
- This is a 1×3bd/1.0ba + 1×4bd/1.0ba units multifamily listed at $179k.
Deal economics
- At list price, monthly cash flow is $1k ($14k/yr) — positive. Per door: $584/mo.
- The deal already cash-flows at list — no discount required.
- Meets the 1% rule at list price ($3k rent vs $179k).
- Recommended offer: $163k (9.0% below list) — sets the bar for market timing.
- Cap rate 14.1% vs local median 6.3% in Schenectady — top-decile yield for the area; either an underpriced asset or a hidden risk that comps aren't pricing in. Stress-test before assuming the spread holds.
Location & tenants
- Location reads 78/100 on livability (#167 in NY, #2,597 nationally) — a middle-class / working-renter tenant base. Strengths: commute A+, health & safety A+, cost of living A; Watch: employment D+, crime F.
- Schenectady City School District (urban): math 38% / reading 34% proficiency, ranked #556 of 590 in NY (top 94%) — families likely to look elsewhere, expect single-tenant / working-renter base with shorter leases; 65% free/reduced lunch — lower-income household profile, screen leases tightly.
- Zoned schools: Schenectady High School (math 75% / reading 90%, grade A, #446 of 1,100 statewide, top 41%, 2,743 students, 71% FRL).
- Zoned-school proficiency averages 82% at this address vs 36% district-wide (+46 pts) — the actual schools serving this property are materially stronger than the Schenectady City School District average implies; a family-tenant draw the district grade alone would hide.
- Market conditions: 78 active listings in the ZIP; 154 units permitted in Schenectady County in 2024 (54 in 5+ unit buildings).
Forward outlook
- Local home prices are declining (-3.0%/yr); year-one equity from $1k of loan paydown is wiped out by about $5k of value loss. Plan a longer hold.
- Schenectady County population projected to shrink 4% by 2050 — rents likely to lag national; underwrite the cash flow, not the appreciation.
- At projected returns (-3.0% appreciation + 3.0% rent growth), your $50k cash investment doubles in ~5 years — after that, you're playing with house money.
Negotiation context
- It's been on market 91 days — a 9% lower offer ($163k) is reasonable based on typical stale-listing flexibility.
- 3 sale attempts since 7y ago; this cycle's ask has dropped $100k (36%) from the opening price — seller is motivated, your offer sets the floor, not the list.
- Current owner paid $82k; list at $179k implies a 118% gain — meaningful room to come down on a strong offer.
Risks & watch-outs
- Watch-outs: property tax is 2.9% of price; built in 1910 — expect roof / HVAC / electrical / plumbing capex.
Questions for the listing agent
- It's been on market 91 days. Have you received any prior offers? Is the seller open to a 9% concession, seller financing, or rate buy-down credit?
- Can we see the unit-by-unit rent roll, current vacancy, and any below-market leases? What's the average tenancy length?
- What capital expenditures (roof, boiler, parking lot, exteriors) have been made in the last 5 years, and what's planned in the next 2?
- Built in 1910 — when were the roof, HVAC, electrical panel, plumbing, and water heater last replaced?
- Property tax is high relative to price — has the assessment been appealed recently, and will the sale trigger a re-assessment?
- Why hasn't it sold? Are there any deal-killer items the seller is aware of (foundation, flood, title, zoning, code violations)?
- Is there a deadline driving the sale (1031 exchange, divorce, estate, relocation)? That informs how much negotiation room exists.
- Crime grade is F in this area — have there been break-ins, vandalism, or insurance claims at this property in the last 3 years? What carrier currently insures it and at what premium?
- What's the average days-on-market for RENTAL listings here right now (not sales)? A rising rental-DOM trend means longer vacancies and softer asking-rent achievability than the comps imply.
- What's the recent tenant-quality profile in this submarket — average credit score on applications, eviction rate, late-payment / NSF rate, and stable-employment percentage? A property-management company in the area should have these aggregated.
- How much new apartment / multifamily construction is in the pipeline within 1–3 miles? Heavy new supply (>2% of stock underway) typically softens rents 12–24 months out; light construction supports rent growth.
Investment metrics
- 1% rule
- 1.85% ✓
- Cap rate
- 14.12%
- Cash-on-cash
- 27.96%
- DSCR
- 2.24
- GRM
- 4.5
CMA / ARV
- ARV (on-the-fly)
- $236,192
- Comps found
- 12
Show comp detail 12 sales within ~0.75 mi
| Address | Dist | Beds/Ba | Sqft | Sold | Price | $/sf | Match |
|---|---|---|---|---|---|---|---|
| 16 Paulding St | 0.12mi | 6/2.0 | 2,078 (+7%) | 5mo | $205,000 | $99 | 78 |
| 117 Prospect St | 0.06mi | 6/2.0 | 2,058 (+6%) | 13mo | $272,500 | $132 | 76 |
| 762 Eastern Ave | 0.09mi | 6/2.0 | 2,205 (+14%) | 3mo | $269,900 | $122 | 70 |
| 12 Paulding St | 0.12mi | 5/2.0 (-1) | 2,112 (+9%) | 11mo | $190,000 | $90 | 65 |
| 1540 Foster Ave | 0.65mi | 6/2.0 | 2,024 (+4%) | 7mo | $214,650 | $106 | 56 |
| 634 Hamilton St | 0.69mi | 5/2.0 (-1) | 2,024 (+4%) | 0mo | $210,000 | $104 | 55 |
| 1 Swan St | 0.65mi | 6/2.0 | 1,792 (-7%) | 6mo | $237,710 | $133 | 52 |
| 20 Hawk St | 0.50mi | 6/2.0 | 2,142 (+11%) | 11mo | $285,000 | $133 | 50 |
| 515 South Ave | 0.57mi | 5/3.0 (-1) | 2,070 (+7%) | 6mo | $172,000 | $83 | 48 |
| 22 Hawk St | 0.49mi | 6/2.0 | 2,142 (+11%) | 15mo | $340,000 | $159 | 47 |
| 1588 Foster Ave | 0.73mi | 6/2.0 | 2,200 (+14%) | 6mo | $315,000 | $143 | 39 |
| 60 Waldorf Pl | 0.65mi | 6/2.0 | 2,200 (+14%) | 20mo | $159,000 | $72 | 30 |
Match score weights: distance 35% · size 25% · config 20% · recency 20%. Top-matched comps best support the ARV.
Projected returns pro-forma
-3.0% appreciation · 3.0% rent growth · sell at horizon
- IRR
- 22.2%
- Equity multiple
- 1.91×
- Total profit
- $45,542
- Equity at exit
- $26,689
- IRR
- 30.2%
- Equity multiple
- 3.72×
- Total profit
- $136,141
- Equity at exit
- $15,477
Cash invested: $50,120 (down + closing). Projections, not guarantees.
Landlord ↔ Tenant lean methodology
- Overall (STATE)
- 15 Strongly Tenant-Friendly
- State New York
- 15 Strongly Tenant-Friendly · D+10
- County
- — inherits STATE
- City
- — inherits STATE
ZIP-level market 12308
- Home prices YoY
- -14.6%
- Active inventory
- 78
- Price-to-rent
- 9.6×
Monthly cashflow live
- Estimated rent
- $3,307 high interval (Pro) →
- Mortgage (P&I)
- −$939
- Tax from tax record
- −$432 /mo · $5,179/yr
- Insurance
- −$75
- HOA
- −$0
- Vacancy / Maint / Mgmt
- −$694
- Net cashflow
- $1,168
Break-even live
2-unit breakdown (identical units grouped — click to expand)
| Units | Beds | Baths | Est. rent |
|---|---|---|---|
| 1× unit | 3 | 1 | $1,551 |
| 1× unit | 4 | 1 | $1,756 |
| Total (2 units) | $3,307 | ||
UW: 25.0% down · 7.5% · 30yr · 1.5% tax · 5.0% vac · 8.0% maint · 8.0% mgmt
Financing live
Cash to close
- Down payment
- $44,750
- Closing costs
- $5,370
- Reserves months
- —
- Total cash needed
- —
Loan-product check · same deal, 3 products live
Conventional
25% down · 7.5% · 30yr
- Down + closing
- —
- Monthly P&I
- —
- Monthly cashflow
- —
- DSCR
- —
- Eligible?
- —
Personal DTI + credit; lowest rate.
DSCR
20% down · 8.5% · 30yr
- Down + closing
- —
- Monthly P&I
- —
- Monthly cashflow
- —
- DSCR
- —
- Eligible?
- —
No personal income docs; deal must DSCR.
Hard money
10% down · 12.0% · 12mo
- Down + closing
- —
- Monthly P&I
- —
- Monthly cashflow
- —
- DSCR
- —
- Eligible?
- —
Short-term bridge; refi at stabilization.
Listing history 19 events
-
2026-06-18days on market $179,000 Active 91 DOM
-
2026-06-17days on market $179,000 Active 90 DOM
-
2026-06-16days on market $179,000 Active 89 DOM
-
2026-06-15days on market $179,000 Active 88 DOM
-
2026-06-14days on market $179,000 Active 86 DOM
-
2026-06-13statusdays on market $179,000 Active 85 DOM
-
2026-05-17status Active
-
2026-05-14price $179,000
-
2026-02-24status Pending
-
2026-01-28price $199,000
-
2026-01-23price $224,900
-
2026-01-05price $239,000
-
2025-12-28price $259,000
-
2025-12-22price $269,000
-
2025-12-08$279,000 Active
-
2020-01-17soldstatus $82,000
-
2020-01-08soldstatus $82,000 Closed (Final Sale) 420-char remark
Show marketing remark (420 chars)
Well maintained two family in the heart of Schenectady, close to Downtown, Rivers Casino, Union College and Central Park, owner occupied for 40+ years. 3 bedrooms on the first floor and 4 bedrooms on the second floor, fenced yard, patio and detached garage. Modern furnaces and hot water heaters. Tiled baths and hardwood floors throughout, some under wall to wall. Come take a look! Agent is seller. Very Good Condition
-
2019-10-26status Pend (Under Cntr) 420-char remark
Show marketing remark (420 chars)
Well maintained two family in the heart of Schenectady, close to Downtown, Rivers Casino, Union College and Central Park, owner occupied for 40+ years. 3 bedrooms on the first floor and 4 bedrooms on the second floor, fenced yard, patio and detached garage. Modern furnaces and hot water heaters. Tiled baths and hardwood floors throughout, some under wall to wall. Come take a look! Agent is seller. Very Good Condition
-
2019-10-21$55,000 New 420-char remark
Show marketing remark (420 chars)
Well maintained two family in the heart of Schenectady, close to Downtown, Rivers Casino, Union College and Central Park, owner occupied for 40+ years. 3 bedrooms on the first floor and 4 bedrooms on the second floor, fenced yard, patio and detached garage. Modern furnaces and hot water heaters. Tiled baths and hardwood floors throughout, some under wall to wall. Come take a look! Agent is seller. Very Good Condition
ⓘ Source: listings_history table (triggers on properties + properties_extension) + one-shot
backfill from property_details.listing_events for pre-trigger history.
Tax reassessment forecast NY · Partial reset (capped growth)
- Current annual tax
- $5,179 · $432/mo
- Projected year-2 tax
- $5,179 · $432/mo
- Expected delta
- $0/yr ($0/mo · 0.0%)
ⓘ Screening estimate from a state-policy table — verify with the county assessor before closing.
Climate risk First Street
- Flood 1/10 Low FEMA zone X (unshaded) · 0% chance over 30 yrs
- Wildfire 1/10 Low
- Heat 4/10 Moderate 7 d/yr ≥95°F today · 16 d/yr by 30 yrs out
- Wind 3/10 Moderate 5% chance of damaging wind over 30 yrs
- Air quality 1/10 Low 0 unhealthy d/yr today · 0 by 30 yrs out
Nearby sold comps map
Loading sold comps map…
Walkable amenities ~0.75 mi
Loading nearby amenities…
Taxation est. · year 1
- Rental income
- $39,684
- − Mortgage interest
- −$10,027
- − Property taxes
- −$5,179
- − Insurance
- −$895
- − Repairs & maintenance
- −$3,175
- − Management
- −$3,175
- − Depreciation
- −$5,207
- Taxable income
- $12,027
- Est. tax owed @ 24.0%
- −$2,886
- After-tax cash flow
- $11,126/yr
For passive investors: Depreciation is non-cash, so a rental often shows a tax loss while cash-flowing — sheltering income. Rental losses are passive: they offset passive income freely, and up to $25,000/yr can offset ordinary (W-2) income if you actively participate and your MAGI is under $100k (phasing out to $0 by $150k); unused losses carry forward. On sale, claimed depreciation is recaptured at up to 25%, and gains may owe capital-gains tax (a 1031 exchange can defer both). Figures are a year-1 estimate at your 24.0% rate — not tax advice; consult a CPA.
Schools (NCES district)
- District
- Schenectady City School District
- NCES district ID
- 3626010
- Math proficiency
- 38% ▲ 12.00%
- Reading proficiency
- 34% ▲ 2.00%
- Median HH income
- $39,453
- Composite
- 30.2/100
- National rank
- #6309
- State rank
- #556 of 590 in NY
Livability — Schenectady
- Score
- 78/100
- State rank
- #167
- US rank
- #2597
Category grades
Schools grade is shown separately in the Schools card above.
Census & demographics
- Census place
- Schenectady, NY
- County
- Schenectady County · 141,369 people
- City population
- 141,369
- Metro
- Albany-Schenectady-Troy, NY
- Population (ZIP)
- 15,511
- Household income
- $63,434
- Rent vs Own
- Severe rent burden
- 1016.0
Population outlook (Schenectady County) Hauer SSP2
- Today (2025)
- 155,046 people
- By 2030
- 154,322 · -0.5%
- By 2040
- 151,796 · -2.1%
- By 2050
- 148,621 · -4.1%
- By 2075
- 141,229 · -8.9%
- By 2100
- 126,014 · -18.7%
Race, ethnicity, and origin ACS 2023
- Neighborhood character
- Diverse neighborhood (Simpson 0.63)
- Race & ethnicity
- White 57% Black 17% Hispanic / Latino 13% Two or more races 7% Asian 3%
- Hispanic origin (detail)
- Mexican 2% Puerto Rican 8%
- Common ancestry
- Lithuanian 4% Romanian 4% Slovak 3%
- Foreign-born
- 10% · Canada
- Languages at home
- 89% English-only · Spanish 5% Other Indo-European 2% Arabic 1%
Political lean MEDSL · Schenectady
- 2024 margin
- D (+10.8) · D 55.4% · R 44.6%
- 2008→2024 swing
- -1.8pp toward R · 2008: 12.7pp · 2024: 10.8pp
- All cycles
- 2024: D+10.8 2020: D+15.7 2016: D+5.8 2012: D+15.4 2008: D+12.7
Not yet ingested
- Civics
- —
Market trends
- HPI YoY
- ▼ -59.17%
- Current HPI
- 344.8675
- Rent YoY
- —
- Metro
- Albany-Schenectady-Troy, NY
- State GDP YoY
- ▲ 2.60%
- F500 in state
- 92
Industry mix (Fortune 500 HQ in NY)
| Industry | F500 HQs | Revenue |
|---|---|---|
| Financial Services | 10 | $950B |
|
||
| Consumer Goods | 9 | $162B |
|
||
| Insurance | 4 | $225B |
|
||
| Telecommunications | 2 | $144B |
|
||
| Pharmaceuticals | 2 | $112B |
|
||
| Media / Entertainment | 2 | $69B |
|
||
Price history
+225.5% since first listed13 events — show timeline
- 2026-05-17 Relisted — Global MLS
- 2026-05-14 Price Changed $179,000 Global MLS
- 2026-02-24 Pending — Global MLS
- 2026-01-28 Price Changed $199,000 Global MLS
- 2026-01-23 Price Changed $224,900 Global MLS
- 2026-01-05 Price Changed $239,000 Global MLS
- 2025-12-28 Price Changed $259,000 Global MLS
- 2025-12-22 Price Changed $269,000 Global MLS
- 2025-12-08 Listed $279,000 Global MLS
- 2020-01-17 Sold (Public Records) $82,000 Public Records
- 2020-01-08 Sold (MLS) $82,000 Global MLS
- 2019-10-26 Pending — Global MLS
- 2019-10-21 Listed $55,000 Global MLS
Property tax history
+5.5%/yrLatest (2025): $5,179 · +9.8% YoY. Source: county tax records.
Cash-flow waterfall
monthlySold comps — $/sqft
last 12 mo · ≤1 miLoading sold comps…