 Duplex
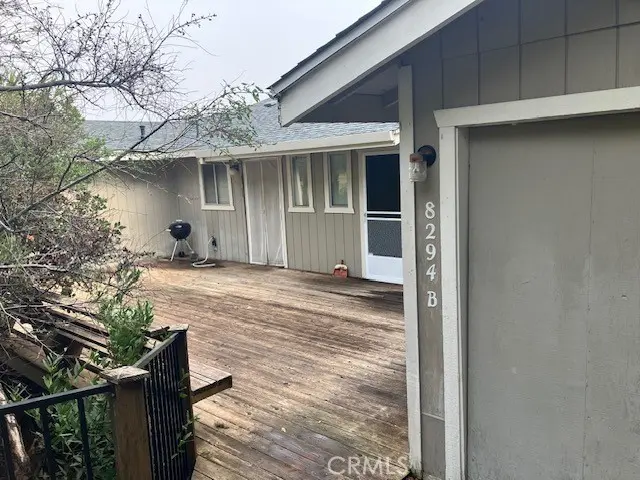
8294 N Heights · Soda Bay, CA
Flood risk 1/10 · Minimal
- FEMA flood zone
- X (unshaded)
- Chance of flooding over 30 yrs
- 0.0%
- Est. flood insurance / yr
- $507 – $1,088
Fire risk 8/10 · Major
- Est. fire insurance / yr
- $659 – $1,223
Heat risk 5/10 · Moderate
- Hot days now (above 100°F)
- 8 days/yr
- Hot days in 30 yrs
- 17 days/yr
Wind risk 1/10 · Minimal
- Chance of severe wind over 30 yrs
- —
Air-quality risk 10/10 · Severe
- Unhealthy air days now
- 32 days/yr
- Unhealthy air days in 30 yrs
- 32 days/yr
Risk factors via First Street. Map © Google.
Why this score? — see what drove the D+ grade
The composite is a weighted blend of 9 inputs, each scored 0–100. Each bar is that input's sub-score; the figure is the points it added to the 100-point composite (weight × sub-score).
- Cash flow +18.3/30.0
- ARV discount +7.5/15.0
- DSCR +5.8/10.0
- 1% rule +4.1/10.0
- Livability +3.0/5.0
- Rent growth +2.5/5.0
- Schools +2.5/10.0
- Condition / age +2.5/5.0
- Appreciation +0.0/10.0
$350,000
🖨 Deal sheet 📄 Offer letter ✓ Due diligence
Multi-family units
County records classify this as Multi-Family (2-4 Unit). Listing-text estimate: 2 units. confirmed
Listing remarks MLS
RARE DUPLEX FOR SALE! Located in Kelseyville Riviera West Subdivision. Both units are 900 SQ FT 2 bedroom 1 1/2 bath with 1 car garage. Unit B is turnkey ready; Unit A is getting new flooring and some new kitchen appliances January 2026. New roof was installed in 2024
Key facts
- 7,841 sq ft lot
- 2 garage spots
- Community pool
Neighborhood map
What this means for you Summary
Snapshot
- This is a 2 × 2-bed/1.5-bath units multifamily listed at $350k.
Deal economics
- At list price, monthly cash flow is $323 ($4k/yr) — positive. Per door: $162/mo.
- The deal already cash-flows at list — no discount required.
- To meet the 1% rule (rent ≥ 1% of price), the offer needs to be $319k (8.8% below list).
- Recommended offer: $308k (12.0% below list) — sets the bar for market timing.
- Cap rate 7.4% vs local median 3.6% in Soda Bay — top-decile yield for the area; either an underpriced asset or a hidden risk that comps aren't pricing in. Stress-test before assuming the spread holds.
Location & tenants
- Location reads 60/100 on livability (#595 in CA) — a middle-class / working-renter tenant base. Strengths: employment A+, housing A+; Watch: health & safety C-, schools D-, crime F.
- Kelseyville Unified (town): math 18% / reading 33% proficiency, ranked #1,150 of 1,400 in CA (top 82%) — low school quality limits family demand, transient renter base, plan for 1-2y turnover; 68% free/reduced lunch — lower-income household profile, screen leases tightly.
- Market conditions: 268 active listings in the ZIP; 107 units permitted in Lake County in 2024 (40 in 5+ unit buildings).
- At $3,193/mo this rent would consume 61% of the median local household income ($63k/yr) (locally 194% of renters already pay >50% of income on rent) — very limited rent-growth headroom before tenants either downsize or default.
Forward outlook
- Local home prices are declining (-3.0%/yr); year-one equity from $2k of loan paydown is wiped out by about $10k of value loss. Plan a longer hold.
- Lake County population projected at -15% by 2050 — secular population decline; favor cash flow + early exit over multi-decade hold.
Negotiation context
- It's been on market 167 days — a 12% lower offer ($308k) is reasonable based on typical stale-listing flexibility.
- 2 sale attempts; this cycle's ask is 4% above the opening price — seller raised mid-cycle; expect resistance to lowballs.
- Current owner paid $132k; list at $350k implies a 165% gain — meaningful room to come down on a strong offer.
Risks & watch-outs
- Climate carrying-cost: severe wildfire risk; extreme-heat days projected 8→17/yr by 2055 (HVAC capex compounding) — expect insurance premiums to compound above CPI over the hold.
Questions for the listing agent
- It's been on market 167 days. Have you received any prior offers? Is the seller open to a 12% concession, seller financing, or rate buy-down credit?
- Can we see the unit-by-unit rent roll, current vacancy, and any below-market leases? What's the average tenancy length?
- What capital expenditures (roof, boiler, parking lot, exteriors) have been made in the last 5 years, and what's planned in the next 2?
- What does the HOA fee cover, when was the last increase, and are there any pending special assessments or reserve-fund shortfalls?
- Why hasn't it sold? Are there any deal-killer items the seller is aware of (foundation, flood, title, zoning, code violations)?
- Is there a deadline driving the sale (1031 exchange, divorce, estate, relocation)? That informs how much negotiation room exists.
- Schools are D-rated, which usually means shorter tenancies and higher turnover. Who's the typical renter profile here, and what's been the actual vacancy rate?
- Crime grade is F in this area — have there been break-ins, vandalism, or insurance claims at this property in the last 3 years? What carrier currently insures it and at what premium?
- The area grade is low — what's the realistic commute time and amenity access for the typical tenant pool here? Any planned neighborhood developments (good or bad) we should know about?
- What's the average days-on-market for RENTAL listings here right now (not sales)? A rising rental-DOM trend means longer vacancies and softer asking-rent achievability than the comps imply.
- What's the recent tenant-quality profile in this submarket — average credit score on applications, eviction rate, late-payment / NSF rate, and stable-employment percentage? A property-management company in the area should have these aggregated.
- How much new apartment / multifamily construction is in the pipeline within 1–3 miles? Heavy new supply (>2% of stock underway) typically softens rents 12–24 months out; light construction supports rent growth.
Investment metrics
- 1% rule
- 0.91% ✗
- Cap rate
- 7.40%
- Cash-on-cash
- 3.96%
- DSCR
- 1.18
- GRM
- 9.1
CMA / ARV
No comps found within radius.
Projected returns pro-forma
-3.0% appreciation · 3.0% rent growth · sell at horizon
- IRR
- -10.1%
- Equity multiple
- 0.63×
- Total profit
- $-36,210
- Equity at exit
- $52,186
- IRR
- -0.8%
- Equity multiple
- 0.95×
- Total profit
- $-5,368
- Equity at exit
- $30,262
Cash invested: $98,000 (down + closing). Projections, not guarantees.
Landlord ↔ Tenant lean methodology
- Overall (STATE)
- 18 Strongly Tenant-Friendly
- State California
- 18 Strongly Tenant-Friendly · D+13
- County
- — inherits STATE
- City
- — inherits STATE
ZIP-level market 95451
- Active inventory
- 268
- Price-to-rent
- 18.3×
Monthly cashflow live
- Estimated rent
- $3,193 medium interval (Pro) →
- Mortgage (P&I)
- −$1,835
- Tax from tax record
- −$182 /mo · $2,183/yr
- Insurance
- −$146
- HOA
- −$36
- Vacancy / Maint / Mgmt
- −$671
- Net cashflow
- $323
Break-even live
2-unit breakdown (identical units grouped — click to expand)
| Units | Beds | Baths | Est. rent |
|---|---|---|---|
| 2× units | 2 | 1.5 | $3,194 |
| #1 | 2 | 1.5 | $1,597 |
| #2 | 2 | 1.5 | $1,597 |
| Total (2 units) | $3,193 | ||
UW: 25.0% down · 7.5% · 30yr · 1.5% tax · 5.0% vac · 8.0% maint · 8.0% mgmt
Financing live
Cash to close
- Down payment
- $87,500
- Closing costs
- $10,500
- Reserves months
- —
- Total cash needed
- —
Loan-product check · same deal, 3 products live
Conventional
25% down · 7.5% · 30yr
- Down + closing
- —
- Monthly P&I
- —
- Monthly cashflow
- —
- DSCR
- —
- Eligible?
- —
Personal DTI + credit; lowest rate.
DSCR
20% down · 8.5% · 30yr
- Down + closing
- —
- Monthly P&I
- —
- Monthly cashflow
- —
- DSCR
- —
- Eligible?
- —
No personal income docs; deal must DSCR.
Hard money
10% down · 12.0% · 12mo
- Down + closing
- —
- Monthly P&I
- —
- Monthly cashflow
- —
- DSCR
- —
- Eligible?
- —
Short-term bridge; refi at stabilization.
HOA detail
- Monthly dues
- $36 · $432/yr
Listing history 23 events
-
2026-06-19days on market $350,000 Active 167 DOM
-
2026-06-18days on market $350,000 Active 166 DOM
-
2026-06-17days on market $350,000 Active 165 DOM
-
2026-06-16days on market $350,000 Active 164 DOM
-
2026-06-15days on market $350,000 Active 163 DOM
-
2026-06-14days on market $350,000 Active 161 DOM
-
2026-06-12days on market $350,000 Active 160 DOM
-
2026-06-09days on market $350,000 Active 157 DOM
-
2026-06-08days on market $350,000 Active 156 DOM
-
2026-06-07days on market $350,000 Active 155 DOM
-
2026-06-07days on market $350,000 Active 154 DOM
-
2026-06-03days on market $350,000 Active 151 DOM
-
2026-06-02days on market $350,000 Active 150 DOM
-
2026-06-01days on market $350,000 Active 149 DOM
-
2026-05-31days on market $350,000 Active 148 DOM
-
2026-05-30days on market $350,000 Active 147 DOM
-
2026-01-19status Active 268-char remark
Show marketing remark (268 chars)
RARE DUPLEX FOR SALE! Located in Kelseyville Riviera West Subdivision. Both units are 900 SQ FT 2 bedroom 1 1/2 bath with 1 car garage. Unit B is turnkey ready; Unit A is getting new flooring and some new kitchen appliances January 2026. New roof was installed in 2024
-
2025-12-31price $350,000 268-char remark
Show marketing remark (268 chars)
RARE DUPLEX FOR SALE! Located in Kelseyville Riviera West Subdivision. Both units are 900 SQ FT 2 bedroom 1 1/2 bath with 1 car garage. Unit B is turnkey ready; Unit A is getting new flooring and some new kitchen appliances January 2026. New roof was installed in 2024
-
2025-12-31price $345,000 268-char remark
Show marketing remark (268 chars)
RARE DUPLEX FOR SALE! Located in Kelseyville Riviera West Subdivision. Both units are 900 SQ FT 2 bedroom 1 1/2 bath with 1 car garage. Unit B is turnkey ready; Unit A is getting new flooring and some new kitchen appliances January 2026. New roof was installed in 2024
-
2025-12-15$335,000 Active 268-char remark
Show marketing remark (268 chars)
RARE DUPLEX FOR SALE! Located in Kelseyville Riviera West Subdivision. Both units are 900 SQ FT 2 bedroom 1 1/2 bath with 1 car garage. Unit B is turnkey ready; Unit A is getting new flooring and some new kitchen appliances January 2026. New roof was installed in 2024
-
2025-11-25historical $335,000 268-char remark
Show marketing remark (268 chars)
RARE DUPLEX FOR SALE! Located in Kelseyville Riviera West Subdivision. Both units are 900 SQ FT 2 bedroom 1 1/2 bath with 1 car garage. Unit B is turnkey ready; Unit A is getting new flooring and some new kitchen appliances January 2026. New roof was installed in 2024
-
2000-11-17soldstatus $132,000
-
1998-09-29soldstatus $120,000
ⓘ Source: listings_history table (triggers on properties + properties_extension) + one-shot
backfill from property_details.listing_events for pre-trigger history.
Tax reassessment forecast CA · Resets to sale price
- Current annual tax
- $2,183 · $182/mo
- Projected year-2 tax
- $2,660 · $222/mo
- Expected delta
- +$477/yr (+$40/mo · 21.9%)
ⓘ Screening estimate from a state-policy table — verify with the county assessor before closing.
Climate risk First Street
- Flood 1/10 Low FEMA zone X (unshaded) · 0% chance over 30 yrs
- Wildfire 8/10 Severe
- Heat 5/10 Major 8 d/yr ≥100°F today · 17 d/yr by 30 yrs out
- Wind 1/10 Low
- Air quality 10/10 Extreme 32 unhealthy d/yr today · 32 by 30 yrs out
Nearby sold comps map
Loading sold comps map…
Walkable amenities ~0.75 mi
Loading nearby amenities…
Taxation est. · year 1
- Rental income
- $38,316
- − Mortgage interest
- −$19,605
- − Property taxes
- −$2,183
- − Insurance
- −$1,750
- − Repairs & maintenance
- −$3,065
- − Management
- −$3,065
- − HOA
- −$432
- − Depreciation
- −$10,182
- Taxable loss
- −$1,966
- Est. tax savings @ 24.0%
- +$472
- After-tax cash flow
- $4,352/yr
For passive investors: Depreciation is non-cash, so a rental often shows a tax loss while cash-flowing — sheltering income. Rental losses are passive: they offset passive income freely, and up to $25,000/yr can offset ordinary (W-2) income if you actively participate and your MAGI is under $100k (phasing out to $0 by $150k); unused losses carry forward. On sale, claimed depreciation is recaptured at up to 25%, and gains may owe capital-gains tax (a 1031 exchange can defer both). Figures are a year-1 estimate at your 24.0% rate — not tax advice; consult a CPA.
Schools (NCES district)
- District
- Kelseyville Unified
- NCES district ID
- 0619320
- Math proficiency
- 18% ▼ -1.00%
- Reading proficiency
- 33% ▲ 4.00%
- Median HH income
- $47,210
- Composite
- 25.19/100
- National rank
- #12920
- State rank
- #1150 of 1400 in CA
Livability — Soda Bay
- Score
- 60/100
- State rank
- #595
- US rank
- #19239
Category grades
Schools grade is shown separately in the Schools card above.
Census & demographics
- County
- Lake County · 24,333 people
- Metro
- Clearlake, CA
- Population (ZIP)
- 12,592
- Household income
- $62,568
- Rent vs Own
- Severe rent burden
- 194.0
Population outlook (Lake County) Hauer SSP2
- Today (2025)
- 62,396 people
- By 2030
- 60,626 · -2.8%
- By 2040
- 56,453 · -9.5%
- By 2050
- 53,054 · -15.0%
- By 2075
- 47,663 · -23.6%
- By 2100
- 41,804 · -33.0%
Race, ethnicity, and origin ACS 2023
- Neighborhood character
- Majority White (57%)
- Race & ethnicity
- White 57% Hispanic / Latino 38% Two or more races 11% Black 1%
- Hispanic origin (detail)
- Mexican 35%
- Common ancestry
- Russian 3% Slovak 3% Italian 2%
- Foreign-born
- 14% · Canada
- Languages at home
- 71% English-only · Spanish 28% German/W. Germanic 1%
Political lean MEDSL · Lake
- 2024 margin
- Toss-up / Even · D 47.8% · R 49.2% · Other 3.0%
- 2008→2024 swing
- -20.6pp toward R · 2008: 19.3pp · 2024: -1.4pp
- All cycles
- 2024: R+1.4 2020: D+6.3 2016: D+3.7 2012: D+16.5 2008: D+19.3
Not yet ingested
- Civics
- —
Market trends
- HPI YoY
- ▼ -158.45%
- Current HPI
- 168.6995
- Rent YoY
- —
- Metro
- Clearlake, CA
- State GDP YoY
- ▲ 3.21%
- F500 in state
- 116
Industry mix (Fortune 500 HQ in CA)
| Industry | F500 HQs | Revenue |
|---|---|---|
| Technology | 27 | $1,492B |
|
||
| Financial Services | 3 | $174B |
|
||
| Retail | 3 | $44B |
|
||
| Insurance | 3 | $26B |
|
||
| Media / Entertainment | 2 | $115B |
|
||
| Pharmaceuticals / Biotech | 2 | $62B |
|
||
Price history
+191.7% since first listed7 events — show timeline
- 2026-01-19 Relisted — CRMLS
- 2025-12-31 Price Changed $350,000 CRMLS
- 2025-12-31 Price Changed $345,000 CRMLS
- 2025-12-15 Listed $335,000 CRMLS
- 2025-11-25 Coming Soon $335,000 CRMLS
- 2000-11-17 Sold (Public Records) $132,000 Public Records
- 1998-09-29 Sold (Public Records) $120,000 Public Records
Property tax history
+2.0%/yrLatest (2025): $2,183 · +1.7% YoY. Source: county tax records.
Cash-flow waterfall
monthlySold comps — $/sqft
last 12 mo · ≤1 miLoading sold comps…