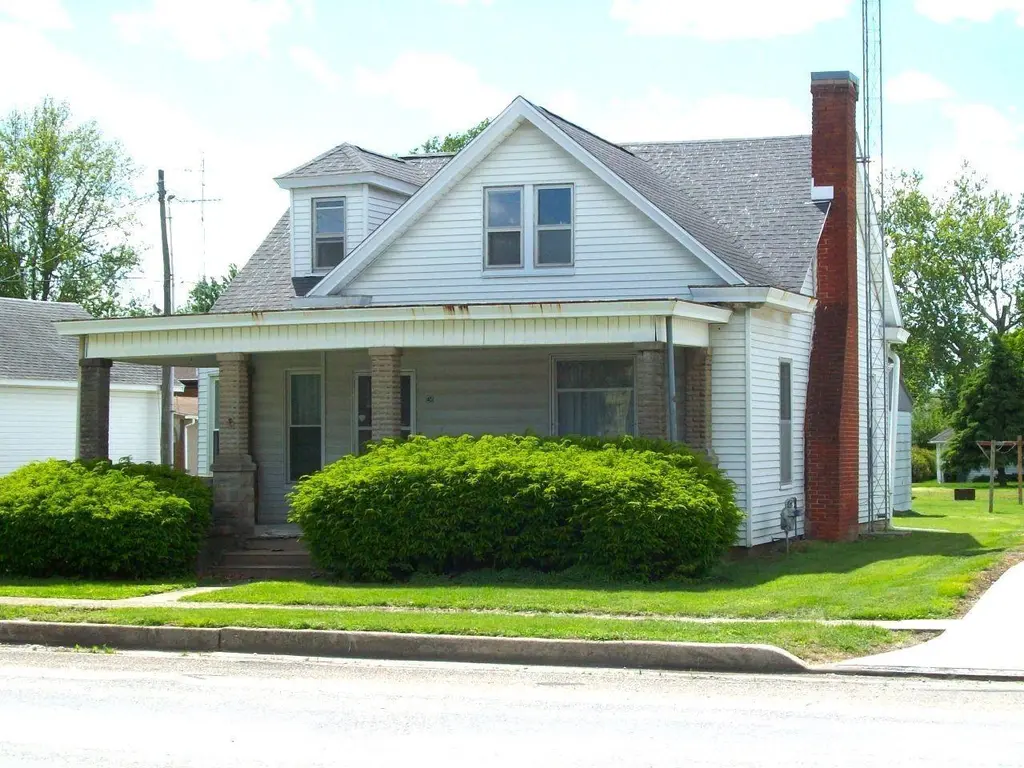
45 N Walnut St · Winchester, IL
Flood risk 1/10 · Minimal
- FEMA flood zone
- X (unshaded)
- Chance of flooding over 30 yrs
- 0.0%
- Est. flood insurance / yr
- $507 – $1,088
Fire risk 1/10 · Minimal
- Est. fire insurance / yr
- $804 – $1,492
Heat risk 4/10 · Minor
- Hot days now (above 106°F)
- 7 days/yr
- Hot days in 30 yrs
- 19 days/yr
Wind risk 2/10 · Minimal
- Chance of severe wind over 30 yrs
- 1.0%
Air-quality risk 1/10 · Minimal
- Unhealthy air days now
- 0 days/yr
- Unhealthy air days in 30 yrs
- 0 days/yr
Risk factors via First Street. Map © Google.
Why this score? — see what drove the A- grade
The composite is a weighted blend of 9 inputs, each scored 0–100. Each bar is that input's sub-score; the figure is the points it added to the 100-point composite (weight × sub-score).
- Cash flow +30.0/30.0
- ARV discount +15.0/15.0
- 1% rule +10.0/10.0
- DSCR +10.0/10.0
- Appreciation +6.5/10.0
- Livability +3.4/5.0
- Rent growth +2.5/5.0
- Condition / age +2.5/5.0
- Schools +2.4/10.0
$59,000
🖨 Deal sheet 📄 Offer letter ✓ Due diligence
Listing remarks
Check out this 1 1/2 story, three bedroom home on a large lot in Winchester. This 1,555 square foot home has potential written all over it. The main floor includes a kitchen, dining room, bedroom, full bathroom, living room with French and pocket doors, and a family room. Upstairs (unoccupied for several years) has two more bedrooms and a possible office/game room. You’ll love the wrap around front porch and unattached one car garage. Lot size is approximately 135’x60'. Residence selling “As Is” with inspections welcome.
Key facts
- Large lot
- 8,100 sq ft lot
- Garage
Tags
Property features AI
Exterior
- Parking: Detached 1-car garage
- Utilities: Public water; Public sewer
- Home design: Single family residence; Shingle roof
- Construction: Building area reported as 1555; Not new construction
- Exterior features: Level lot; Paved road access; Lot dimensions approximately 135 x 60
Interior
- Kitchen: Dishwasher; Refrigerator
- Bedrooms: 3 bedrooms (bedroom sizes: 13 x 11.9; 14.6 x 11; 13.6 x 7.1); Bedrooms have egress windows
- Flooring: Hardwood flooring in several rooms; Carpet in some rooms; Laminate flooring in kitchen area; Vinyl flooring in additional room
- Bathrooms: 1 full bathroom
- Heating & cooling: Forced air heating
- Interior features: Dishwasher; Refrigerator; Partial basement
Neighborhood map
What this means for you Summary
Snapshot
- This is a 3-bed/1.0-bath single-family listed at $59k.
Deal economics
- At list price, monthly cash flow is $444 ($5k/yr) — positive.
- The deal already cash-flows at list — no discount required.
- Meets the 1% rule at list price ($1k rent vs $59k).
Location & tenants
- Location reads 68/100 on livability (#474 in IL) — a middle-class / working-renter tenant base. Strengths: crime A+, cost of living A+, housing A+; Watch: amenities F, commute F, health & safety F.
- Winchester CUSD 1 (rural): math 26% / reading 29% proficiency, ranked #281 of 620 in IL (top 45%) — low school quality limits family demand, transient renter base, plan for 1-2y turnover.
- Zoned schools: Winchester High School (math 5% / reading 15%, grade F, #528 of 693 statewide, top 82%, 165 students, 0% FRL) — zoned schools average 0% FRL vs 36% district-wide (36 pts lower); this property's tenant base skews higher-income than the district average.
- Zoned-school proficiency averages 10% at this address vs 28% district-wide (-18 pts) — the specific schools serving this property underperform the Winchester CUSD 1 average; the district grade overstates school quality for this exact location.
- Market conditions: 8 active listings in the ZIP.
Forward outlook
- In year one you build about $2k of equity ($408 loan paydown + $2k appreciation (3.1% local appreciation)).
- Scott County population projected at -27% by 2050 — secular population decline; favor cash flow + early exit over multi-decade hold.
- At projected returns (3.1% appreciation + 3.0% rent growth), your $17k cash investment doubles in ~3 years — after that, you're playing with house money.
Negotiation context
- Only 4 days on market — expect competitive offers; lowballing is unlikely to land.
- Current owner paid $50k; 17% above their basis — modest negotiation headroom, anchor on the comps not their cost.
Questions for the listing agent
- Is there a deadline driving the sale (1031 exchange, divorce, estate, relocation)? That informs how much negotiation room exists.
- Schools are D-rated, which usually means shorter tenancies and higher turnover. Who's the typical renter profile here, and what's been the actual vacancy rate?
- What's the average days-on-market for RENTAL listings here right now (not sales)? A rising rental-DOM trend means longer vacancies and softer asking-rent achievability than the comps imply.
- What's the recent tenant-quality profile in this submarket — average credit score on applications, eviction rate, late-payment / NSF rate, and stable-employment percentage? A property-management company in the area should have these aggregated.
- How much new for-sale + rental construction is in the pipeline within 1–3 miles? Heavy new supply typically softens prices + rents 12–24 months out; constrained supply supports both.
Investment metrics
- 1% rule
- 1.77% ✓
- Cap rate
- 15.32%
- Cash-on-cash
- 32.25%
- DSCR
- 2.44
- GRM
- 4.7
CMA / ARV
- ARV (on-the-fly)
- $72,276
- Comps found
- 6
Show comp detail 6 sales within ~0.75 mi
| Address | Dist | Beds/Ba | Sqft | Sold | Price | $/sf | Match |
|---|---|---|---|---|---|---|---|
| 33 N Maple St | 0.05mi | 3/1.0 | 1,392 (+10%) | 2mo | $35,000 | $25 | 79 |
| 55 N Commercial St | 0.37mi | 3/1.0 | 1,376 (+8%) | 1mo | $50,000 | $36 | 68 |
| 11 N Commercial St | 0.38mi | 4/1.0 (+1) | 1,343 (+6%) | 6mo | $60,000 | $45 | 63 |
| 240 E Cross St | 0.28mi | 3/1.0 | 1,433 (+13%) | 8mo | $82,000 | $57 | 59 |
| 163 S Mechanic St | 0.38mi | 2/1.0 (-1) | 1,128 (-11%) | 8mo | $75,000 | $66 | 53 |
| 158 S Mechanic St | 0.37mi | 3/1.0 | 1,455 (+15%) | 9mo | $100,000 | $69 | 51 |
Match score weights: distance 35% · size 25% · config 20% · recency 20%. Top-matched comps best support the ARV.
Projected returns pro-forma
3.07% appreciation · 3.0% rent growth · sell at horizon
- IRR
- 38.1%
- Equity multiple
- 3.15×
- Total profit
- $35,594
- Equity at exit
- $26,752
- IRR
- 38.1%
- Equity multiple
- 6.26×
- Total profit
- $86,826
- Equity at exit
- $41,402
Cash invested: $16,520 (down + closing). Projections, not guarantees.
Landlord ↔ Tenant lean methodology
- Overall (STATE)
- 43 Moderately Tenant-Leaning
- State Illinois
- 43 Moderately Tenant-Leaning · D+7
- County
- — inherits STATE
- City
- — inherits STATE
ZIP-level market 62694
- Home prices YoY
- 4.5%
- Active inventory
- 8
- Price-to-rent
- 4.7×
Monthly cashflow live
- Estimated rent
- $1,042 medium interval (Pro) →
- Mortgage (P&I)
- −$309
- Tax from tax record
- −$45 /mo · $541/yr
- Insurance
- −$25
- HOA
- −$0
- Vacancy / Maint / Mgmt
- −$219
- Net cashflow
- $444
Break-even live
UW: 25.0% down · 7.5% · 30yr · 1.5% tax · 5.0% vac · 8.0% maint · 8.0% mgmt
Financing live
Cash to close
- Down payment
- $14,750
- Closing costs
- $1,770
- Reserves months
- —
- Total cash needed
- —
Loan-product check · same deal, 3 products live
Conventional
25% down · 7.5% · 30yr
- Down + closing
- —
- Monthly P&I
- —
- Monthly cashflow
- —
- DSCR
- —
- Eligible?
- —
Personal DTI + credit; lowest rate.
DSCR
20% down · 8.5% · 30yr
- Down + closing
- —
- Monthly P&I
- —
- Monthly cashflow
- —
- DSCR
- —
- Eligible?
- —
No personal income docs; deal must DSCR.
Hard money
10% down · 12.0% · 12mo
- Down + closing
- —
- Monthly P&I
- —
- Monthly cashflow
- —
- DSCR
- —
- Eligible?
- —
Short-term bridge; refi at stabilization.
Listing history 4 events
-
2026-05-15status Pending
-
2026-05-11$59,000 Active
-
2017-11-30soldstatus $50,500
-
2003-11-26soldstatus $35,000
ⓘ Source: listings_history table (triggers on properties + properties_extension) + one-shot
backfill from property_details.listing_events for pre-trigger history.
Tax reassessment forecast IL · Partial reset (capped growth)
- Current annual tax
- $541 · $45/mo
- Projected year-2 tax
- $940 · $78/mo
- Expected delta
- +$399/yr (+$33/mo · 73.7%)
ⓘ Screening estimate from a state-policy table — verify with the county assessor before closing.
Climate risk First Street
- Flood 1/10 Low FEMA zone X (unshaded) · 0% chance over 30 yrs
- Wildfire 1/10 Low
- Heat 4/10 Moderate 7 d/yr ≥106°F today · 19 d/yr by 30 yrs out
- Wind 2/10 Low 100% chance of damaging wind over 30 yrs
- Air quality 1/10 Low 0 unhealthy d/yr today · 0 by 30 yrs out
Nearby sold comps map
Loading sold comps map…
Walkable amenities ~0.75 mi
Loading nearby amenities…
Taxation est. · year 1
- Rental income
- $12,503
- − Mortgage interest
- −$3,305
- − Property taxes
- −$541
- − Insurance
- −$295
- − Repairs & maintenance
- −$1,000
- − Management
- −$1,000
- − Depreciation
- −$1,716
- Taxable income
- $4,645
- Est. tax owed @ 24.0%
- −$1,115
- After-tax cash flow
- $4,213/yr
For passive investors: Depreciation is non-cash, so a rental often shows a tax loss while cash-flowing — sheltering income. Rental losses are passive: they offset passive income freely, and up to $25,000/yr can offset ordinary (W-2) income if you actively participate and your MAGI is under $100k (phasing out to $0 by $150k); unused losses carry forward. On sale, claimed depreciation is recaptured at up to 25%, and gains may owe capital-gains tax (a 1031 exchange can defer both). Figures are a year-1 estimate at your 24.0% rate — not tax advice; consult a CPA.
Schools (NCES district)
- District
- Winchester CUSD 1
- NCES district ID
- 1742660
- Math proficiency
- 26% ▼ -3.00%
- Reading proficiency
- 29% ▼ -5.00%
- Median HH income
- $47,710
- Composite
- 23.9/100
- National rank
- #7792
- State rank
- #281 of 620 in IL
Livability — Winchester
- Score
- 68/100
- State rank
- #474
- US rank
- #9790
Category grades
Schools grade is shown separately in the Schools card above.
Census & demographics
- Census place
- Winchester, IL
- Population (ZIP)
- 2,944
Population outlook (Scott County) Hauer SSP2
- Today (2025)
- 4,701 people
- By 2030
- 4,451 · -5.3%
- By 2040
- 3,970 · -15.5%
- By 2050
- 3,445 · -26.7%
- By 2075
- 2,371 · -49.6%
- By 2100
- 1,506 · -68.0%
Race, ethnicity, and origin ACS 2023
- Neighborhood character
- Predominantly White (97%)
- Race & ethnicity
- White 97% Two or more races 2%
- Common ancestry
- Italian 4% Romanian 2% Portuguese 1%
- Foreign-born
- 1%
- Languages at home
- 99% English-only · Other Indo-European 1% Spanish 1%
Political lean MEDSL · Scott
- 2024 margin
- Solid R (+61.2) · D 18.9% · R 80.0% · Other 1.1%
- 2008→2024 swing
- -47.1pp toward R · 2008: -14.0pp · 2024: -61.2pp
- All cycles
- 2024: R+61.2 2020: R+56.3 2016: R+55.6 2012: R+26.5 2008: R+14.0
Not yet ingested
- Civics
- —
Market trends
- HPI YoY
- ▲ 3.07%
- Current HPI
- 71.3116
- Rent YoY
- —
- Metro
- —
- State GDP YoY
- ▲ 1.59%
- F500 in state
- 60
Industry mix (Fortune 500 HQ in IL)
| Industry | F500 HQs | Revenue |
|---|---|---|
| Insurance | 4 | $201B |
|
||
| Consumer Goods | 4 | $87B |
|
||
| Industrial Machinery | 3 | $64B |
|
||
| Healthcare | 2 | $55B |
|
||
| Retail / Pharmacy | 1 | $148B |
|
||
| Agriculture / Food | 1 | $86B |
|
||
Price history
+68.6% since first listed4 events — show timeline
- 2026-05-15 Pending — RMLSA as Distributed by MLS Grid
- 2026-05-11 Listed $59,000 RMLSA as Distributed by MLS Grid
- 2017-11-30 Sold (Public Records) $50,500 Public Records
- 2003-11-26 Sold (Public Records) $35,000 Public Records
Property tax history
-4.3%/yrLatest (2024): $541 · -3.5% YoY. Source: county tax records.
Cash-flow waterfall
monthlySold comps — $/sqft
last 12 mo · ≤1 miLoading sold comps…