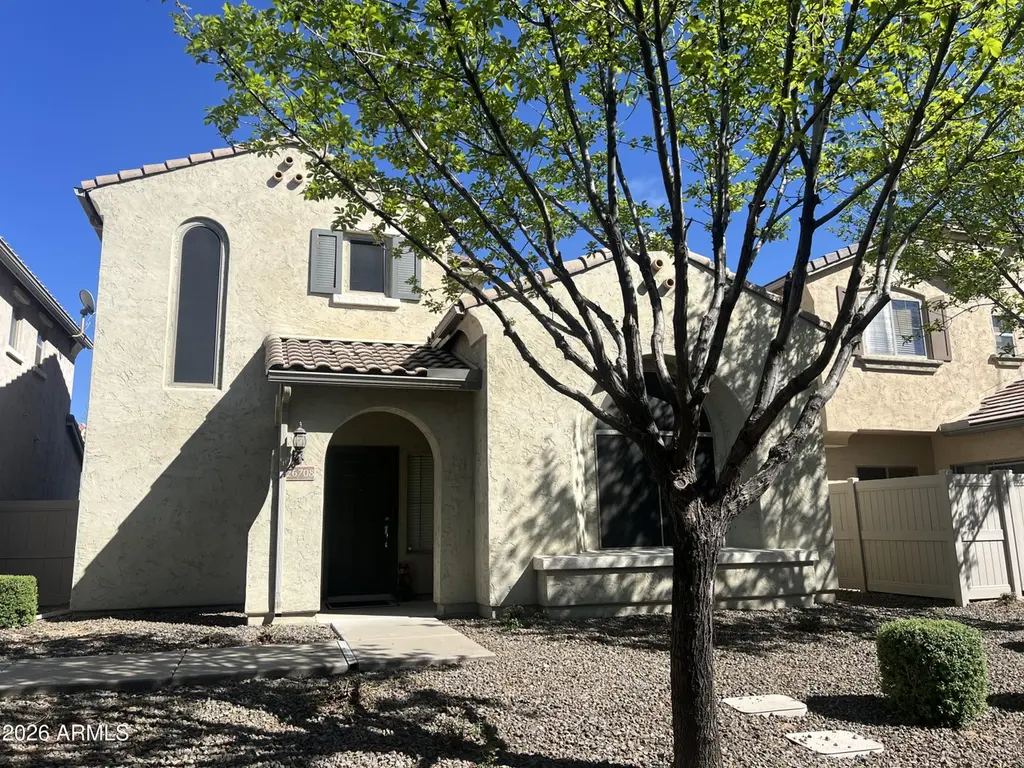
26708 N Babbling Brook Dr · Phoenix, AZ
Flood risk 1/10 · Minimal
- FEMA flood zone
- X (shaded)
- Chance of flooding over 30 yrs
- 0.0%
- Est. flood insurance / yr
- $507 – $1,088
Fire risk 5/10 · Moderate
- Est. fire insurance / yr
- $610 – $1,132
Heat risk 8/10 · Major
- Hot days now (above 111°F)
- 6 days/yr
- Hot days in 30 yrs
- 15 days/yr
Wind risk 1/10 · Minimal
- Chance of severe wind over 30 yrs
- —
Air-quality risk 2/10 · Minimal
- Unhealthy air days now
- 2 days/yr
- Unhealthy air days in 30 yrs
- 2 days/yr
Risk factors via First Street. Map © Google.
Why this score? — see what drove the D grade
The composite is a weighted blend of 9 inputs, each scored 0–100. Each bar is that input's sub-score; the figure is the points it added to the 100-point composite (weight × sub-score).
- ARV discount +10.3/15.0
- Appreciation +10.0/10.0
- Cash flow +6.3/30.0
- Schools +4.7/10.0
- Livability +3.8/5.0
- Rent growth +3.1/5.0
- Condition / age +2.5/5.0
- 1% rule +1.3/10.0
- DSCR +0.6/10.0
$365,900
🖨 Deal sheet (PDF) 📄 Offer letter ✓ Due diligence
Listing remarks MLS
City Charm!!! 2 bed, 2.5 bath home in beautiful Stetson Valley with many amenities within walking distance...parks ,greenspace, walking trails...adjacent to Deem Hills Recreation Area with additional outdoor space, hikes, soccer field, tennis courts, playground, and dog park!!!! Home features: New 2026 HVAC system...New 2026 carpet...New 2026 hot water heater....Freshly painted....High Ceilings...Cherry cabinets...Stainless steel appliances...Corian countertops...Tile flooring...Prewired for surround sound...Soft water loop...Kitchen, living room, half bath and laundry downstairs...Master and secondary bedroom upstairs with 2 baths...Private patio with brick/pavers and artificial turf...Private driveway(not shared)...Yards landscaping included in HOA assessments...Small Wonder!!!
Key facts
- New carpet
- Cherry cabinets
- New hot water heater
Tags
Neighborhood map
What this means for you Summary
Snapshot
- This is a 2-bed/3.0-bath single-family listed at $366k.
Deal economics
- At list price, monthly cash flow is $-648 ($-8k/yr) — negative.
- To cash-flow at today's rent, offer at most $251k (31.3% below list).
- To meet the 1% rule (rent ≥ 1% of price), the offer needs to be $229k (37.3% below list).
- Recommended offer: $229k (37.3% below list) — sets the bar for 1% rule.
- Cap rate 4.2% vs local median 3.3% in Phoenix — meaningfully above typical; check what's discounted (condition, days-on-market, listing class) to confirm the premium yield is real.
Location & tenants
- Location reads 75/100 on livability (#16 in AZ, #3,924 nationally) — a middle-class / working-renter tenant base. Strengths: amenities A+, commute A+, housing A+; Watch: health & safety C-, crime F.
- Deer Valley Unified District (4246) (urban): math 50% / reading 55% proficiency, ranked #33 of 249 in AZ (top 13%) — acceptable for families but not a draw, mixed tenant base, ~2y average lease.
- Zoned schools: Las Brisas Elementary School (math 57% / reading 63%, grade B-, #146 of 1,109 statewide, top 13%, 476 students, 18% FRL); Hillcrest Middle School (math 49% / reading 60%, grade B-, #15 of 218 statewide, top 7%, 899 students, 14% FRL); Sandra Day O'Connor High School (math 43% / reading 48%, grade D-, #58 of 381 statewide, top 15%, 2,567 students, 13% FRL).
- Market conditions: Rents rising (+2.3%/yr); 123 active listings in the ZIP; 7 comparable units currently listed for rent nearby; rentals at typical pace (median 17d on market — plan ~3-4 weeks tenant-placement turnaround); high-income renter base; 36,011 units permitted in Maricopa County in 2024 (12,801 in 5+ unit buildings).
Forward outlook
- In year one you build about $39k of equity ($3k loan paydown + $37k appreciation (10.0% local appreciation)).
- Maricopa County population projected at +38% by 2050 — long-run rental-demand tailwind backs the buy-and-hold thesis.
- By year 2, paydown + projected appreciation supports a ~$63k cash-out refi (75% LTV) — recoverable capital for the next deal without selling this one.
Negotiation context
- It's been on market 99 days — a 9% lower offer ($333k) is reasonable based on typical stale-listing flexibility.
- 4 sale attempts since 14y ago with the ask held roughly flat each time — persistent listings suggest the price (not the market) is what's stuck; bring a comps-based counter.
Risks & watch-outs
- Climate carrying-cost: moderate wildfire risk; extreme-heat days projected 6→15/yr by 2055 (HVAC capex compounding) — expect insurance premiums to compound above CPI over the hold.
Questions for the listing agent
- What do current leases actually rent for vs. the listed asking? Can we see a recent rent roll and the last 12 months of T-12 income?
- It's been on market 99 days. Have you received any prior offers? Is the seller open to a 37% concession, seller financing, or rate buy-down credit?
- What does the HOA fee cover, when was the last increase, and are there any pending special assessments or reserve-fund shortfalls?
- Why hasn't it sold? Are there any deal-killer items the seller is aware of (foundation, flood, title, zoning, code violations)?
- Is there a deadline driving the sale (1031 exchange, divorce, estate, relocation)? That informs how much negotiation room exists.
- Crime grade is F in this area — have there been break-ins, vandalism, or insurance claims at this property in the last 3 years? What carrier currently insures it and at what premium?
- The area grade is low — what's the realistic commute time and amenity access for the typical tenant pool here? Any planned neighborhood developments (good or bad) we should know about?
- What's the average days-on-market for RENTAL listings here right now (not sales)? A rising rental-DOM trend means longer vacancies and softer asking-rent achievability than the comps imply.
- What's the recent tenant-quality profile in this submarket — average credit score on applications, eviction rate, late-payment / NSF rate, and stable-employment percentage? A property-management company in the area should have these aggregated.
- How much new for-sale + rental construction is in the pipeline within 1–3 miles? Heavy new supply typically softens prices + rents 12–24 months out; constrained supply supports both.
Investment metrics
- 1% rule
- 0.63% ✗
- Cap rate
- 4.17%
- Cash-on-cash
- -7.59%
- DSCR
- 0.66
- GRM
- 13.3
CMA / ARV
- ARV (median comp)
- $389,875
- List price
- $365,900
- Delta
- -6.15%
- Verdict
- FAIR
- Comps
- 20 within 1.0 mi
Show comp detail 8 sales within ~0.75 mi
| Address | Dist | Beds/Ba | Sqft | Sold | Price | $/sf | Match |
|---|---|---|---|---|---|---|---|
| 26678 N Babbling Brook Dr | 0.02mi | 2/2.5 | 1,307 (0%) | 12mo | $347,500 | $266 | 87 |
| 26733 N 53rd Ln | 0.05mi | 2/2.5 | 1,306 (-0%) | 15mo | $375,000 | $287 | 83 |
| 5332 W Molly Ln | 0.04mi | 2/2.5 | 1,306 (-0%) | 19mo | $360,000 | $276 | 80 |
| 5409 W Straight Arrow Ln | 0.44mi | 3/2.0 (+1) | 1,398 (+7%) | 1mo | $478,000 | $342 | 58 |
| 26521 N Babbling Brook Dr | 0.11mi | 3/2.5 (+1) | 1,469 (+12%) | 12mo | $418,000 | $285 | 57 |
| 26410 N Babbling Brook Dr | 0.16mi | 3/2.5 (+1) | 1,469 (+12%) | 19mo | $410,850 | $280 | 49 |
| 25913 N 53rd Dr | 0.40mi | 3/2.5 (+1) | 1,493 (+14%) | 9mo | $390,000 | $261 | 43 |
| 26015 N 53rd Dr | 0.37mi | 3/2.5 (+1) | 1,493 (+14%) | 14mo | $395,000 | $265 | 40 |
Match score weights: distance 35% · size 25% · config 20% · recency 20%. Top-matched comps best support the ARV.
Projected returns pro-forma
10.0% appreciation · 2.29% rent growth · sell at horizon
- IRR
- 18.8%
- Equity multiple
- 2.53×
- Total profit
- $156,373
- Equity at exit
- $329,632
- IRR
- 17.3%
- Equity multiple
- 5.78×
- Total profit
- $489,726
- Equity at exit
- $710,863
Cash invested: $102,452 (down + closing). Projections, not guarantees.
Landlord ↔ Tenant lean methodology
- Overall (STATE)
- 87 Strongly Landlord-Friendly
- State Arizona
- 87 Strongly Landlord-Friendly · R+3
- County
- — inherits STATE
- City
- — inherits STATE
ZIP-level market 85083
- Home prices YoY
- 5.4%
- Rents YoY
- 2.3%
- Active inventory
- 123
- Price-to-rent
- 13.3×
Monthly cashflow live
- Estimated rent
- $2,294 high interval (Pro) →
- Mortgage (P&I)
- −$1,919
- Tax from tax record
- −$131 /mo · $1,569/yr
- Insurance
- −$152
- HOA
- −$258
- Vacancy / Maint / Mgmt
- −$482
- Net cashflow
- $-648
Break-even live
Sensitivity live
| Price | -10% $-441 | -5% $-544 | +0% $-648 | +5% $-752 | +10% $-855 |
|---|---|---|---|---|---|
| Rent | -10% $-829 | -5% $-739 | +0% $-648 | +5% $-557 | +10% $-467 |
| Rate | -1.0pp $-464 | -0.5pp $-555 | base $-648 | +0.5pp $-743 | +1.0pp $-839 |
UW: 25.0% down · 7.5% · 30yr · 1.5% tax · 5.0% vac · 8.0% maint · 8.0% mgmt
Financing live
Cash to close
- Down payment
- $91,475
- Closing costs
- $10,977
- Reserves months
- —
- Total cash needed
- —
Loan-product check · same deal, 3 products live
Conventional
25% down · 7.5% · 30yr
- Down + closing
- —
- Monthly P&I
- —
- Monthly cashflow
- —
- DSCR
- —
- Eligible?
- —
Personal DTI + credit; lowest rate.
DSCR
20% down · 8.5% · 30yr
- Down + closing
- —
- Monthly P&I
- —
- Monthly cashflow
- —
- DSCR
- —
- Eligible?
- —
No personal income docs; deal must DSCR.
Hard money
10% down · 12.0% · 12mo
- Down + closing
- —
- Monthly P&I
- —
- Monthly cashflow
- —
- DSCR
- —
- Eligible?
- —
Short-term bridge; refi at stabilization.
Rent comps 7 comps
| Address | Beds | Baths | Sqft | Rent | $/sqft | DOM | Units | Dist |
|---|---|---|---|---|---|---|---|---|
| 26733 N 53rd Ln Phoenix, AZ | 2.0 | 2.5 | 1306 | $4,000 | $3.06 | 46d | 1 | 0.05mi |
| 26681 N Babbling Brook Dr Phoenix, AZ | 3.0 | 2.5 | 1871 | $2,160 | $1.15 | 10d | 1 | 0.05mi |
| 5340 W Molly Ln Phoenix, AZ | 3.0 | 2.5 | 1871 | $2,400 | $1.28 | 26d | 1 | 0.08mi |
| 26616 N Babbling Brook Dr Phoenix, AZ | 2.0 | 2.5 | 1306 | $1,900 | $1.45 | 46d | 1 | 0.09mi |
| 5388 W Molly Ln Phoenix, AZ | 3.0 | 2.5 | 1871 | $2,099 | $1.12 | 10d | 1 | 0.10mi |
| 5310 W Chisum Trl Phoenix, AZ | 3.0 | 2.5 | 1719 | $2,195 | $1.28 | 1d | 1 | 0.31mi |
| 27513 N 63rd Dr Phoenix, AZ | 3.0 | 2.5 | 1866 | $2,395 | $1.28 | 17d | 1 | 1.40mi |
HOA detail
- Monthly dues
- $258 · $3,096/yr
- Likely covers
- waterlandscaping
Listing history 31 events
-
2026-06-21days on market $365,900 Active 99 DOM
-
2026-06-18days on market $365,900 Active 96 DOM
-
2026-06-17days on market $365,900 Active 95 DOM
-
2026-06-16days on market $365,900 Active 94 DOM
-
2026-06-15days on market $365,900 Active 93 DOM
-
2026-06-13days on market $365,900 Active 91 DOM
-
2026-06-13days on market $365,900 Active 90 DOM
-
2026-06-09days on market $365,900 Active 87 DOM
-
2026-06-08days on market $365,900 Active 86 DOM
-
2026-06-07days on market $365,900 Active 85 DOM
-
2026-06-04days on market $365,900 Active 82 DOM
-
2026-06-03days on market $365,900 Active 81 DOM
-
2026-06-02days on market $365,900 Active 80 DOM
-
2026-06-01days on market $365,900 Active 79 DOM
-
2026-05-31days on market $365,900 Active 78 DOM
-
2026-05-08price $365,900 792-char remark
Show marketing remark (792 chars)
City Charm!!! 2 bed, 2.5 bath home in beautiful Stetson Valley with many amenities within walking distance...parks ,greenspace, walking trails...adjacent to Deem Hills Recreation Area with additional outdoor space, hikes, soccer field, tennis courts, playground, and dog park!!!! Home features: New 2026 HVAC system...New 2026 carpet...New 2026 hot water heater....Freshly painted....High Ceilings...Cherry cabinets...Stainless steel appliances...Corian countertops...Tile flooring...Prewired for surround sound...Soft water loop...Kitchen, living room, half bath and laundry downstairs...Master and secondary bedroom upstairs with 2 baths...Private patio with brick/pavers and artificial turf...Private driveway(not shared)...Yards landscaping included in HOA assessments...Small Wonder!!!
-
2026-03-14$376,900 Active 792-char remark
Show marketing remark (792 chars)
City Charm!!! 2 bed, 2.5 bath home in beautiful Stetson Valley with many amenities within walking distance...parks ,greenspace, walking trails...adjacent to Deem Hills Recreation Area with additional outdoor space, hikes, soccer field, tennis courts, playground, and dog park!!!! Home features: New 2026 HVAC system...New 2026 carpet...New 2026 hot water heater....Freshly painted....High Ceilings...Cherry cabinets...Stainless steel appliances...Corian countertops...Tile flooring...Prewired for surround sound...Soft water loop...Kitchen, living room, half bath and laundry downstairs...Master and secondary bedroom upstairs with 2 baths...Private patio with brick/pavers and artificial turf...Private driveway(not shared)...Yards landscaping included in HOA assessments...Small Wonder!!!
-
2026-02-12historical
-
2026-02-09historical Under Contract Accepting Backups
-
2026-02-04$330,000 Active
-
2022-08-05soldstatus $395,600 Closed
-
2022-08-05soldstatus $395,600
-
2022-07-14historical Under Contract Accepting Backups
-
2022-07-05price $2,570
-
2022-06-24price $398,000
-
2022-06-10price $415,000
-
2022-06-02$430,000 Active
-
2012-12-21status Pending
-
2012-11-05price $125,000
-
2012-07-26historical Under Contract Accepting Backups
-
2012-07-16$109,900 Active
ⓘ Source: listings_history table (triggers on properties + properties_extension) + one-shot
backfill from property_details.listing_events for pre-trigger history.
Tax reassessment forecast AZ · Resets to sale price
- Current annual tax
- $1,569 · $131/mo
- Projected year-2 tax
- $2,415 · $201/mo
- Expected delta
- +$846/yr (+$70/mo · 53.9%)
ⓘ Screening estimate from a state-policy table — verify with the county assessor before closing.
Climate risk First Street
- Flood 1/10 Low FEMA zone X (shaded) · 0% chance over 30 yrs
- Wildfire 5/10 Major
- Heat 8/10 Severe 6 d/yr ≥111°F today · 15 d/yr by 30 yrs out
- Wind 1/10 Low
- Air quality 2/10 Low 2 unhealthy d/yr today · 2 by 30 yrs out
Nearby sold comps map
Loading sold comps map…
Walkable amenities ~0.75 mi
Loading nearby amenities…
Taxation est. · year 1
- Rental income
- $27,525
- − Mortgage interest
- −$20,496
- − Property taxes
- −$1,569
- − Insurance
- −$1,830
- − Repairs & maintenance
- −$2,202
- − Management
- −$2,202
- − HOA
- −$3,096
- − Depreciation
- −$10,644
- Taxable loss
- −$14,514
- Est. tax savings @ 24.0%
- +$3,483
- After-tax cash flow
- $-4,292/yr
For passive investors: Depreciation is non-cash, so a rental often shows a tax loss while cash-flowing — sheltering income. Rental losses are passive: they offset passive income freely, and up to $25,000/yr can offset ordinary (W-2) income if you actively participate and your MAGI is under $100k (phasing out to $0 by $150k); unused losses carry forward. On sale, claimed depreciation is recaptured at up to 25%, and gains may owe capital-gains tax (a 1031 exchange can defer both). Figures are a year-1 estimate at your 24.0% rate — not tax advice; consult a CPA.
Schools (NCES district)
- District
- Deer Valley Unified District (4246)
- NCES district ID
- 0407750
- Math proficiency
- 50% ▼ -9.00%
- Reading proficiency
- 55% ▼ -6.00%
- Median HH income
- $72,516
- Composite
- 47.0/100
- National rank
- #2346
- State rank
- #33 of 249 in AZ
Livability — Phoenix
- Score
- 75/100
- State rank
- #16
- US rank
- #3924
Category grades
Schools grade is shown separately in the Schools card above.
Census & demographics
- Census place
- Phoenix, AZ
- County
- Maricopa County · 4,537,380 people
- City population
- 1,500,198
- Metro
- Phoenix-Mesa-Chandler, AZ
- Population (ZIP)
- 21,022
- Household income
- $149,087
- Rent vs Own
- Severe rent burden
- 81.0
Population outlook (Maricopa County) Hauer SSP2
- Today (2025)
- 4,979,203 people
- By 2030
- 5,378,229 · +8.0%
- By 2040
- 6,156,598 · +23.6%
- By 2050
- 6,872,376 · +38.0%
- By 2075
- 8,401,270 · +68.7%
- By 2100
- 9,247,439 · +85.7%
Race, ethnicity, and origin ACS 2023
- Neighborhood character
- Predominantly White (74%)
- Race & ethnicity
- White 74% Asian 10% Hispanic / Latino 10% Two or more races 6% Black 2%
- Hispanic origin (detail)
- Mexican 8%
- Common ancestry
- Portuguese 3% Lithuanian 2% Scandinavian 2%
- Foreign-born
- 14% · Canada, China, Vietnam
- Languages at home
- 83% English-only · Other Indo-European 7% Other Asian/Pacific 3% Spanish 3%
Political lean MEDSL · Maricopa
- 2024 margin
- Toss-up / Even · D 47.7% · R 51.2% · Other 1.1%
- 2008→2024 swing
- +7.1pp toward D · 2008: -10.6pp · 2024: -3.5pp
- All cycles
- 2024: R+3.5 2020: D+2.2 2016: R+3.5 2012: R+12.0 2008: R+10.6
Not yet ingested
- Civics
- —
Market trends
- HPI YoY
- ▲ 14.78%
- Current HPI
- 289.2128
- Rent YoY
- ▲ 2.29%
- Metro
- Phoenix-Mesa-Chandler, AZ
- State GDP YoY
- ▲ 4.54%
- F500 in state
- 20
Industry mix (Fortune 500 HQ in AZ)
| Industry | F500 HQs | Revenue |
|---|---|---|
| Technology | 2 | $13B |
|
||
| Mining / Metals | 1 | $23B |
|
||
| Environmental Services | 1 | $16B |
|
||
| Metals / Steel | 1 | $14B |
|
||
| Technology Distribution | 1 | $9B |
|
||
| Homebuilding | 1 | $8B |
|
||
Price history
+232.9% since first listed16 events — show timeline
- 2026-05-08 Price Changed $365,900 ARMLS
- 2026-03-14 Listed $376,900 ARMLS
- 2026-02-12 Listing Removed — ARMLS
- 2026-02-09 Contingent — ARMLS
- 2026-02-04 Listed $330,000 ARMLS
- 2022-08-05 Sold (Public Records) $395,600 Public Records
- 2022-08-05 Sold (MLS) $395,600 ARMLS
- 2022-07-14 Contingent — ARMLS
- 2022-07-05 Price Changed $2,570 RENT.
- 2022-06-24 Price Changed $398,000 ARMLS
- 2022-06-10 Price Changed $415,000 ARMLS
- 2022-06-02 Listed $430,000 ARMLS
- 2012-12-21 Pending — ARMLS
- 2012-11-05 Price Changed $125,000 ARMLS
- 2012-07-26 Contingent — ARMLS
- 2012-07-16 Listed $109,900 ARMLS
Property tax history
+1.6%/yrLatest (2025): $1,569 · +1.0% YoY. Source: county tax records.
Cash-flow waterfall
monthlySold comps — $/sqft
last 12 mo · ≤1 miLoading sold comps…