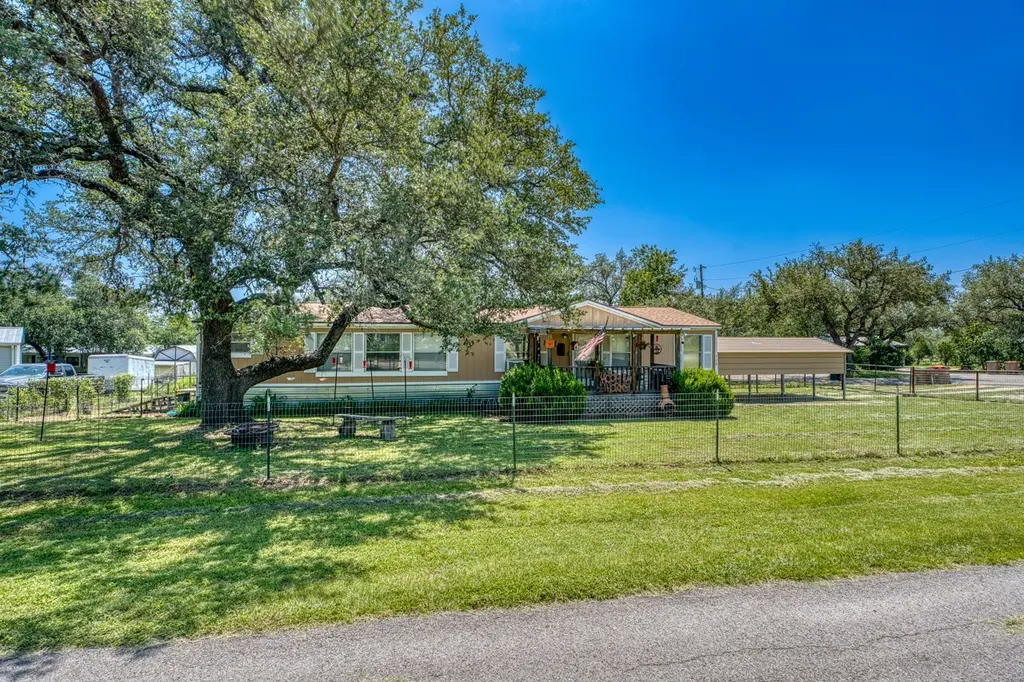
122 Heritage Dr · Johnson City, TX
Flood risk 1/10 · Minimal
- FEMA flood zone
- —
- Chance of flooding over 30 yrs
- 0.0%
- Est. flood insurance / yr
- —
Fire risk 5/10 · Moderate
- Est. fire insurance / yr
- $1,222 – $2,270
Heat risk 7/10 · Major
- Hot days now (above 105°F)
- 7 days/yr
- Hot days in 30 yrs
- 24 days/yr
Wind risk 6/10 · Moderate
- Chance of severe wind over 30 yrs
- 61.0%
Air-quality risk 1/10 · Minimal
- Unhealthy air days now
- 0 days/yr
- Unhealthy air days in 30 yrs
- 0 days/yr
Risk factors via First Street. Map © Google.
Why this score? — see what drove the C- grade
The composite is a weighted blend of 9 inputs, each scored 0–100. Each bar is that input's sub-score; the figure is the points it added to the 100-point composite (weight × sub-score).
- ARV discount +15.0/15.0
- Cash flow +14.6/30.0
- DSCR +4.5/10.0
- Schools +4.4/10.0
- Livability +3.8/5.0
- 1% rule +3.7/10.0
- Rent growth +2.5/5.0
- Condition / age +2.5/5.0
- Appreciation +0.0/10.0
$250,000
🖨 Deal sheet (PDF) 📄 Offer letter ✓ Due diligence
Listing remarks MLS
Well kept 1680 sf home with 3 bedrooms and two baths conveniently located in Johnson City. This is an older mobile home, but you would never know it! Many custom touches and very cozy home. Entire property is fenced so your family can enjoy both spacious front and back yards. Peaceful front porch to enjoy the beautiful outdoors. Very affordable all within one hour to Austin or San Antonio and 30 minutes to Marble Falls, Dripping Springs and Fredericksburg.
Key facts
- Spacious front yard
- Peaceful front porch
- Fenced property
Tags
Property features AI
Exterior
- Parking: Attached carport; Carport (has); 3 total parking spaces
- Utilities: Electricity connected; Water connected (public); Sewer connected (private)
- Home design: Single-story home; Faces northwest; Resale property; Entry on main level
- Construction: Built according to public records; Masonite exterior; Composition/shingle roof; Pillar/post/pier foundation
- Exterior features: Front porch; Porch; Perimeter fencing; Back yard; Front yard; No additional exterior features listed
Interior
- Kitchen: Free-standing electric range; Refrigerator
- Bedrooms: 3 main-level bedrooms
- Flooring: Carpet; Laminate
- Bathrooms: 2 full bathrooms
- Heating & cooling: Central heating; Central air; Ceiling fans; Wall/window unit(s)
- Interior features: Breakfast bar; Kitchen island; Double vanity; Main level primary bedroom; Storage; Walk-in closet(s); Ceiling fan(s); Solid surface counters; Laminate counters
- Laundry & utility: Dedicated laundry room
Neighborhood map
What this means for you Summary
Snapshot
- This is a 3-bed/2.0-bath single-family listed at $250k.
Deal economics
- At list price, monthly cash flow is $60 ($724/yr) — positive.
- The deal already cash-flows at list — no discount required.
- To meet the 1% rule (rent ≥ 1% of price), the offer needs to be $218k (12.6% below list).
- Recommended offer: $218k (12.6% below list) — sets the bar for 1% rule.
- Cap rate 6.6% vs local median 1.5% in Johnson City — top-decile yield for the area; either an underpriced asset or a hidden risk that comps aren't pricing in. Stress-test before assuming the spread holds.
Location & tenants
- Location reads 75/100 on livability (#131 in TX, #3,919 nationally) — a middle-class / working-renter tenant base. Strengths: crime A+, cost of living A+, housing A+; Watch: amenities F, commute F, employment D-.
- Johnson City ISD (rural): math 51% / reading 51% proficiency, ranked #141 of 826 in TX (top 17%) — acceptable for families but not a draw, mixed tenant base, ~2y average lease.
- Zoned schools: Lyndon B Johnson El (math 47% / reading 42%, grade F, #1,155 of 4,322 statewide, top 29%, 304 students, 47% FRL); Lyndon B Johnson Middle (math 47% / reading 52%, grade C, #356 of 1,662 statewide, top 23%, 171 students, 45% FRL); Lyndon B Johnson H S (math 64% / reading 67%, grade B, #191 of 1,632 statewide, top 12%, 247 students, 35% FRL).
- Market conditions: 229 active listings in the ZIP; 3 comparable units currently listed for rent nearby; rentals lingering (median 46d on market — plan ~5-8 weeks vacancy on turnover, expect pricing pressure); 67% of comp listings sitting > 30 days — soft ceiling on asking rent; 10 units permitted in Blanco County in 2024 (0 in 5+ unit buildings).
Forward outlook
- Local home prices are declining (-3.0%/yr); year-one equity from $2k of loan paydown is wiped out by about $8k of value loss. Plan a longer hold.
- Blanco County population projected at +14% by 2050 — modest demand growth; plan on rents tracking national, not racing it.
Negotiation context
- Only 2 days on market — expect competitive offers; lowballing is unlikely to land.
- 3 sale attempts since 4y ago with the ask held roughly flat each time — persistent listings suggest the price (not the market) is what's stuck; bring a comps-based counter.
Risks & watch-outs
- Climate carrying-cost: major wind risk, 61% chance of damaging wind over 30y; moderate wildfire risk; extreme-heat days projected 7→24/yr by 2055 (HVAC capex compounding) — expect insurance premiums to compound above CPI over the hold.
Questions for the listing agent
- Is there a deadline driving the sale (1031 exchange, divorce, estate, relocation)? That informs how much negotiation room exists.
- What's the average days-on-market for RENTAL listings here right now (not sales)? A rising rental-DOM trend means longer vacancies and softer asking-rent achievability than the comps imply.
- What's the recent tenant-quality profile in this submarket — average credit score on applications, eviction rate, late-payment / NSF rate, and stable-employment percentage? A property-management company in the area should have these aggregated.
- How much new for-sale + rental construction is in the pipeline within 1–3 miles? Heavy new supply typically softens prices + rents 12–24 months out; constrained supply supports both.
Investment metrics
- 1% rule
- 0.87% ✗
- Cap rate
- 6.58%
- Cash-on-cash
- 1.03%
- DSCR
- 1.05
- GRM
- 9.5
CMA / ARV
- ARV (on-the-fly)
- $425,040
- Comps found
- 4
Show comp detail 4 sales within ~0.75 mi
| Address | Dist | Beds/Ba | Sqft | Sold | Price | $/sf | Match |
|---|---|---|---|---|---|---|---|
| 710 Ranchview Dr | 0.53mi | 3/2.5 | 1,685 (+0%) | 11mo | $449,000 | $266 | 64 |
| 106 Autumn Sage Trl | 0.40mi | 3/2.0 | 1,493 (-11%) | 7mo | $377,728 | $253 | 57 |
| 116 Autumn Sage Trl | 0.45mi | 3/2.0 | 1,442 (-14%) | 2mo | $364,823 | $253 | 54 |
| 117 Autumn Sage Trl | 0.47mi | 3/2.0 | 1,493 (-11%) | 11mo | $377,729 | $253 | 50 |
Match score weights: distance 35% · size 25% · config 20% · recency 20%. Top-matched comps best support the ARV.
Projected returns pro-forma
-3.0% appreciation · 3.0% rent growth · sell at horizon
- IRR
- -14.7%
- Equity multiple
- 0.48×
- Total profit
- $-36,673
- Equity at exit
- $37,276
- IRR
- -6.0%
- Equity multiple
- 0.61×
- Total profit
- $-27,007
- Equity at exit
- $21,615
Cash invested: $70,000 (down + closing). Projections, not guarantees.
Landlord ↔ Tenant lean methodology
- Overall (STATE)
- 87 Strongly Landlord-Friendly
- State Texas
- 87 Strongly Landlord-Friendly · R+5
- County
- — inherits STATE
- City
- — inherits STATE
ZIP-level market 78636
- Home prices YoY
- -20.6%
- Active inventory
- 229
- Price-to-rent
- 9.5×
Monthly cashflow live
- Estimated rent
- $2,185 medium interval (Pro) →
- Mortgage (P&I)
- −$1,311
- Tax from tax record
- −$250 /mo · $3,005/yr
- Insurance
- −$104
- HOA
- −$0
- Vacancy / Maint / Mgmt
- −$459
- Net cashflow
- $60
Break-even live
Sensitivity live
| Price | -10% $202 | -5% $131 | +0% $60 | +5% $-10 | +10% $-81 |
|---|---|---|---|---|---|
| Rent | -10% $-112 | -5% $-26 | +0% $60 | +5% $147 | +10% $233 |
| Rate | -1.0pp $186 | -0.5pp $124 | base $60 | +0.5pp $-4 | +1.0pp $-70 |
UW: 25.0% down · 7.5% · 30yr · 1.5% tax · 5.0% vac · 8.0% maint · 8.0% mgmt
Financing live
Cash to close
- Down payment
- $62,500
- Closing costs
- $7,500
- Reserves months
- —
- Total cash needed
- —
Loan-product check · same deal, 3 products live
Conventional
25% down · 7.5% · 30yr
- Down + closing
- —
- Monthly P&I
- —
- Monthly cashflow
- —
- DSCR
- —
- Eligible?
- —
Personal DTI + credit; lowest rate.
DSCR
20% down · 8.5% · 30yr
- Down + closing
- —
- Monthly P&I
- —
- Monthly cashflow
- —
- DSCR
- —
- Eligible?
- —
No personal income docs; deal must DSCR.
Hard money
10% down · 12.0% · 12mo
- Down + closing
- —
- Monthly P&I
- —
- Monthly cashflow
- —
- DSCR
- —
- Eligible?
- —
Short-term bridge; refi at stabilization.
Rent comps 3 comps
| Address | Beds | Baths | Sqft | Rent | $/sqft | DOM | Units | Dist |
|---|---|---|---|---|---|---|---|---|
| 114 Scofield Ave Unit 109 Johnson City, TX | 2.0 | 1.5 | 1200 | $1,695 | $1.41 | 45d | 1 | 0.84mi |
| 107 E Dawn Dr Johnson City, TX | 4.0 | 2.0 | 1596 | $2,300 | $1.44 | 19d | 1 | 0.90mi |
| 205 N Avenue J Johnson City, TX | 3.0 | 2.5 | 1959 | $2,650 | $1.35 | 45d | 1 | 1.36mi |
Listing history 2 events
-
2026-06-21remarks 461-char remark
-
2026-06-21$250,000 Active 2 DOM
ⓘ Source: listings_history table (triggers on properties + properties_extension) + one-shot
backfill from property_details.listing_events for pre-trigger history.
Tax reassessment forecast TX · Resets to sale price
- Current annual tax
- $3,005 · $250/mo
- Projected year-2 tax
- $4,575 · $381/mo
- Expected delta
- +$1,570/yr (+$131/mo · 52.2%)
ⓘ Screening estimate from a state-policy table — verify with the county assessor before closing.
Climate risk First Street
- Flood 1/10 Low 0% chance over 30 yrs
- Wildfire 5/10 Major
- Heat 7/10 Severe 7 d/yr ≥105°F today · 24 d/yr by 30 yrs out
- Wind 6/10 Major 61% chance of damaging wind over 30 yrs
- Air quality 1/10 Low 0 unhealthy d/yr today · 0 by 30 yrs out
Nearby sold comps map
Loading sold comps map…
Walkable amenities ~0.75 mi
Loading nearby amenities…
Taxation est. · year 1
- Rental income
- $26,217
- − Mortgage interest
- −$14,004
- − Property taxes
- −$3,005
- − Insurance
- −$1,250
- − Repairs & maintenance
- −$2,097
- − Management
- −$2,097
- − Depreciation
- −$7,273
- Taxable loss
- −$3,509
- Est. tax savings @ 24.0%
- +$842
- After-tax cash flow
- $1,566/yr
For passive investors: Depreciation is non-cash, so a rental often shows a tax loss while cash-flowing — sheltering income. Rental losses are passive: they offset passive income freely, and up to $25,000/yr can offset ordinary (W-2) income if you actively participate and your MAGI is under $100k (phasing out to $0 by $150k); unused losses carry forward. On sale, claimed depreciation is recaptured at up to 25%, and gains may owe capital-gains tax (a 1031 exchange can defer both). Figures are a year-1 estimate at your 24.0% rate — not tax advice; consult a CPA.
Schools (NCES district)
- District
- Johnson City ISD
- NCES district ID
- 4824840
- Math proficiency
- 51% ▼ -10.00%
- Reading proficiency
- 51% ▬ 0.00%
- Median HH income
- $58,854
- Composite
- 44.47/100
- National rank
- #2803
- State rank
- #141 of 826 in TX
Livability — Johnson City
- Score
- 75/100
- State rank
- #131
- US rank
- #3919
Category grades
Schools grade is shown separately in the Schools card above.
Census & demographics
- Census place
- Johnson City, TX
- Population (ZIP)
- 3,842
Population outlook (Blanco County) Hauer SSP2
- Today (2025)
- 12,277 people
- By 2030
- 12,790 · +4.2%
- By 2040
- 13,520 · +10.1%
- By 2050
- 13,976 · +13.8%
- By 2075
- 15,049 · +22.6%
- By 2100
- 15,057 · +22.6%
Race, ethnicity, and origin ACS 2023
- Neighborhood character
- Predominantly White (80%)
- Race & ethnicity
- White 80% Hispanic / Latino 15% Two or more races 11% Asian 1%
- Hispanic origin (detail)
- Mexican 12%
- Common ancestry
- Slovak 5% Lithuanian 4% Serbian 2%
- Foreign-born
- 4% · Canada, Dominican Republic
- Languages at home
- 90% English-only · Spanish 7% Other Asian/Pacific 1% Other Indo-European 1%
Political lean MEDSL · Blanco
- 2024 margin
- Solid R (+52.5) · D 23.2% · R 75.7% · Other 1.1%
- 2008→2024 swing
- -13.0pp toward R · 2008: -39.5pp · 2024: -52.5pp
- All cycles
- 2024: R+52.5 2020: R+47.5 2016: R+52.4 2012: R+48.6 2008: R+39.5
Not yet ingested
- Civics
- —
Market trends
- HPI YoY
- ▼ -71.91%
- Current HPI
- 277.8899
- Rent YoY
- —
- Metro
- —
- State GDP YoY
- ▲ 3.95%
- F500 in state
- 110
Industry mix (Fortune 500 HQ in TX)
| Industry | F500 HQs | Revenue |
|---|---|---|
| Energy | 16 | $1,198B |
|
||
| Technology | 5 | $198B |
|
||
| Engineering / Construction | 4 | $72B |
|
||
| Energy Services | 3 | $60B |
|
||
| Utilities | 3 | $41B |
|
||
| Healthcare | 2 | $330B |
|
||
Price history
+13.6% since first listed6 events — show timeline
- 2026-06-19 Listed $250,000 CHCMLS
- 2026-06-19 Listed $250,000 Unlock MLS
- 2022-09-09 Sold (MLS) — Unlock MLS
- 2022-08-03 Contingent — Unlock MLS
- 2022-07-29 Listed $220,000 Unlock MLS
- 1995-03-17 Sold (Public Records) — Public Records
Property tax history
+9.8%/yrLatest (2026): $3,005 · +10.0% YoY. Source: county tax records.
Cash-flow waterfall
monthlySold comps — $/sqft
last 12 mo · ≤1 miLoading sold comps…