 6-Plex
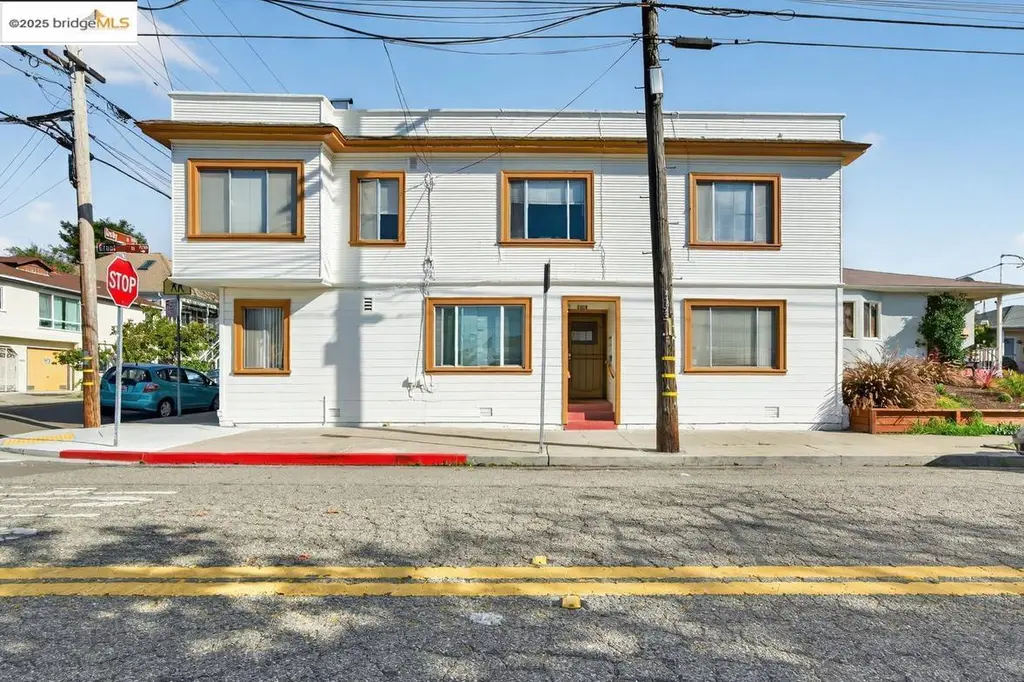
2701 Grant St · Berkeley, CA
Flood risk 1/10 · Minimal
- FEMA flood zone
- X (unshaded)
- Chance of flooding over 30 yrs
- 0.0%
- Est. flood insurance / yr
- $507 – $1,088
Fire risk 1/10 · Minimal
- Est. fire insurance / yr
- $659 – $1,223
Heat risk 3/10 · Minor
- Hot days now (above 82°F)
- 7 days/yr
- Hot days in 30 yrs
- 15 days/yr
Wind risk 1/10 · Minimal
- Chance of severe wind over 30 yrs
- —
Air-quality risk 9/10 · Severe
- Unhealthy air days now
- 16 days/yr
- Unhealthy air days in 30 yrs
- 16 days/yr
Risk factors via First Street. Map © Google.
Why this score? — see what drove the C+ grade
The composite is a weighted blend of 9 inputs, each scored 0–100. Each bar is that input's sub-score; the figure is the points it added to the 100-point composite (weight × sub-score).
- Cash flow +22.9/30.0
- ARV discount +13.0/15.0
- DSCR +7.4/10.0
- 1% rule +6.5/10.0
- Schools +5.7/10.0
- Livability +3.9/5.0
- Rent growth +2.8/5.0
- Condition / age +2.5/5.0
- Appreciation +0.0/10.0
$1,099,000
🖨 Deal sheet 📄 Offer letter ✓ Due diligence
Multi-family units
County records classify this as Multi-Family (5+ Unit). Listing-text estimate: 6 units. confirmed
5+ unit building — per-unit beds/baths from public records are typically unavailable; the breakdown below (if shown) is an estimate from the listing text.
Listing remarks MLS
Six unit building with five 1 bedroom units and 1 studio unit. Great South Central Berkeley location with close proximity to shopping and Berkeley eateries. Might be subject to Rent Control.
Key facts
- 2,000 sq ft lot
- Built 1905
- Listed 212 days
Tags
Neighborhood map
What this means for you Summary
Snapshot
- This is a 5×1bd/1ba + 1×?bd/1ba units multifamily listed at $1.10M.
Deal economics
- At list price, monthly cash flow is $2k ($23k/yr) — positive. Per door: $323/mo.
- The deal already cash-flows at list — no discount required.
- Meets the 1% rule at list price ($13k rent vs $1.10M).
- Recommended offer: $967k (12.0% below list) — sets the bar for market timing.
- Cap rate 8.4% vs local median 2.0% in Berkeley — top-decile yield for the area; either an underpriced asset or a hidden risk that comps aren't pricing in. Stress-test before assuming the spread holds.
Location & tenants
- Location reads 77/100 on livability (#74 in CA, #2,860 nationally) — a middle-class / working-renter tenant base. Strengths: schools A+, amenities A+, commute A+; Watch: crime F, cost of living F.
- Berkeley Unified (urban): math 61% / reading 67% proficiency, ranked #175 of 1,400 in CA (top 12%) — acceptable for families but not a draw, mixed tenant base, ~2y average lease.
- Market conditions: Rents rising (+1.1%/yr); 53 active listings in the ZIP; 4 comparable units currently listed for rent nearby; rentals at typical pace (median 25d on market — plan ~3-4 weeks tenant-placement turnaround); solid renter incomes; 1,742 units permitted in Alameda County in 2024 (856 in 5+ unit buildings).
- At $12,679/mo this rent would consume 138% of the median local household income ($110k/yr) (locally 1402% of renters already pay >50% of income on rent) — very limited rent-growth headroom before tenants either downsize or default.
Forward outlook
- Local home prices are declining (-3.0%/yr); year-one equity from $8k of loan paydown is wiped out by about $33k of value loss. Plan a longer hold.
- Alameda County population projected at +34% by 2050 — long-run rental-demand tailwind backs the buy-and-hold thesis.
Negotiation context
- It's been on market 213 days — a 12% lower offer ($967k) is reasonable based on typical stale-listing flexibility.
Risks & watch-outs
- Watch-outs: built in 1905 — expect roof / HVAC / electrical / plumbing capex.
Questions for the listing agent
- It's been on market 213 days. Have you received any prior offers? Is the seller open to a 12% concession, seller financing, or rate buy-down credit?
- Can we see the unit-by-unit rent roll, current vacancy, and any below-market leases? What's the average tenancy length?
- What capital expenditures (roof, boiler, parking lot, exteriors) have been made in the last 5 years, and what's planned in the next 2?
- Built in 1905 — when were the roof, HVAC, electrical panel, plumbing, and water heater last replaced?
- Why hasn't it sold? Are there any deal-killer items the seller is aware of (foundation, flood, title, zoning, code violations)?
- Is there a deadline driving the sale (1031 exchange, divorce, estate, relocation)? That informs how much negotiation room exists.
- Schools are A-rated — typically a magnet for longer-tenancy family renters. What's the average tenant stay here, and is there a school-zone premium baked into asking?
- Crime grade is F in this area — have there been break-ins, vandalism, or insurance claims at this property in the last 3 years? What carrier currently insures it and at what premium?
- What's the average days-on-market for RENTAL listings here right now (not sales)? A rising rental-DOM trend means longer vacancies and softer asking-rent achievability than the comps imply.
- What's the recent tenant-quality profile in this submarket — average credit score on applications, eviction rate, late-payment / NSF rate, and stable-employment percentage? A property-management company in the area should have these aggregated.
- How much new apartment / multifamily construction is in the pipeline within 1–3 miles? Heavy new supply (>2% of stock underway) typically softens rents 12–24 months out; light construction supports rent growth.
Investment metrics
- 1% rule
- 1.15% ✓
- Cap rate
- 8.41%
- Cash-on-cash
- 7.55%
- DSCR
- 1.34
- GRM
- 7.2
CMA / ARV
- ARV (median comp)
- $1,251,859
- List price
- $1,099,000
- Delta
- -12.21%
- Verdict
- UNDERPRICED
- Comps
- 20 within 1.0 mi
Show comp detail 10 sales within ~0.75 mi
| Address | Dist | Beds/Ba | Sqft | Sold | Price | $/sf | Match |
|---|---|---|---|---|---|---|---|
| 3118 King St | 0.55mi | 6/3.5 | 2,472 (-2%) | 10mo | $2,285,000 | $924 | 52 |
| 2721 California St | 0.25mi | 7/5.0 (+1) | 2,815 (+11%) | 15mo | $870,000 | $309 | 48 |
| 1916 Woolsey St | 0.57mi | 5/3.0 (-1) | 2,571 (+2%) | 9mo | $1,705,000 | $663 | 47 |
| 2006 Parker St | 0.27mi | 5/3.0 (-1) | 2,204 (-13%) | 9mo | $1,350,000 | $613 | 41 |
| 3110 California St | 0.59mi | 5/4.0 (-1) | 2,244 (-11%) | 1mo | $1,200,000 | $535 | 39 |
| 2914 Stanton St | 0.52mi | 5/3.0 (-1) | 2,355 (-7%) | 9mo | $1,250,000 | $531 | 39 |
| 1345 Parker St | 0.55mi | 7/3.0 (+1) | 2,485 (-2%) | 22mo | $1,100,000 | $443 | 36 |
| 6528 Dover St | 0.67mi | 5/4.0 (-1) | 2,236 (-12%) | 9mo | $1,700,000 | $760 | 29 |
| 1817 Woolsey St | 0.54mi | 5/3.0 (-1) | 2,265 (-11%) | 21mo | $1,040,000 | $459 | 23 |
| 1313 Haskell St | 0.75mi | 5/5.0 (-1) | 2,203 (-13%) | 21mo | $1,530,000 | $695 | 17 |
Match score weights: distance 35% · size 25% · config 20% · recency 20%. Top-matched comps best support the ARV.
Projected returns pro-forma
-3.0% appreciation · 1.14% rent growth · sell at horizon
- IRR
- -6.9%
- Equity multiple
- 0.75×
- Total profit
- $-77,526
- Equity at exit
- $163,864
- IRR
- 0.1%
- Equity multiple
- 1.00×
- Total profit
- $1,241
- Equity at exit
- $95,021
Cash invested: $307,720 (down + closing). Projections, not guarantees.
Landlord ↔ Tenant lean methodology
- Overall (CITY)
- 0 Strongly Tenant-Friendly
- State California
- 18 Strongly Tenant-Friendly · D+13
- County
- — inherits STATE
- City Berkeley
- 0 Strongly Tenant-Friendly · D+78
ZIP-level market 94703
- Rents YoY
- 1.1%
- Active inventory
- 53
- Price-to-rent
- 43.7×
Monthly cashflow live
- Estimated rent
- $12,679 high interval (Pro) →
- Mortgage (P&I)
- −$5,763
- Tax from tax record
- −$1,858 /mo · $22,299/yr
- Insurance
- −$458
- HOA
- −$0
- Vacancy / Maint / Mgmt
- −$2,663
- Net cashflow
- $1,937
Break-even live
6-unit breakdown (identical units grouped — click to expand)
| Units | Beds | Baths | Est. rent |
|---|---|---|---|
| 5× units | 1 | 1 | $10,485 |
| #1 | 1 | 1 | $2,097 |
| #2 | 1 | 1 | $2,097 |
| #3 | 1 | 1 | $2,097 |
| #4 | 1 | 1 | $2,097 |
| #5 | 1 | 1 | $2,097 |
| 1× unit | 0 | 1 | $2,196 |
| Total (6 units) | $12,679 | ||
UW: 25.0% down · 7.5% · 30yr · 1.5% tax · 5.0% vac · 8.0% maint · 8.0% mgmt
Financing live
Cash to close
- Down payment
- $274,750
- Closing costs
- $32,970
- Reserves months
- —
- Total cash needed
- —
Loan-product check · same deal, 3 products live
Conventional
25% down · 7.5% · 30yr
- Down + closing
- —
- Monthly P&I
- —
- Monthly cashflow
- —
- DSCR
- —
- Eligible?
- —
Personal DTI + credit; lowest rate.
DSCR
20% down · 8.5% · 30yr
- Down + closing
- —
- Monthly P&I
- —
- Monthly cashflow
- —
- DSCR
- —
- Eligible?
- —
No personal income docs; deal must DSCR.
Hard money
10% down · 12.0% · 12mo
- Down + closing
- —
- Monthly P&I
- —
- Monthly cashflow
- —
- DSCR
- —
- Eligible?
- —
Short-term bridge; refi at stabilization.
Rent comps 4 comps
| Address | Beds | Baths | Sqft | Rent | $/sqft | DOM | Units | Dist |
|---|---|---|---|---|---|---|---|---|
| 1235 Carrison St Berkeley, CA | 6.0 | 4.0 | 2332 | $1,950 | $0.84 | 44d | 1 | 0.81mi |
| 6022 Telegraph Ave Oakland, CA | 5.0 | 3.0 | 1900 | $5,199 | $2.74 | 5d | 1 | 1.07mi |
| 1730 Francisco St Berkeley, CA | 5.0 | 3.5 | 2250 | $8,000 | $3.56 | 24d | 1 | 1.09mi |
| 1122 University Ave Berkeley, CA | 5.0 | 1.0–4.0 | 1129 | $6,420 | $5.68 | 2d | 20 | 1.20mi |
Listing history 17 events
-
2026-06-18days on market $1,099,000 Active 213 DOM
-
2026-06-17days on market $1,099,000 Active 212 DOM
-
2026-06-16days on market $1,099,000 Active 211 DOM
-
2026-06-15days on market $1,099,000 Active 210 DOM
-
2026-06-13days on market $1,099,000 Active 208 DOM
-
2026-06-13days on market $1,099,000 Active 207 DOM
-
2026-06-09days on market $1,099,000 Active 204 DOM
-
2026-06-08days on market $1,099,000 Active 203 DOM
-
2026-06-07days on market $1,099,000 Active 202 DOM
-
2026-06-04days on market $1,099,000 Active 199 DOM
-
2026-06-03days on market $1,099,000 Active 198 DOM
-
2026-06-02days on market $1,099,000 Active 197 DOM
-
2026-06-01days on market $1,099,000 Active 196 DOM
-
2026-05-31days on market $1,099,000 Active 195 DOM
-
2026-02-11price $1,099,000 193-char remark
Show marketing remark (193 chars)
Six unit building with five 1 bedroom units and 1 studio unit. Great South Central Berkeley location with close proximity to shopping and Berkeley eateries. Might be subject to Rent Control.
-
2025-11-17$1,250,000 Active 193-char remark
Show marketing remark (193 chars)
Six unit building with five 1 bedroom units and 1 studio unit. Great South Central Berkeley location with close proximity to shopping and Berkeley eateries. Might be subject to Rent Control.
-
2021-07-01historical
ⓘ Source: listings_history table (triggers on properties + properties_extension) + one-shot
backfill from property_details.listing_events for pre-trigger history.
Tax reassessment forecast CA · Resets to sale price
- Current annual tax
- $22,299 · $1,858/mo
- Projected year-2 tax
- $22,299 · $1,858/mo
- Expected delta
- $0/yr ($0/mo · 0.0%)
ⓘ Screening estimate from a state-policy table — verify with the county assessor before closing.
Climate risk First Street
- Flood 1/10 Low FEMA zone X (unshaded) · 0% chance over 30 yrs
- Wildfire 1/10 Low
- Heat 3/10 Moderate 7 d/yr ≥82°F today · 15 d/yr by 30 yrs out
- Wind 1/10 Low
- Air quality 9/10 Extreme 16 unhealthy d/yr today · 16 by 30 yrs out
Nearby sold comps map
Loading sold comps map…
Walkable amenities ~0.75 mi
Loading nearby amenities…
Taxation est. · year 1
- Rental income
- $152,148
- − Mortgage interest
- −$61,561
- − Property taxes
- −$22,299
- − Insurance
- −$5,495
- − Repairs & maintenance
- −$12,172
- − Management
- −$12,172
- − Depreciation
- −$31,971
- Taxable income
- $6,479
- Est. tax owed @ 24.0%
- −$1,555
- After-tax cash flow
- $21,689/yr
For passive investors: Depreciation is non-cash, so a rental often shows a tax loss while cash-flowing — sheltering income. Rental losses are passive: they offset passive income freely, and up to $25,000/yr can offset ordinary (W-2) income if you actively participate and your MAGI is under $100k (phasing out to $0 by $150k); unused losses carry forward. On sale, claimed depreciation is recaptured at up to 25%, and gains may owe capital-gains tax (a 1031 exchange can defer both). Figures are a year-1 estimate at your 24.0% rate — not tax advice; consult a CPA.
Schools (NCES district)
- District
- Berkeley Unified
- NCES district ID
- 0604740
- Math proficiency
- 61% ▲ 2.00%
- Reading proficiency
- 67% ▲ 2.00%
- Median HH income
- $66,202
- Composite
- 57.37/100
- National rank
- #2288
- State rank
- #175 of 1400 in CA
Livability — Berkeley
- Score
- 77/100
- State rank
- #74
- US rank
- #2860
Category grades
Schools grade is shown separately in the Schools card above.
Census & demographics
- Census place
- Berkeley, CA
- County
- Alameda County · 1,614,355 people
- City population
- 121,632
- Metro
- San Francisco-Oakland-Berkeley, CA
- Population (ZIP)
- 20,934
- Household income
- $109,881
- Rent vs Own
- Severe rent burden
- 1402.0
Population outlook (Alameda County) Hauer SSP2
- Today (2025)
- 1,928,884 people
- By 2030
- 2,069,146 · +7.3%
- By 2040
- 2,338,405 · +21.2%
- By 2050
- 2,586,608 · +34.1%
- By 2075
- 3,061,911 · +58.7%
- By 2100
- 3,234,133 · +67.7%
Race, ethnicity, and origin ACS 2023
- Neighborhood character
- Diverse neighborhood (Simpson 0.67)
- Race & ethnicity
- White 52% Asian 15% Hispanic / Latino 14% Two or more races 12% Black 12%
- Hispanic origin (detail)
- Mexican 10%
- Common ancestry
- Italian 4% Scotch-Irish 4% Romanian 3%
- Foreign-born
- 19% · Canada, China, South Korea
- Languages at home
- 75% English-only · Spanish 11% Other Indo-European 4% Chinese 3%
Political lean MEDSL · Alameda
- 2024 margin
- Solid D (+53.6) · D 74.6% · R 21.0% · Other 4.4%
- 2008→2024 swing
- -5.9pp toward R · 2008: 59.5pp · 2024: 53.6pp
- All cycles
- 2024: D+53.6 2020: D+62.5 2016: D+64.4 2012: D+59.8 2008: D+59.5
Not yet ingested
- Civics
- —
Market trends
- HPI YoY
- ▼ -1156.26%
- Current HPI
- 339.6539
- Rent YoY
- ▲ 1.14%
- Metro
- San Francisco-Oakland-Berkeley, CA
- State GDP YoY
- ▲ 3.21%
- F500 in state
- 116
Industry mix (Fortune 500 HQ in CA)
| Industry | F500 HQs | Revenue |
|---|---|---|
| Technology | 27 | $1,492B |
|
||
| Financial Services | 3 | $174B |
|
||
| Retail | 3 | $44B |
|
||
| Insurance | 3 | $26B |
|
||
| Media / Entertainment | 2 | $115B |
|
||
| Pharmaceuticals / Biotech | 2 | $62B |
|
||
Price history
-12.1% since first listed3 events — show timeline
- 2026-02-11 Price Changed $1,099,000 bridgeMLS, Bay East AOR, or Contra Costa AOR
- 2025-11-17 Listed $1,250,000 bridgeMLS, Bay East AOR, or Contra Costa AOR
- 2021-07-01 Listing Removed — bridgeMLS, Bay East AOR, or Contra Costa AOR
Property tax history
+11.1%/yrLatest (2025): $22,299 · +216.1% YoY. Source: county tax records.
Cash-flow waterfall
monthlySold comps — $/sqft
last 12 mo · ≤1 miLoading sold comps…