17 S Oregon St · Johnstown, OH
Flood risk 1/10 · Minimal
- FEMA flood zone
- X (unshaded)
- Chance of flooding over 30 yrs
- 0.0%
- Est. flood insurance / yr
- $473 – $860
Fire risk 1/10 · Minimal
- Est. fire insurance / yr
- $713 – $1,323
Heat risk 3/10 · Minor
- Hot days now (above 97°F)
- 7 days/yr
- Hot days in 30 yrs
- 18 days/yr
Wind risk 2/10 · Minimal
- Chance of severe wind over 30 yrs
- 1.0%
Air-quality risk 2/10 · Minimal
- Unhealthy air days now
- 2 days/yr
- Unhealthy air days in 30 yrs
- 2 days/yr
Risk factors via First Street. Map © Google.
Why this score? — see what drove the D+ grade
The composite is a weighted blend of 9 inputs, each scored 0–100. Each bar is that input's sub-score; the figure is the points it added to the 100-point composite (weight × sub-score).
- Cash flow +12.3/30.0
- ARV discount +12.3/15.0
- Schools +6.5/10.0
- Livability +3.9/5.0
- DSCR +3.7/10.0
- 1% rule +2.9/10.0
- Rent growth +2.5/5.0
- Condition / age +2.5/5.0
- Appreciation +0.0/10.0
$290,000
🖨 Deal sheet 📄 Offer letter ✓ Due diligence
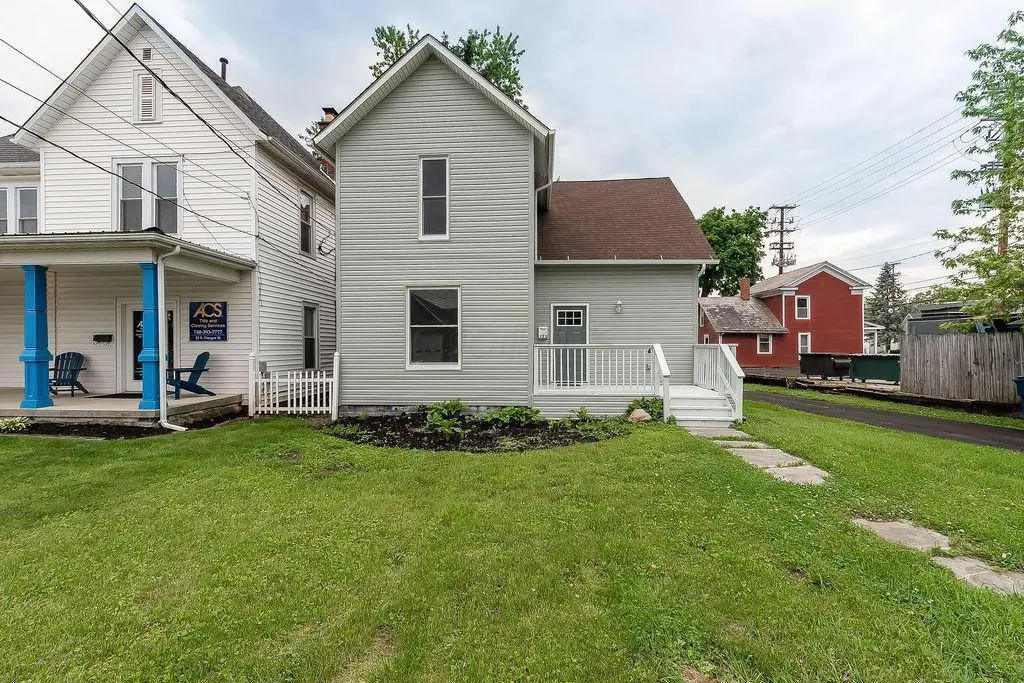
Listing remarks
Beautifully updated home in the desirable Johnstown School District with major mechanical and exterior improvements already done for you. This 4-bedroom, 2-bath home offers a flexible layout featuring a convenient first-floor bedroom and full bath. Currently residential with potential to go commercial. The main level flows comfortably for everyday living, while upstairs you'll find three additional bedrooms and a second full bath, providing space and separation for family or guests. Enjoy peace of mind with big-ticket updates already completed, including newer HVAC (approx. 4 years old) and water heater, roof, siding, windows, doors, and appliances all replaced within the last 6 years. This
Key facts
- First-floor bedroom
- Roof
- Water heater
Tags
Property features AI
Exterior
- Utilities: Public water; Public sewer
- Home design: Single-family residence; Two levels; Built in 1910
- Construction: No shared/common walls
- Exterior features: Poured foundation
Interior
- Bedrooms: One main-level bedroom
- Flooring: Carpet; Vinyl
- Bathrooms: Two full bathrooms
- Heating & cooling: Forced air heating; Central air conditioning
- Interior features: Insulated windows; Crawl space and partial basement
Neighborhood map
What this means for you Summary
Snapshot
- This is a 3-bed/1.0-bath single-family listed at $290k.
Deal economics
- At list price, monthly cash flow is $-50 ($-605/yr) — negative.
- To cash-flow at today's rent, offer at most $281k (3.1% below list).
- To meet the 1% rule (rent ≥ 1% of price), the offer needs to be $229k (21.0% below list).
- Recommended offer: $229k (21.0% below list) — sets the bar for 1% rule.
- Cap rate 6.1% vs local median 3.8% in Johnstown — top-decile yield for the area; either an underpriced asset or a hidden risk that comps aren't pricing in. Stress-test before assuming the spread holds.
Location & tenants
- Location reads 77/100 on livability (#186 in OH, #2,873 nationally) — a middle-class / working-renter tenant base. Strengths: crime A+, employment A+, cost of living A+; Watch: amenities F, commute F.
- Johnstown-Monroe Local (town): math 70% / reading 79% proficiency, ranked #85 of 656 in OH (top 13%) — strong family-tenant draw, lease renewals of 3-5y typical; only 20% free/reduced lunch — higher-income household profile.
- Market conditions: 66 active listings in the ZIP; 4 comparable units currently listed for rent nearby; rentals at typical pace (median 16d on market — plan ~3-4 weeks tenant-placement turnaround); high-income renter base; 159 units permitted in Licking County in 2024 (0 in 5+ unit buildings).
Forward outlook
- Local home prices are declining (-3.0%/yr); year-one equity from $2k of loan paydown is wiped out by about $9k of value loss. Plan a longer hold.
Negotiation context
- It's been on market 23 days — a 2% lower offer ($286k) is reasonable based on typical stale-listing flexibility.
- 6 sale attempts since 22y ago with the ask held roughly flat each time — persistent listings suggest the price (not the market) is what's stuck; bring a comps-based counter.
- Current owner paid $97k; list at $290k implies a 199% gain — meaningful room to come down on a strong offer.
Risks & watch-outs
- Watch-outs: built in 1910 — expect roof / HVAC / electrical / plumbing capex.
Questions for the listing agent
- What do current leases actually rent for vs. the listed asking? Can we see a recent rent roll and the last 12 months of T-12 income?
- Built in 1910 — when were the roof, HVAC, electrical panel, plumbing, and water heater last replaced?
- Is there a deadline driving the sale (1031 exchange, divorce, estate, relocation)? That informs how much negotiation room exists.
- Schools are A-rated — typically a magnet for longer-tenancy family renters. What's the average tenant stay here, and is there a school-zone premium baked into asking?
- The area grade is low — what's the realistic commute time and amenity access for the typical tenant pool here? Any planned neighborhood developments (good or bad) we should know about?
- What's the average days-on-market for RENTAL listings here right now (not sales)? A rising rental-DOM trend means longer vacancies and softer asking-rent achievability than the comps imply.
- What's the recent tenant-quality profile in this submarket — average credit score on applications, eviction rate, late-payment / NSF rate, and stable-employment percentage? A property-management company in the area should have these aggregated.
- How much new for-sale + rental construction is in the pipeline within 1–3 miles? Heavy new supply typically softens prices + rents 12–24 months out; constrained supply supports both.
Investment metrics
- 1% rule
- 0.79% ✗
- Cap rate
- 6.08%
- Cash-on-cash
- -0.75%
- DSCR
- 0.97
- GRM
- 10.5
CMA / ARV
- ARV (median comp)
- $324,738
- List price
- $290,000
- Delta
- -10.70%
- Verdict
- UNDERPRICED
- Comps
- 20 within 1.0 mi
Show comp detail 12 sales within ~0.75 mi
| Address | Dist | Beds/Ba | Sqft | Sold | Price | $/sf | Match |
|---|---|---|---|---|---|---|---|
| 111 Edwards Rd | 0.30mi | 3/1.5 | 1,732 (+4%) | 1mo | $410,000 | $237 | 76 |
| 256 S Kasson St | 0.39mi | 3/2.0 | 1,764 (+6%) | 9mo | $295,000 | $167 | 60 |
| 416 Sunset Dr | 0.53mi | 3/2.0 | 1,675 (+1%) | 16mo | $280,000 | $167 | 57 |
| 65 Benedict Dr | 0.38mi | 3/2.0 | 1,488 (-10%) | 6mo | $289,500 | $195 | 56 |
| 304 Central Station Dr | 0.66mi | 3/2.0 | 1,695 (+2%) | 14mo | $415,000 | $245 | 50 |
| 57 Northview Dr | 0.46mi | 4/2.0 (+1) | 1,557 (-6%) | 14mo | $335,000 | $215 | 48 |
| 25 Lewis Dr | 0.63mi | 3/1.0 | 1,525 (-8%) | 15mo | $317,000 | $208 | 45 |
| 562 Cannondale Ave | 0.68mi | 3/2.0 | 1,452 (-12%) | 2mo | $494,900 | $341 | 42 |
| 199 Sunset Dr S | 0.67mi | 4/2.0 (+1) | 1,591 (-4%) | 15mo | $208,000 | $131 | 40 |
| 144 Payne St | 0.37mi | 4/2.5 (+1) | 1,880 (+13%) | 18mo | $369,900 | $197 | 35 |
| 221 De Rosa Dr | 0.74mi | 3/2.0 | 1,437 (-13%) | 15mo | $490,000 | $341 | 26 |
| 559 Cannondale Ave | 0.71mi | 3/2.0 | 1,414 (-15%) | 17mo | $421,000 | $298 | 24 |
Match score weights: distance 35% · size 25% · config 20% · recency 20%. Top-matched comps best support the ARV.
Projected returns pro-forma
-3.0% appreciation · 3.0% rent growth · sell at horizon
- IRR
- -17.6%
- Equity multiple
- 0.38×
- Total profit
- $-50,257
- Equity at exit
- $43,240
- IRR
- -9.7%
- Equity multiple
- 0.41×
- Total profit
- $-48,114
- Equity at exit
- $25,074
Cash invested: $81,200 (down + closing). Projections, not guarantees.
Landlord ↔ Tenant lean methodology
- Overall (STATE)
- 73 Landlord-Friendly
- State Ohio
- 73 Landlord-Friendly · R+6
- County
- — inherits STATE
- City
- — inherits STATE
ZIP-level market 43031
- Active inventory
- 66
- Price-to-rent
- 10.5×
Monthly cashflow live
- Estimated rent
- $2,292 medium interval (Pro) →
- Mortgage (P&I)
- −$1,521
- Tax from tax record
- −$220 /mo · $2,638/yr
- Insurance
- −$121
- HOA
- −$0
- Vacancy / Maint / Mgmt
- −$481
- Net cashflow
- $-50
Break-even live
UW: 25.0% down · 7.5% · 30yr · 1.5% tax · 5.0% vac · 8.0% maint · 8.0% mgmt
Financing live
Cash to close
- Down payment
- $72,500
- Closing costs
- $8,700
- Reserves months
- —
- Total cash needed
- —
Loan-product check · same deal, 3 products live
Conventional
25% down · 7.5% · 30yr
- Down + closing
- —
- Monthly P&I
- —
- Monthly cashflow
- —
- DSCR
- —
- Eligible?
- —
Personal DTI + credit; lowest rate.
DSCR
20% down · 8.5% · 30yr
- Down + closing
- —
- Monthly P&I
- —
- Monthly cashflow
- —
- DSCR
- —
- Eligible?
- —
No personal income docs; deal must DSCR.
Hard money
10% down · 12.0% · 12mo
- Down + closing
- —
- Monthly P&I
- —
- Monthly cashflow
- —
- DSCR
- —
- Eligible?
- —
Short-term bridge; refi at stabilization.
Rent comps 4 comps
| Address | Beds | Baths | Sqft | Rent | $/sqft | DOM | Units | Dist |
|---|---|---|---|---|---|---|---|---|
| 137 S Williams St Johnstown, OH | 2.0 | 1.0 | 1312 | $1,100 | $0.84 | 16d | 1 | 0.26mi |
| 291 S Main St Johnstown, OH | 4.0 | 2.0 | 1712 | $2,700 | $1.58 | 10d | 1 | 0.41mi |
| 291 S Main St Johnstown, OH | 4.0 | 2.0 | 1712 | $2,700 | $1.58 | 43d | 1 | 0.41mi |
| 304 Gray Fox Ct Johnstown, OH | 3.0 | 2.5 | 1710 | $2,599 | $1.52 | 4d | 1 | 1.07mi |
Listing history 28 events
-
2026-06-18days on market $290,000 Active 23 DOM
-
2026-06-17days on market $290,000 Active 22 DOM
-
2026-06-16days on market $290,000 Active 21 DOM
-
2026-06-15price $290,000 Active 20 DOM
-
2026-06-15days on market $309,900 Active 20 DOM
-
2026-06-13days on market $309,900 Active 18 DOM
-
2026-06-13days on market $309,900 Active 17 DOM
-
2026-06-09days on market $309,900 Active 14 DOM
-
2026-06-08days on market $309,900 Active 13 DOM
-
2026-06-07days on market $309,900 Active 12 DOM
-
2026-06-05days on market $309,900 Active 9 DOM
-
2026-06-03days on market $309,900 Active 8 DOM
-
2026-06-02days on market $309,900 Active 7 DOM
-
2026-06-02pricestatusdays on market $309,900 Active 6 DOM
-
2026-05-10historical
-
2026-05-04$299,900 Active
-
2020-07-17historical
-
2020-06-27price $229,900
-
2020-06-05$239,900 Active
-
2015-12-03historical
-
2015-05-14$135,900 Active
-
2013-12-13historical
-
2013-07-30$135,900
-
2004-10-25soldstatus $97,000
-
2004-10-21soldstatus $97,000
-
2004-06-04historical
-
2004-03-31$109,889
-
1993-11-02soldstatus $54,000
ⓘ Source: listings_history table (triggers on properties + properties_extension) + one-shot
backfill from property_details.listing_events for pre-trigger history.
Tax reassessment forecast OH · Partial reset (capped growth)
- Current annual tax
- $2,638 · $220/mo
- Projected year-2 tax
- $3,581 · $298/mo
- Expected delta
- +$943/yr (+$79/mo · 35.7%)
ⓘ Screening estimate from a state-policy table — verify with the county assessor before closing.
Climate risk First Street
- Flood 1/10 Low FEMA zone X (unshaded) · 0% chance over 30 yrs
- Wildfire 1/10 Low
- Heat 3/10 Moderate 7 d/yr ≥97°F today · 18 d/yr by 30 yrs out
- Wind 2/10 Low 100% chance of damaging wind over 30 yrs
- Air quality 2/10 Low 2 unhealthy d/yr today · 2 by 30 yrs out
Nearby sold comps map
Loading sold comps map…
Walkable amenities ~0.75 mi
Loading nearby amenities…
Taxation est. · year 1
- Rental income
- $27,509
- − Mortgage interest
- −$16,245
- − Property taxes
- −$2,638
- − Insurance
- −$1,450
- − Repairs & maintenance
- −$2,201
- − Management
- −$2,201
- − Depreciation
- −$8,436
- Taxable loss
- −$5,661
- Est. tax savings @ 24.0%
- +$1,359
- After-tax cash flow
- $754/yr
For passive investors: Depreciation is non-cash, so a rental often shows a tax loss while cash-flowing — sheltering income. Rental losses are passive: they offset passive income freely, and up to $25,000/yr can offset ordinary (W-2) income if you actively participate and your MAGI is under $100k (phasing out to $0 by $150k); unused losses carry forward. On sale, claimed depreciation is recaptured at up to 25%, and gains may owe capital-gains tax (a 1031 exchange can defer both). Figures are a year-1 estimate at your 24.0% rate — not tax advice; consult a CPA.
Schools (NCES district)
- District
- Johnstown-Monroe Local
- NCES district ID
- 3904798
- Math proficiency
- 70% ▼ -4.00%
- Reading proficiency
- 79% ▲ 1.00%
- Median HH income
- $69,411
- Composite
- 64.92/100
- National rank
- #510
- State rank
- #85 of 656 in OH
Livability — Johnstown
- Score
- 77/100
- State rank
- #186
- US rank
- #2873
Category grades
Schools grade is shown separately in the Schools card above.
Census & demographics
- Census place
- Johnstown, OH
- County
- Licking County · 109,194 people
- City population
- 13,876
- Metro
- Columbus, OH
- Population (ZIP)
- 13,876
- Household income
- $110,930
- Rent vs Own
- Severe rent burden
- 216.0
Population outlook (Licking County) Hauer SSP2
- Today (2025)
- 178,210 people
- By 2030
- 180,917 · +1.5%
- By 2040
- 183,885 · +3.2%
- By 2050
- 182,985 · +2.7%
- By 2075
- 178,377 · +0.1%
- By 2100
- 161,075 · -9.6%
Race, ethnicity, and origin ACS 2023
- Neighborhood character
- Predominantly White (93%)
- Race & ethnicity
- White 93% Two or more races 5% Hispanic / Latino 1%
- Common ancestry
- Romanian 3% Italian 3% Iranian 2%
- Foreign-born
- 1% · Canada
- Languages at home
- 99% English-only · German/W. Germanic 1%
Political lean MEDSL · Licking
- 2024 margin
- Solid R (+30.0) · D 34.5% · R 64.6%
- 2008→2024 swing
- -14.2pp toward R · 2008: -15.8pp · 2024: -30.0pp
- All cycles
- 2024: R+30.0 2020: R+28.1 2016: R+28.9 2012: R+14.7 2008: R+15.8
Not yet ingested
- Civics
- —
Market trends
- HPI YoY
- ▼ -310.19%
- Current HPI
- 280.5337
- Rent YoY
- —
- Metro
- Columbus, OH
- State GDP YoY
- ▲ 1.98%
- F500 in state
- 48
Industry mix (Fortune 500 HQ in OH)
| Industry | F500 HQs | Revenue |
|---|---|---|
| Insurance | 3 | $145B |
|
||
| Industrial Machinery | 3 | $49B |
|
||
| Financial Services | 3 | $24B |
|
||
| Consumer Goods | 2 | $93B |
|
||
| Aerospace / Defense | 2 | $47B |
|
||
| Utilities | 2 | $33B |
|
||
Price history
+437.0% since first listed17 events — show timeline
- 2026-06-15 Price Changed $290,000 CBRMLS
- 2026-06-01 Relisted — CBRMLS
- 2026-06-01 Price Changed $309,900 CBRMLS
- 2026-05-10 Listing Removed — CBRMLS
- 2026-05-04 Listed $299,900 CBRMLS
- 2020-07-17 Listing Removed — CBRMLS
- 2020-06-27 Price Changed $229,900 CBRMLS
- 2020-06-05 Listed $239,900 CBRMLS
- 2015-12-03 Listing Removed — CBRMLS
- 2015-05-14 Listed $135,900 CBRMLS
- 2013-12-13 Listing Removed — CBRMLS
- 2013-07-30 Listed $135,900 CBRMLS
- 2004-10-25 Sold (Public Records) $97,000 Public Records
- 2004-10-21 Sold (MLS) $97,000 CBRMLS
- 2004-06-04 Listing Removed — CBRMLS
- 2004-03-31 Listed $109,889 CBRMLS
- 1993-11-02 Sold (Public Records) $54,000 Public Records
Property tax history
+2.9%/yrLatest (2025): $2,638 · +0.9% YoY. Source: county tax records.
Cash-flow waterfall
monthlySold comps — $/sqft
last 12 mo · ≤1 miLoading sold comps…