206 Goose Creek Loop Rd · Bogue, NC
Flood risk 10/10 · Severe
- FEMA flood zone
- AE
- Chance of flooding over 30 yrs
- 0.99%
- Est. flood insurance / yr
- $1,737 – $8,500
Fire risk 4/10 · Minor
- Est. fire insurance / yr
- $906 – $1,684
Heat risk 9/10 · Severe
- Hot days now (above 103°F)
- 7 days/yr
- Hot days in 30 yrs
- 20 days/yr
Wind risk 9/10 · Severe
- Chance of severe wind over 30 yrs
- 99.0%
Air-quality risk 2/10 · Minimal
- Unhealthy air days now
- 2 days/yr
- Unhealthy air days in 30 yrs
- 2 days/yr
Risk factors via First Street. Map © Google.
Why this score? — see what drove the C grade
The composite is a weighted blend of 9 inputs, each scored 0–100. Each bar is that input's sub-score; the figure is the points it added to the 100-point composite (weight × sub-score).
- Cash flow +22.1/30.0
- ARV discount +7.5/15.0
- DSCR +7.1/10.0
- 1% rule +5.8/10.0
- Schools +5.1/10.0
- Livability +3.2/5.0
- Rent growth +2.5/5.0
- Condition / age +2.5/5.0
- Appreciation +0.0/10.0
$948,000
🖨 Deal sheet 📄 Offer letter ✓ Due diligence
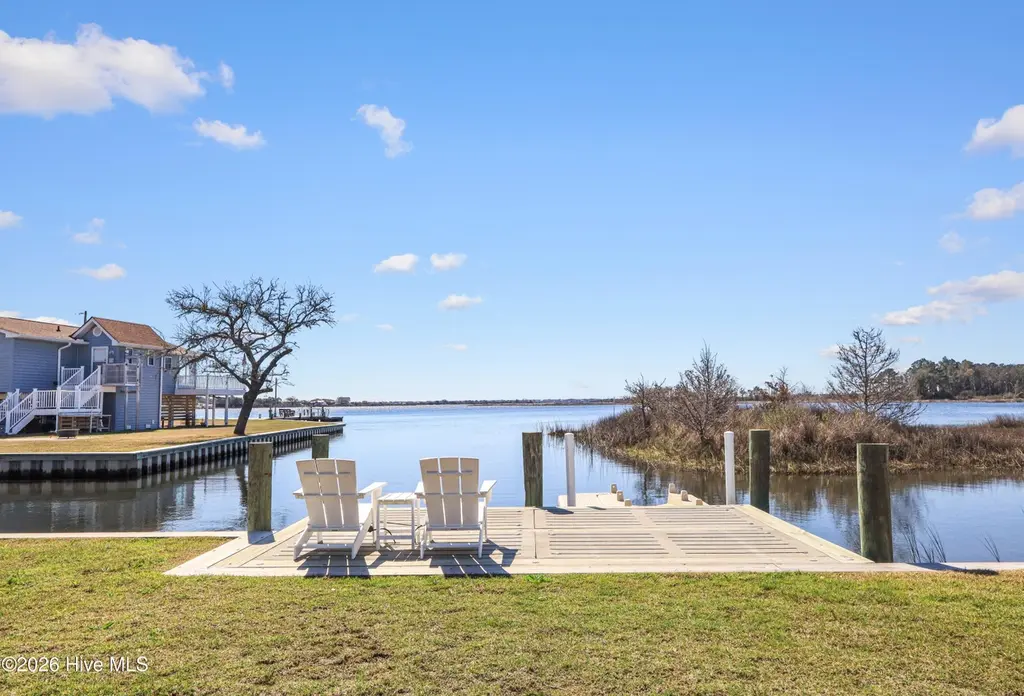
Listing remarks
Exquisite waterfront living awaits along the tranquil shores of Goose Creek, where refined craftsmanship meets breathtaking coastal beauty. This fully reimagined 2-bedroom, 2-bath residence was taken down to the studs and completely renovated in 2023, then thoughtfully elevated above the flood plain--offering both elevated design and lasting peace of mind. Every detail of this home has been carefully curated with premium finishes and exceptional attention to detail. Improvements include a new foundation and subflooring, a new roof, all-new electrical systems (including panels, wiring, outlets, and switches), and completely updated plumbing throughout. Inside, you'll find seamless waterproof
Key facts
- 0.34 acre lot
- Built 1954
- Listed 70 days
Property features AI
Exterior
- Parking: Off-street parking; On-site parking
- Utilities: Water connected; Septic tank
- Home design: Single family residence; One story; Entry level: 1; Residential zoning
- Construction: Fiber cement and frame construction
- Exterior features: Covered patio/porch; Deck; Front porch; Rear porch; Shed(s); Shingle roof; Paved road frontage (city street and state road); Waterfront access; Has view
Interior
- Kitchen: Refrigerator; Range; Dishwasher; Microwave
- Bedrooms: Total rooms: 6
- Bathrooms: 2 full bathrooms; Accessible full bath
- Interior features: Entrance foyer; Ceiling fan(s); Partially furnished; Crawl space basement
- Laundry & utility: Washer; Dryer; Laundry closet
Neighborhood map
What this means for you Summary
Snapshot
- This is a 2-bed/1.0-bath other listed at $948k.
Deal economics
- At list price, monthly cash flow is $1k ($13k/yr) — positive.
- The deal already cash-flows at list — no discount required.
- Meets the 1% rule at list price ($10k rent vs $948k).
- Recommended offer: $891k (6.0% below list) — sets the bar for market timing.
Location & tenants
- Location reads 65/100 on livability (#311 in NC) — a middle-class / working-renter tenant base. Strengths: employment A+, housing A+, cost of living A; Watch: amenities F, commute F, health & safety D-.
- Carteret County Public Schools (rural): math 59% / reading 61% proficiency, ranked #31 of 178 in NC (top 17%) — acceptable for families but not a draw, mixed tenant base, ~2y average lease.
- Zoned schools: White Oak Elementary (math 76% / reading 65%, grade A-, #88 of 1,410 statewide, top 6%, 772 students, 100% FRL); Broad Creek Middle (math 63% / reading 68%, grade A-, #28 of 475 statewide, top 6%, 710 students, 100% FRL); Croatan High (math 82% / reading 78%, grade A, #73 of 535 statewide, top 13%, 974 students, 26% FRL) — zoned schools average 75% FRL vs 39% district-wide (36 pts higher); higher-poverty schools than district average — tighter screening recommended.
- Zoned-school proficiency averages 72% at this address vs 60% district-wide (+12 pts) — the actual schools serving this property are materially stronger than the Carteret County Public Schools average implies; a family-tenant draw the district grade alone would hide.
- Market conditions: 216 active listings in the ZIP; 935 units permitted in Carteret County in 2024 (360 in 5+ unit buildings).
- At $10,231/mo this rent would consume 175% of the median local household income ($70k/yr) (locally 461% of renters already pay >50% of income on rent) — very limited rent-growth headroom before tenants either downsize or default.
Forward outlook
- Local home prices are declining (-3.0%/yr); year-one equity from $7k of loan paydown is wiped out by about $28k of value loss. Plan a longer hold.
- Carteret County population projected at +9% by 2050 — modest demand growth; plan on rents tracking national, not racing it.
Negotiation context
- It's been on market 71 days — a 6% lower offer ($891k) is reasonable based on typical stale-listing flexibility.
- 10 sale attempts since 24y ago; this cycle's ask has dropped $50k (5%) from the opening price — seller is motivated, your offer sets the floor, not the list.
- Current owner paid $280k; list at $948k implies a 239% gain — meaningful room to come down on a strong offer.
Risks & watch-outs
- Watch-outs: flood insurance adds $427/mo; built in 1954 — expect roof / HVAC / electrical / plumbing capex.
- Climate carrying-cost: in FEMA flood zone AE (mandatory federal flood insurance); severe wind risk, 99% chance of damaging wind over 30y; extreme-heat days projected 7→20/yr by 2055 (HVAC capex compounding) — expect insurance premiums to compound above CPI over the hold.
Questions for the listing agent
- It's been on market 71 days. Have you received any prior offers? Is the seller open to a 6% concession, seller financing, or rate buy-down credit?
- Built in 1954 — when were the roof, HVAC, electrical panel, plumbing, and water heater last replaced?
- What's the actual annual flood-insurance premium (NFIP or private), and is the property in a SFHA with mandatory coverage?
- Why hasn't it sold? Are there any deal-killer items the seller is aware of (foundation, flood, title, zoning, code violations)?
- Is there a deadline driving the sale (1031 exchange, divorce, estate, relocation)? That informs how much negotiation room exists.
- Schools are F-rated, which usually means shorter tenancies and higher turnover. Who's the typical renter profile here, and what's been the actual vacancy rate?
- What's the average days-on-market for RENTAL listings here right now (not sales)? A rising rental-DOM trend means longer vacancies and softer asking-rent achievability than the comps imply.
- What's the recent tenant-quality profile in this submarket — average credit score on applications, eviction rate, late-payment / NSF rate, and stable-employment percentage? A property-management company in the area should have these aggregated.
- How much new for-sale + rental construction is in the pipeline within 1–3 miles? Heavy new supply typically softens prices + rents 12–24 months out; constrained supply supports both.
Investment metrics
- 1% rule
- 1.08% ✓
- Cap rate
- 8.23%
- Cash-on-cash
- 6.92%
- DSCR
- 1.31
- GRM
- 7.7
CMA / ARV
No comps found within radius.
Projected returns pro-forma
-3.0% appreciation · 3.0% rent growth · sell at horizon
- IRR
- -8.5%
- Equity multiple
- 0.69×
- Total profit
- $-82,865
- Equity at exit
- $141,350
- IRR
- 1.1%
- Equity multiple
- 1.08×
- Total profit
- $20,103
- Equity at exit
- $81,966
Cash invested: $265,440 (down + closing). Projections, not guarantees.
Landlord ↔ Tenant lean methodology
- Overall (STATE)
- 85 Strongly Landlord-Friendly
- State North Carolina
- 85 Strongly Landlord-Friendly · R+3
- County
- — inherits STATE
- City
- — inherits STATE
ZIP-level market 28570
- Home prices YoY
- -16.2%
- Active inventory
- 216
- Price-to-rent
- 7.7×
Monthly cashflow live
- Estimated rent
- $10,231 medium interval (Pro) →
- Mortgage (P&I)
- −$4,971
- Tax est. 1.5%
- −$1,185 /mo · $14,220/yr
- Insurance
- −$395
- Flood insurance flood zone
- −$427 /mo · $5,118/yr
- HOA
- −$0
- Vacancy / Maint / Mgmt
- −$2,148
- Net cashflow
- $1,104
Break-even live
UW: 25.0% down · 7.5% · 30yr · 1.5% tax · 5.0% vac · 8.0% maint · 8.0% mgmt
Financing live
Cash to close
- Down payment
- $237,000
- Closing costs
- $28,440
- Reserves months
- —
- Total cash needed
- —
Loan-product check · same deal, 3 products live
Conventional
25% down · 7.5% · 30yr
- Down + closing
- —
- Monthly P&I
- —
- Monthly cashflow
- —
- DSCR
- —
- Eligible?
- —
Personal DTI + credit; lowest rate.
DSCR
20% down · 8.5% · 30yr
- Down + closing
- —
- Monthly P&I
- —
- Monthly cashflow
- —
- DSCR
- —
- Eligible?
- —
No personal income docs; deal must DSCR.
Hard money
10% down · 12.0% · 12mo
- Down + closing
- —
- Monthly P&I
- —
- Monthly cashflow
- —
- DSCR
- —
- Eligible?
- —
Short-term bridge; refi at stabilization.
Listing history 35 events
-
2026-06-08days on market $948,000 Active 71 DOM
-
2026-06-07days on market $948,000 Active 70 DOM
-
2026-06-05days on market $948,000 Active 67 DOM
-
2026-06-03days on market $948,000 Active 66 DOM
-
2026-06-02days on market $948,000 Active 65 DOM
-
2026-06-01days on market $948,000 Active 64 DOM
-
2026-05-31days on market $948,000 Active 63 DOM
-
2026-05-30days on market $948,000 Active 62 DOM
-
2026-04-15price $948,000
-
2026-03-29$998,000 Active
-
2025-02-18historical
-
2025-01-23$815,000 Active
-
2023-12-18historical
-
2023-10-27price $720,000
-
2023-10-11price $740,000
-
2023-09-25price $745,000
-
2023-09-06price $755,000
-
2023-08-21price $770,000
-
2023-07-13$780,000 Active
-
2021-11-18soldstatus $280,000
-
2021-11-18soldstatus $280,000
-
2021-08-30$279,900
-
2009-12-30historical
-
2009-03-17$499,000
-
2008-11-30historical
-
2008-02-17historical
-
2008-02-12$499,900
-
2007-05-17$549,000
-
2005-09-01soldstatus $300,000
-
2005-07-15historical
-
2004-12-13$315,000
-
2004-10-22soldstatus $178,500
-
2004-04-29$200,000
-
2003-05-06soldstatus $150,000
-
2002-04-30$159,900
ⓘ Source: listings_history table (triggers on properties + properties_extension) + one-shot
backfill from property_details.listing_events for pre-trigger history.
Climate risk First Street
- Flood 10/10 Extreme FEMA zone AE · 99% chance over 30 yrs
- Wildfire 4/10 Moderate
- Heat 9/10 Extreme 7 d/yr ≥103°F today · 20 d/yr by 30 yrs out
- Wind 9/10 Extreme 99% chance of damaging wind over 30 yrs
- Air quality 2/10 Low 2 unhealthy d/yr today · 2 by 30 yrs out
Nearby sold comps map
Loading sold comps map…
Walkable amenities ~0.75 mi
Loading nearby amenities…
Taxation est. · year 1
- Rental income
- $122,769
- − Mortgage interest
- −$53,103
- − Property taxes
- −$14,220
- − Insurance
- −$9,858
- − Repairs & maintenance
- −$9,822
- − Management
- −$9,822
- − Depreciation
- −$27,578
- Taxable loss
- −$1,634
- Est. tax savings @ 24.0%
- +$392
- After-tax cash flow
- $13,644/yr
For passive investors: Depreciation is non-cash, so a rental often shows a tax loss while cash-flowing — sheltering income. Rental losses are passive: they offset passive income freely, and up to $25,000/yr can offset ordinary (W-2) income if you actively participate and your MAGI is under $100k (phasing out to $0 by $150k); unused losses carry forward. On sale, claimed depreciation is recaptured at up to 25%, and gains may owe capital-gains tax (a 1031 exchange can defer both). Figures are a year-1 estimate at your 24.0% rate — not tax advice; consult a CPA.
Schools (NCES district)
- District
- Carteret County Public Schools
- NCES district ID
- 3700630
- Math proficiency
- 59% ▲ 5.00%
- Reading proficiency
- 61% ▲ 2.00%
- Median HH income
- $48,330
- Composite
- 50.92/100
- National rank
- #1786
- State rank
- #31 of 178 in NC
Livability — Bogue
- Score
- 65/100
- State rank
- #311
- US rank
- #13024
Category grades
Schools grade is shown separately in the Schools card above.
Census & demographics
- County
- Carteret County · 52,389 people
- Metro
- Morehead City, NC
- Population (ZIP)
- 22,197
- Household income
- $70,229
- Rent vs Own
- Severe rent burden
- 461.0
Population outlook (Carteret County) Hauer SSP2
- Today (2025)
- 73,443 people
- By 2030
- 75,344 · +2.6%
- By 2040
- 78,142 · +6.4%
- By 2050
- 80,091 · +9.1%
- By 2075
- 86,120 · +17.3%
- By 2100
- 89,408 · +21.7%
Race, ethnicity, and origin ACS 2023
- Neighborhood character
- Predominantly White (82%)
- Race & ethnicity
- White 82% Hispanic / Latino 7% Two or more races 6% Black 3% Asian 1%
- Hispanic origin (detail)
- Mexican 4%
- Common ancestry
- Slovak 3% Romanian 3% Lithuanian 2%
- Foreign-born
- 5% · Canada, Dominican Republic
- Languages at home
- 92% English-only · Spanish 6% German/W. Germanic 1%
Political lean MEDSL · Carteret
- 2024 margin
- Solid R (+43.1) · D 28.0% · R 71.1%
- 2008→2024 swing
- -8.4pp toward R · 2008: -34.7pp · 2024: -43.1pp
- All cycles
- 2024: R+43.1 2020: R+42.0 2016: R+44.5 2012: R+41.0 2008: R+34.7
Not yet ingested
- Civics
- —
Market trends
- HPI YoY
- ▼ -53.54%
- Current HPI
- 276.6589
- Rent YoY
- —
- Metro
- Morehead City, NC
- State GDP YoY
- ▲ 3.28%
- F500 in state
- 26
Industry mix (Fortune 500 HQ in NC)
| Industry | F500 HQs | Revenue |
|---|---|---|
| Financial Services | 2 | $213B |
|
||
| Retail | 2 | $95B |
|
||
| Industrial Conglomerate | 1 | $38B |
|
||
| Metals / Steel | 1 | $35B |
|
||
| Utilities | 1 | $30B |
|
||
| Industrial Machinery | 1 | $19B |
|
||
Price history
+492.9% since first listed27 events — show timeline
- 2026-04-15 Price Changed $948,000 Hive MLS
- 2026-03-29 Listed $998,000 Hive MLS
- 2025-02-18 Listing Removed — Hive MLS
- 2025-01-23 Listed $815,000 Hive MLS
- 2023-12-18 Listing Removed — Hive MLS
- 2023-10-27 Price Changed $720,000 Hive MLS
- 2023-10-11 Price Changed $740,000 Hive MLS
- 2023-09-25 Price Changed $745,000 Hive MLS
- 2023-09-06 Price Changed $755,000 Hive MLS
- 2023-08-21 Price Changed $770,000 Hive MLS
- 2023-07-13 Listed $780,000 Hive MLS
- 2021-11-18 Sold (Public Records) $280,000 Public Records
- 2021-11-18 Sold (MLS) $280,000 Hive MLS
- 2021-08-30 Listed $279,900 Hive MLS
- 2009-12-30 Listing Removed — Hive MLS
- 2009-03-17 Listed $499,000 Hive MLS
- 2008-11-30 Listing Removed — Hive MLS
- 2008-02-17 Listing Removed — Hive MLS
- 2008-02-12 Listed $499,900 Hive MLS
- 2007-05-17 Listed $549,000 Hive MLS
- 2005-09-01 Sold (Public Records) $300,000 Public Records
- 2005-07-15 Listing Removed — Hive MLS
- 2004-12-13 Listed $315,000 Hive MLS
- 2004-10-22 Sold (MLS) $178,500 Hive MLS
- 2004-04-29 Listed $200,000 Hive MLS
- 2003-05-06 Sold (MLS) $150,000 Hive MLS
- 2002-04-30 Listed $159,900 Hive MLS
Property tax history
+4.8%/yrLatest (2025): $1,781 · +2.9% YoY. Source: county tax records.
Cash-flow waterfall
monthlySold comps — $/sqft
last 12 mo · ≤1 miLoading sold comps…