 5-Plex
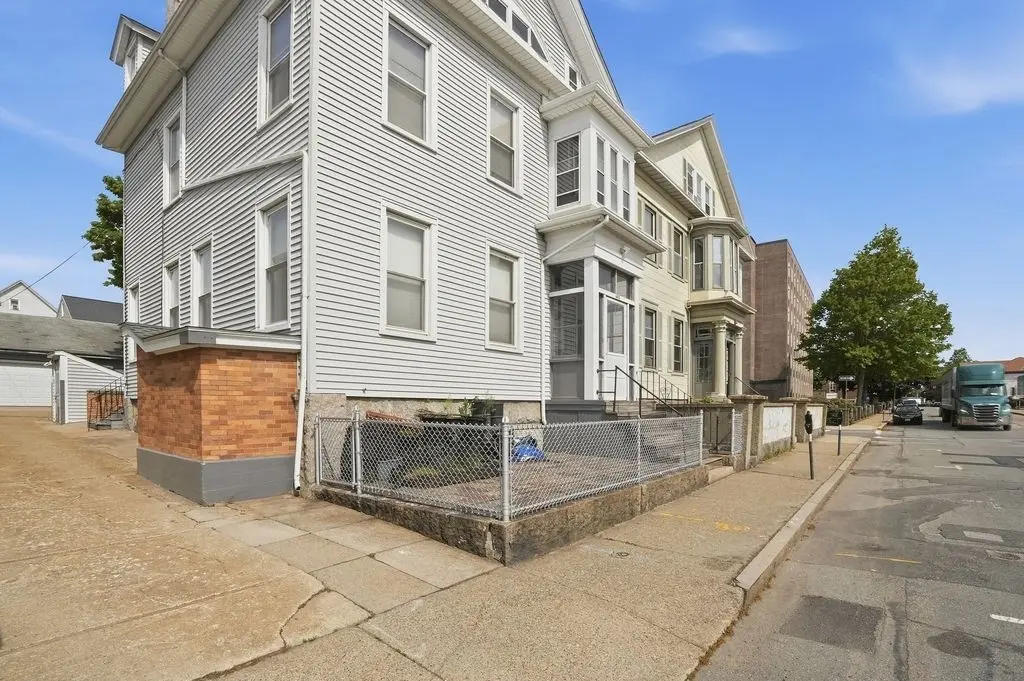
483 County St · New Bedford, MA
Flood risk 1/10 · Minimal
- FEMA flood zone
- X (unshaded)
- Chance of flooding over 30 yrs
- 0.0%
- Est. flood insurance / yr
- $507 – $1,088
Fire risk 1/10 · Minimal
- Est. fire insurance / yr
- $915 – $1,699
Heat risk 6/10 · Moderate
- Hot days now (above 94°F)
- 7 days/yr
- Hot days in 30 yrs
- 16 days/yr
Wind risk 8/10 · Major
- Chance of severe wind over 30 yrs
- 80.0%
Air-quality risk 2/10 · Minimal
- Unhealthy air days now
- 1 days/yr
- Unhealthy air days in 30 yrs
- 2 days/yr
Risk factors via First Street. Map © Google.
Why this score? — see what drove the B- grade
The composite is a weighted blend of 9 inputs, each scored 0–100. Each bar is that input's sub-score; the figure is the points it added to the 100-point composite (weight × sub-score).
- Cash flow +30.0/30.0
- 1% rule +10.0/10.0
- DSCR +10.0/10.0
- Rent growth +5.0/5.0
- Livability +3.4/5.0
- ARV discount +2.9/15.0
- Condition / age +2.5/5.0
- Schools +1.9/10.0
- Appreciation +0.0/10.0
$749,999
🖨 Deal sheet (PDF) 📄 Offer letter ✓ Due diligence
Multi-family units
County records classify this as Multi-Family (5+ Unit). Listing-text estimate: 5 units. confirmed
5+ unit building — per-unit beds/baths from public records are typically unavailable; the breakdown below (if shown) is an estimate from the listing text.
Listing remarks
Exceptional investment opportunity in the heart of New Bedford! This 5-family property offers strong income potential with all tenants currently TAW. Major updates include a new roof in 2023, recently replaced hot water tanks, and a brand-new furnace installed last month. Property also features a rare 4-car garage plus an additional lot behind the garage with access from the side street—ideal for potential additional parking, storage, or outdoor space for tenants. Located just a short walk to downtown New Bedford, offering easy access to the vibrant waterfront, restaurants, cafes, shops, ferry service to Martha’s Vineyard, art galleries, and the thriving historic district. A fan
Key facts
- New furnace
- 4-car garage
- Additional lot
Tags
Property features AI
Finance
- HOA & community: Nearby public transportation, shopping, laundromat, and T-Station
Exterior
- Parking: 4-car garage (covered); 4 covered parking spaces; 5 open parking spaces; Total of 9 parking spaces; Paved driveway and off-street parking
- Utilities: Public water; Public sewer; Electric with circuit breakers; Gas available for range
- Home design: 5+ unit multi-family building; 3 levels / 3 stories; Gray exterior
- Construction: Approximately built (year from public records); Granite foundation; Building area around 3,557 total sq. ft.
- Exterior features: Public road frontage; Shingle roof
Interior
- Flooring: Vinyl flooring; Hardwood flooring
- Bathrooms: 5 full bathrooms
- Interior features: 24 total rooms; Full, partially finished walk-out basement; One fireplace
Neighborhood map
What this means for you Summary
Snapshot
- This is a 5 × 7-bed/5.0-bath units multifamily listed at $750k.
Deal economics
- At list price, monthly cash flow is $6k ($67k/yr) — positive. Per door: $1k/mo.
- The deal already cash-flows at list — no discount required.
- Meets the 1% rule at list price ($13k rent vs $750k).
- Recommended offer: $739k (1.5% below list) — sets the bar for market timing.
- Cap rate 15.3% vs local median 3.7% in New Bedford — top-decile yield for the area; either an underpriced asset or a hidden risk that comps aren't pricing in. Stress-test before assuming the spread holds.
Location & tenants
- Location reads 67/100 on livability (#155 in MA) — a middle-class / working-renter tenant base. Strengths: health & safety A+, housing B+; Watch: cost of living C-, employment D, amenities F.
- New Bedford (suburban): math 17% / reading 28% proficiency, ranked #287 of 302 in MA (top 95%) — low school quality limits family demand, transient renter base, plan for 1-2y turnover; 65% free/reduced lunch — lower-income household profile, screen leases tightly.
- Zoned schools: Sgt Wm H Carney Academy (math 18% / reading 34%, grade F, #711 of 938 statewide, top 76%, 611 students, 0% FRL); Keith Middle School (math 16% / reading 25%, grade F, #252 of 305 statewide, top 83%, 870 students, 0% FRL); New Bedford High (math 13% / reading 25%, grade F, #313 of 343 statewide, top 92%, 2,898 students, 0% FRL) — zoned schools average 0% FRL vs 65% district-wide (65 pts lower); this property's tenant base skews higher-income than the district average.
- Market conditions: Rents rising fast (+10.8%/yr); 69 active listings in the ZIP; 760 units permitted in Bristol County in 2024 (142 in 5+ unit buildings).
- At $12,999/mo this rent would consume 282% of the median local household income ($55k/yr) (locally 2883% of renters already pay >50% of income on rent) — very limited rent-growth headroom before tenants either downsize or default.
Forward outlook
- Local home prices are declining (-3.0%/yr); year-one equity from $5k of loan paydown is wiped out by about $22k of value loss. Plan a longer hold.
- Bristol County population projected to shrink 3% by 2050 — rents likely to lag national; underwrite the cash flow, not the appreciation.
- At projected returns (-3.0% appreciation + 8.0% rent growth), your $210k cash investment doubles in ~4 years — after that, you're playing with house money.
Negotiation context
- It's been on market 26 days — a 2% lower offer ($739k) is reasonable based on typical stale-listing flexibility.
- Current owner paid $92k; list at $750k implies a 715% gain — meaningful room to come down on a strong offer.
Risks & watch-outs
- Watch-outs: built in 1910 — expect roof / HVAC / electrical / plumbing capex.
- Climate carrying-cost: severe wind risk, 80% chance of damaging wind over 30y; extreme-heat days projected 7→16/yr by 2055 (HVAC capex compounding) — expect insurance premiums to compound above CPI over the hold.
Questions for the listing agent
- Can we see the unit-by-unit rent roll, current vacancy, and any below-market leases? What's the average tenancy length?
- What capital expenditures (roof, boiler, parking lot, exteriors) have been made in the last 5 years, and what's planned in the next 2?
- Built in 1910 — when were the roof, HVAC, electrical panel, plumbing, and water heater last replaced?
- Is there a deadline driving the sale (1031 exchange, divorce, estate, relocation)? That informs how much negotiation room exists.
- Schools are D-rated, which usually means shorter tenancies and higher turnover. Who's the typical renter profile here, and what's been the actual vacancy rate?
- What's the average days-on-market for RENTAL listings here right now (not sales)? A rising rental-DOM trend means longer vacancies and softer asking-rent achievability than the comps imply.
- What's the recent tenant-quality profile in this submarket — average credit score on applications, eviction rate, late-payment / NSF rate, and stable-employment percentage? A property-management company in the area should have these aggregated.
- How much new apartment / multifamily construction is in the pipeline within 1–3 miles? Heavy new supply (>2% of stock underway) typically softens rents 12–24 months out; light construction supports rent growth.
Investment metrics
- 1% rule
- 1.73% ✓
- Cap rate
- 15.26%
- Cash-on-cash
- 32.03%
- DSCR
- 2.43
- GRM
- 4.8
CMA / ARV
- ARV (on-the-fly)
- $680,064
- Comps found
- 12
Show comp detail 12 sales within ~0.75 mi
| Address | Dist | Beds/Ba | Sqft | Sold | Price | $/sf | Match |
|---|---|---|---|---|---|---|---|
| 65 Walden St | 0.26mi | 7/3.0 | 3,555 (-4%) | 13mo | $325,000 | $91 | 61 |
| 366 Union St | 0.24mi | 6/4.0 (-1) | 3,520 (-5%) | 12mo | $650,000 | $185 | 60 |
| 1387-1389 Purchase St | 0.56mi | 6/3.0 (-1) | 3,678 (-0%) | 1mo | $650,000 | $177 | 58 |
| 36 7th St | 0.34mi | 8/5.0 (+1) | 4,007 (+8%) | 9mo | $630,000 | $157 | 56 |
| 111 Hillman St | 0.23mi | 8/3.0 (+1) | 3,253 (-12%) | 1mo | $635,000 | $195 | 53 |
| 179 Tremont St | 0.54mi | 8/3.0 (+1) | 3,807 (+3%) | 5mo | $700,000 | $184 | 51 |
| 199 Maxfield St | 0.29mi | 6/3.0 (-1) | 3,386 (-8%) | 12mo | $410,000 | $121 | 48 |
| 359 County St | 0.60mi | 7/3.5 | 3,528 (-4%) | 11mo | $565,000 | $160 | 47 |
| 21 James St | 0.69mi | 6/3.0 (-1) | 3,408 (-8%) | 1mo | $640,000 | $188 | 39 |
| 39 Smith St | 0.40mi | 8/3.0 (+1) | 3,202 (-13%) | 9mo | $610,000 | $191 | 36 |
| 1186-1188 Pleasant St | 0.67mi | 8/3.0 (+1) | 3,460 (-6%) | 9mo | $565,000 | $163 | 36 |
| 89-91 Armour St | 0.73mi | 8/3.0 (+1) | 3,194 (-14%) | 12mo | $600,000 | $188 | 18 |
Match score weights: distance 35% · size 25% · config 20% · recency 20%. Top-matched comps best support the ARV.
Projected returns pro-forma
-3.0% appreciation · 8.0% rent growth · sell at horizon
- IRR
- 32.3%
- Equity multiple
- 2.45×
- Total profit
- $304,046
- Equity at exit
- $111,827
- IRR
- 41.9%
- Equity multiple
- 5.94×
- Total profit
- $1,036,626
- Equity at exit
- $64,846
Cash invested: $210,000 (down + closing). Projections, not guarantees.
Landlord ↔ Tenant lean methodology
- Overall (STATE)
- 20 Strongly Tenant-Friendly
- State Massachusetts
- 20 Strongly Tenant-Friendly · D+15
- County
- — inherits STATE
- City
- — inherits STATE
ZIP-level market 02740
- Rents YoY
- 10.8%
- Active inventory
- 69
- Price-to-rent
- 24.0×
Monthly cashflow live
- Estimated rent
- $12,999 medium interval (Pro) →
- Mortgage (P&I)
- −$3,933
- Tax from tax record
- −$418 /mo · $5,020/yr
- Insurance
- −$312
- HOA
- −$0
- Vacancy / Maint / Mgmt
- −$2,730
- Net cashflow
- $5,605
Break-even live
Sensitivity live
| Price | -10% $6,030 | -5% $5,818 | +0% $5,605 | +5% $5,393 | +10% $5,181 |
|---|---|---|---|---|---|
| Rent | -10% $4,578 | -5% $5,092 | +0% $5,605 | +5% $6,119 | +10% $6,632 |
| Rate | -1.0pp $5,983 | -0.5pp $5,796 | base $5,605 | +0.5pp $5,411 | +1.0pp $5,213 |
5-unit breakdown (identical units grouped — click to expand)
| Units | Beds | Baths | Est. rent |
|---|---|---|---|
| 5× units | 7 | 5 | $13,000 |
| #1 | 7 | 5 | $2,600 |
| #2 | 7 | 5 | $2,600 |
| #3 | 7 | 5 | $2,600 |
| #4 | 7 | 5 | $2,600 |
| #5 | 7 | 5 | $2,600 |
| Total (5 units) | $12,999 | ||
UW: 25.0% down · 7.5% · 30yr · 1.5% tax · 5.0% vac · 8.0% maint · 8.0% mgmt
Financing live
Cash to close
- Down payment
- $187,500
- Closing costs
- $22,500
- Reserves months
- —
- Total cash needed
- —
Loan-product check · same deal, 3 products live
Conventional
25% down · 7.5% · 30yr
- Down + closing
- —
- Monthly P&I
- —
- Monthly cashflow
- —
- DSCR
- —
- Eligible?
- —
Personal DTI + credit; lowest rate.
DSCR
20% down · 8.5% · 30yr
- Down + closing
- —
- Monthly P&I
- —
- Monthly cashflow
- —
- DSCR
- —
- Eligible?
- —
No personal income docs; deal must DSCR.
Hard money
10% down · 12.0% · 12mo
- Down + closing
- —
- Monthly P&I
- —
- Monthly cashflow
- —
- DSCR
- —
- Eligible?
- —
Short-term bridge; refi at stabilization.
Listing history 16 events
-
2026-06-21days on market $749,999 Active 26 DOM
-
2026-06-18days on market $749,999 Active 23 DOM
-
2026-06-17days on market $749,999 Active 22 DOM
-
2026-06-16days on market $749,999 Active 21 DOM
-
2026-06-15days on market $749,999 Active 20 DOM
-
2026-06-13days on market $749,999 Active 18 DOM
-
2026-06-09days on market $749,999 Active 14 DOM
-
2026-06-08days on market $749,999 Active 13 DOM
-
2026-06-07days on market $749,999 Active 12 DOM
-
2026-06-05days on market $749,999 Active 9 DOM
-
2026-06-03days on market $749,999 Active 8 DOM
-
2026-06-02days on market $749,999 Active 7 DOM
-
2026-06-01days on market $749,999 Active 6 DOM
-
2026-05-31days on market $749,999 Active 5 DOM
-
2026-05-26$749,999 New
-
1997-01-21soldstatus $92,000
ⓘ Source: listings_history table (triggers on properties + properties_extension) + one-shot
backfill from property_details.listing_events for pre-trigger history.
Tax reassessment forecast MA · Partial reset (capped growth)
- Current annual tax
- $5,020 · $418/mo
- Projected year-2 tax
- $7,122 · $594/mo
- Expected delta
- +$2,102/yr (+$175/mo · 41.9%)
ⓘ Screening estimate from a state-policy table — verify with the county assessor before closing.
Climate risk First Street
- Flood 1/10 Low FEMA zone X (unshaded) · 0% chance over 30 yrs
- Wildfire 1/10 Low
- Heat 6/10 Major 7 d/yr ≥94°F today · 16 d/yr by 30 yrs out
- Wind 8/10 Severe 80% chance of damaging wind over 30 yrs
- Air quality 2/10 Low 1 unhealthy d/yr today · 2 by 30 yrs out
Nearby sold comps map
Loading sold comps map…
Walkable amenities ~0.75 mi
Loading nearby amenities…
Taxation est. · year 1
- Rental income
- $155,988
- − Mortgage interest
- −$42,012
- − Property taxes
- −$5,020
- − Insurance
- −$3,750
- − Repairs & maintenance
- −$12,479
- − Management
- −$12,479
- − Depreciation
- −$21,818
- Taxable income
- $58,430
- Est. tax owed @ 24.0%
- −$14,023
- After-tax cash flow
- $53,240/yr
For passive investors: Depreciation is non-cash, so a rental often shows a tax loss while cash-flowing — sheltering income. Rental losses are passive: they offset passive income freely, and up to $25,000/yr can offset ordinary (W-2) income if you actively participate and your MAGI is under $100k (phasing out to $0 by $150k); unused losses carry forward. On sale, claimed depreciation is recaptured at up to 25%, and gains may owe capital-gains tax (a 1031 exchange can defer both). Figures are a year-1 estimate at your 24.0% rate — not tax advice; consult a CPA.
Schools (NCES district)
- District
- New Bedford
- NCES district ID
- 2508430
- Math proficiency
- 17% ▼ -14.00%
- Reading proficiency
- 28% ▼ -6.00%
- Median HH income
- $37,901
- Composite
- 18.79/100
- National rank
- #8869
- State rank
- #287 of 302 in MA
Livability — New Bedford
- Score
- 67/100
- State rank
- #155
- US rank
- #10150
Category grades
Schools grade is shown separately in the Schools card above.
Census & demographics
- Census place
- New Bedford, MA
- County
- Bristol County · 342,083 people
- City population
- 76,528
- Metro
- Providence-Warwick, RI-MA
- Population (ZIP)
- 46,281
- Household income
- $55,237
- Rent vs Own
- Severe rent burden
- 2883.0
Population outlook (Bristol County) Hauer SSP2
- Today (2025)
- 570,212 people
- By 2030
- 571,181 · +0.2%
- By 2040
- 565,389 · -0.8%
- By 2050
- 552,141 · -3.2%
- By 2075
- 520,923 · -8.6%
- By 2100
- 474,363 · -16.8%
Race, ethnicity, and origin ACS 2023
- Neighborhood character
- Diverse neighborhood (Simpson 0.67)
- Race & ethnicity
- White 52% Hispanic / Latino 23% Two or more races 17% Black 8% Asian 2% Native American 1%
- Hispanic origin (detail)
- Puerto Rican 14% Dominican 2%
- Common ancestry
- Russian 27% Lithuanian 5% Romanian 2%
- Foreign-born
- 19% · Canada, China
- Languages at home
- 65% English-only · Other Indo-European 15% Spanish 15% French/Haitian/Cajun 3%
Political lean MEDSL · Bristol
- 2024 margin
- Toss-up / Even · D 49.8% · R 48.5% · Other 1.8%
- 2008→2024 swing
- -21.9pp toward R · 2008: 23.2pp · 2024: 1.3pp
- All cycles
- 2024: D+1.3 2020: D+12.0 2016: D+9.3 2012: D+20.5 2008: D+23.2
Not yet ingested
- Civics
- —
Market trends
- HPI YoY
- ▼ -270.36%
- Current HPI
- 388.4115
- Rent YoY
- ▲ 10.79%
- Metro
- Providence-Warwick, RI-MA
- State GDP YoY
- ▲ 2.28%
- F500 in state
- 38
Industry mix (Fortune 500 HQ in MA)
| Industry | F500 HQs | Revenue |
|---|---|---|
| Technology | 3 | $17B |
|
||
| Insurance | 2 | $84B |
|
||
| Retail | 2 | $76B |
|
||
| Life Sciences | 1 | $43B |
|
||
| Energy Technology | 1 | $31B |
|
||
| Aerospace / Defense | 1 | $18B |
|
||
Price history
+715.2% since first listed2 events — show timeline
- 2026-05-26 Listed $749,999 MLS PIN
- 1997-01-21 Sold (Public Records) $92,000 Public Records
Property tax history
+4.1%/yrLatest (2023): $5,020 · +12.8% YoY. Source: county tax records.
Cash-flow waterfall
monthlySold comps — $/sqft
last 12 mo · ≤1 miLoading sold comps…