 Triplex
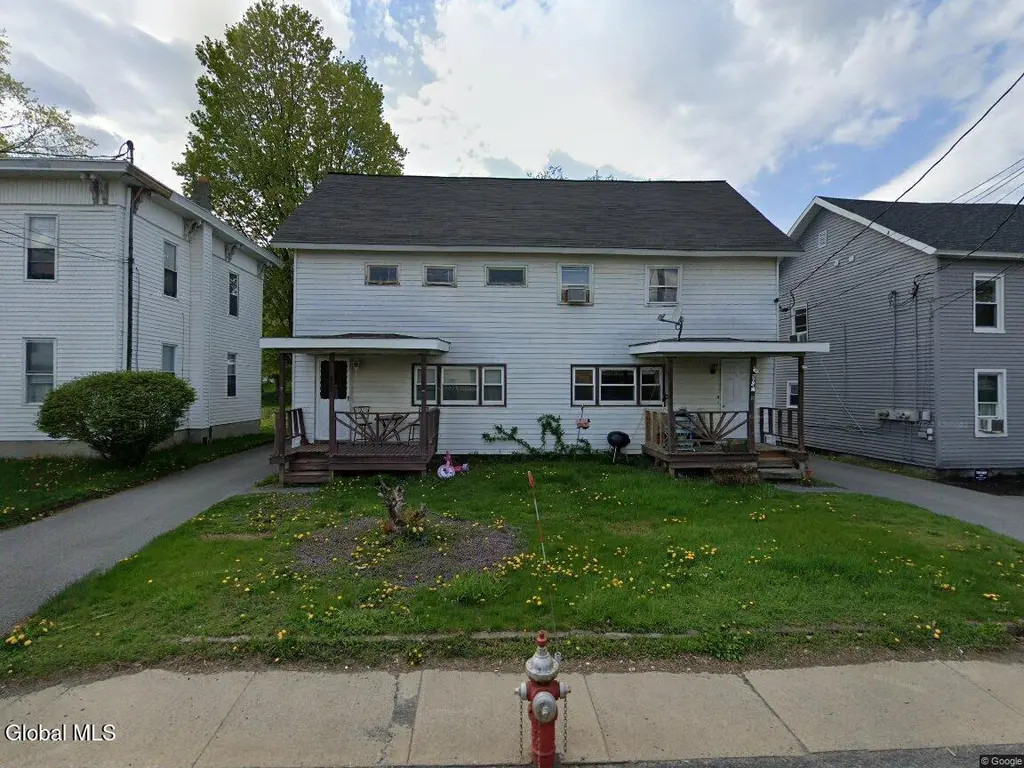
609 Hudson Ave · Stillwater, NY
Flood risk 1/10 · Minimal
- FEMA flood zone
- X
- Chance of flooding over 30 yrs
- 0.0%
- Est. flood insurance / yr
- $473 – $860
Fire risk 1/10 · Minimal
- Est. fire insurance / yr
- $691 – $1,283
Heat risk 3/10 · Minor
- Hot days now (above 97°F)
- 7 days/yr
- Hot days in 30 yrs
- 17 days/yr
Wind risk 3/10 · Minor
- Chance of severe wind over 30 yrs
- 6.0%
Air-quality risk 2/10 · Minimal
- Unhealthy air days now
- 0 days/yr
- Unhealthy air days in 30 yrs
- 1 days/yr
Risk factors via First Street. Map © Google.
Why this score? — see what drove the A grade
The composite is a weighted blend of 9 inputs, each scored 0–100. Each bar is that input's sub-score; the figure is the points it added to the 100-point composite (weight × sub-score).
- Cash flow +30.0/30.0
- ARV discount +14.9/15.0
- 1% rule +10.0/10.0
- DSCR +10.0/10.0
- Appreciation +10.0/10.0
- Schools +5.2/10.0
- Livability +3.5/5.0
- Rent growth +2.5/5.0
- Condition / age +2.5/5.0
$275,000
🖨 Deal sheet (PDF) 📄 Offer letter ✓ Due diligence
Multi-family units
County records classify this as Multi-Family (2-4 Unit). Listing-text estimate: 3 units. confirmed
Listing remarks
Multiple Offers Best and Final Due at 5pm! Opportunity in the heart of Stillwater! LOW TAXES! This triplex at 609 Hudson Ave features three well-proportioned units, each offering 2 bedrooms and 1 full bathroom, providing flexibility for both owner-occupants and investors alike. Two units are occupied at 900.00 a piece and one unit is vacant currently under remodel with estimated future rent of 1100.00. Conveniently located near local shops, dining, and everyday amenities, with easy access to surrounding areas including Troy and Saratoga Springs. Don't miss this opportunity to own a multi-family property with built-in income potential in a desirable location!
Key facts
- Triplex
- Conveniently located
- 0.23 acre lot
Tags
Property features AI
Finance
- Financial info: Annual taxes listed (tax amount provided)
Exterior
- Parking: Off-street parking for 6 vehicles
- Utilities: 100 Amp electric service; Public water; Public sewer
- Home design: Triplex; Living area approximately 2,493; Stone foundation
- Construction: Aluminum and vinyl siding; Asphalt roof
- Exterior features: Covered porch/patio; Road frontage (55 ft)
Interior
- Bedrooms: Three units, each with 2 bedrooms (Unit 1: 2 bedrooms, Unit 2: 2 bedrooms, Unit 3: 2 bedrooms)
- Flooring: Carpet; Laminate
- Bathrooms: Three full bathrooms total (two full baths on the 1st level, one full bath on the 2nd level); Each unit includes one full bathroom
- Heating & cooling: Baseboard electric heating; Window air conditioning units
- Interior features: Carpet and laminate flooring; Crawl space basement
- Laundry & utility: Tenant pays heat and electricity; owner pays water, sewer, and trash collection
Neighborhood map
What this means for you Summary
Snapshot
- This is a 3 × 2-bed/1.0-bath units multifamily listed at $275k.
Deal economics
- At list price, monthly cash flow is $2k ($20k/yr) — positive. Per door: $568/mo.
- The deal already cash-flows at list — no discount required.
- Meets the 1% rule at list price ($4k rent vs $275k).
- Recommended offer: $271k (1.5% below list) — sets the bar for market timing.
Location & tenants
- Location reads 69/100 on livability (#509 in NY) — a middle-class / working-renter tenant base. Strengths: crime A+, employment A+, housing A+; Watch: amenities F, commute F, health & safety D-.
- Stillwater Central School District (suburban): math 56% / reading 60% proficiency, ranked #238 of 590 in NY (top 40%) — acceptable for families but not a draw, mixed tenant base, ~2y average lease.
- Zoned schools: Stillwater Elementary School (math 57% / reading 62%, grade B-, #745 of 2,108 statewide, top 39%, 499 students, 32% FRL); Stillwater Middle School High School (math 55% / reading 62%, grade C, #877 of 1,100 statewide, top 80%, 525 students, 30% FRL).
- Market conditions: 48 active listings in the ZIP; 1,132 units permitted in Saratoga County in 2024 (378 in 5+ unit buildings).
Forward outlook
- In year one you build about $29k of equity ($2k loan paydown + $28k appreciation (10.0% local appreciation)).
- Saratoga County population projected at +4% by 2050 — modest demand growth; plan on rents tracking national, not racing it.
- At projected returns (10.0% appreciation + 3.0% rent growth), your $77k cash investment doubles in ~2 years — after that, you're playing with house money.
- By year 2, paydown + projected appreciation supports a ~$47k cash-out refi (75% LTV) — recoverable capital for the next deal without selling this one.
Negotiation context
- It's been on market 15 days — a 2% lower offer ($271k) is reasonable based on typical stale-listing flexibility.
- 3 sale attempts with the ask held roughly flat each time — persistent listings suggest the price (not the market) is what's stuck; bring a comps-based counter.
- Current owner paid $178k; list at $275k implies a 54% gain — meaningful room to come down on a strong offer.
Risks & watch-outs
- Watch-outs: built in 1925 — expect roof / HVAC / electrical / plumbing capex.
Questions for the listing agent
- Can we see the unit-by-unit rent roll, current vacancy, and any below-market leases? What's the average tenancy length?
- What capital expenditures (roof, boiler, parking lot, exteriors) have been made in the last 5 years, and what's planned in the next 2?
- Built in 1925 — when were the roof, HVAC, electrical panel, plumbing, and water heater last replaced?
- Is there a deadline driving the sale (1031 exchange, divorce, estate, relocation)? That informs how much negotiation room exists.
- Schools are B-rated — typically a magnet for longer-tenancy family renters. What's the average tenant stay here, and is there a school-zone premium baked into asking?
- What's the average days-on-market for RENTAL listings here right now (not sales)? A rising rental-DOM trend means longer vacancies and softer asking-rent achievability than the comps imply.
- What's the recent tenant-quality profile in this submarket — average credit score on applications, eviction rate, late-payment / NSF rate, and stable-employment percentage? A property-management company in the area should have these aggregated.
- How much new apartment / multifamily construction is in the pipeline within 1–3 miles? Heavy new supply (>2% of stock underway) typically softens rents 12–24 months out; light construction supports rent growth.
Investment metrics
- 1% rule
- 1.64% ✓
- Cap rate
- 13.73%
- Cash-on-cash
- 26.55%
- DSCR
- 2.18
- GRM
- 5.1
CMA / ARV
- ARV (median comp)
- $329,446
- List price
- $275,000
- Delta
- -16.53%
- Verdict
- UNDERPRICED
- Comps
- 4 within 1.0 mi
Show comp detail 2 sales within ~0.75 mi
| Address | Dist | Beds/Ba | Sqft | Sold | Price | $/sf | Match |
|---|---|---|---|---|---|---|---|
| 600 Hudson Ave | 0.04mi | 5/2.0 (-1) | 2,818 (+13%) | 2mo | $290,000 | $103 | 66 |
| 44 Major Dickinson Ave | 0.63mi | 6/2.5 | 2,195 (-12%) | 23mo | $150,000 | $68 | 29 |
Match score weights: distance 35% · size 25% · config 20% · recency 20%. Top-matched comps best support the ARV.
Projected returns pro-forma
10.0% appreciation · 3.0% rent growth · sell at horizon
- IRR
- 44.3%
- Equity multiple
- 4.35×
- Total profit
- $258,325
- Equity at exit
- $247,742
- IRR
- 38.4%
- Equity multiple
- 9.77×
- Total profit
- $675,463
- Equity at exit
- $534,265
Cash invested: $77,000 (down + closing). Projections, not guarantees.
Landlord ↔ Tenant lean methodology
- Overall (STATE)
- 15 Strongly Tenant-Friendly
- State New York
- 15 Strongly Tenant-Friendly · D+10
- County
- — inherits STATE
- City
- — inherits STATE
ZIP-level market 12170
- Home prices YoY
- 7.4%
- Active inventory
- 48
- Price-to-rent
- 15.3×
Monthly cashflow live
- Estimated rent
- $4,500 medium interval (Pro) →
- Mortgage (P&I)
- −$1,442
- Tax from tax record
- −$295 /mo · $3,534/yr
- Insurance
- −$115
- HOA
- −$0
- Vacancy / Maint / Mgmt
- −$945
- Net cashflow
- $1,704
Break-even live
Sensitivity live
| Price | -10% $1,859 | -5% $1,782 | +0% $1,704 | +5% $1,626 | +10% $1,548 |
|---|---|---|---|---|---|
| Rent | -10% $1,348 | -5% $1,526 | +0% $1,704 | +5% $1,882 | +10% $2,059 |
| Rate | -1.0pp $1,842 | -0.5pp $1,774 | base $1,704 | +0.5pp $1,633 | +1.0pp $1,560 |
3-unit breakdown (identical units grouped — click to expand)
| Units | Beds | Baths | Est. rent |
|---|---|---|---|
| 3× units | 2 | 1 | $4,500 |
| #1 | 2 | 1 | $1,500 |
| #2 | 2 | 1 | $1,500 |
| #3 | 2 | 1 | $1,500 |
| Total (3 units) | $4,500 | ||
UW: 25.0% down · 7.5% · 30yr · 1.5% tax · 5.0% vac · 8.0% maint · 8.0% mgmt
Financing live
Cash to close
- Down payment
- $68,750
- Closing costs
- $8,250
- Reserves months
- —
- Total cash needed
- —
Loan-product check · same deal, 3 products live
Conventional
25% down · 7.5% · 30yr
- Down + closing
- —
- Monthly P&I
- —
- Monthly cashflow
- —
- DSCR
- —
- Eligible?
- —
Personal DTI + credit; lowest rate.
DSCR
20% down · 8.5% · 30yr
- Down + closing
- —
- Monthly P&I
- —
- Monthly cashflow
- —
- DSCR
- —
- Eligible?
- —
No personal income docs; deal must DSCR.
Hard money
10% down · 12.0% · 12mo
- Down + closing
- —
- Monthly P&I
- —
- Monthly cashflow
- —
- DSCR
- —
- Eligible?
- —
Short-term bridge; refi at stabilization.
Listing history 9 events
-
2026-05-12status Pending 672-char remark
-
2026-04-24$275,000 Active 672-char remark
-
2026-01-27status Pending
-
2026-01-27historical
-
2026-01-09$275,000 Active
-
2025-12-09historical
-
2025-09-02$299,898 Active
-
2010-06-04soldstatus $178,000
-
2006-01-25soldstatus $150,000
ⓘ Source: listings_history table (triggers on properties + properties_extension) + one-shot
backfill from property_details.listing_events for pre-trigger history.
Tax reassessment forecast NY · Partial reset (capped growth)
- Current annual tax
- $3,534 · $295/mo
- Projected year-2 tax
- $4,091 · $341/mo
- Expected delta
- +$557/yr (+$46/mo · 15.8%)
ⓘ Screening estimate from a state-policy table — verify with the county assessor before closing.
Climate risk First Street
- Flood 1/10 Low FEMA zone X · 0% chance over 30 yrs
- Wildfire 1/10 Low
- Heat 3/10 Moderate 7 d/yr ≥97°F today · 17 d/yr by 30 yrs out
- Wind 3/10 Moderate 6% chance of damaging wind over 30 yrs
- Air quality 2/10 Low 0 unhealthy d/yr today · 1 by 30 yrs out
Nearby sold comps map
Loading sold comps map…
Walkable amenities ~0.75 mi
Loading nearby amenities…
Taxation est. · year 1
- Rental income
- $54,000
- − Mortgage interest
- −$15,404
- − Property taxes
- −$3,534
- − Insurance
- −$1,375
- − Repairs & maintenance
- −$4,320
- − Management
- −$4,320
- − Depreciation
- −$8,000
- Taxable income
- $17,047
- Est. tax owed @ 24.0%
- −$4,091
- After-tax cash flow
- $16,354/yr
For passive investors: Depreciation is non-cash, so a rental often shows a tax loss while cash-flowing — sheltering income. Rental losses are passive: they offset passive income freely, and up to $25,000/yr can offset ordinary (W-2) income if you actively participate and your MAGI is under $100k (phasing out to $0 by $150k); unused losses carry forward. On sale, claimed depreciation is recaptured at up to 25%, and gains may owe capital-gains tax (a 1031 exchange can defer both). Figures are a year-1 estimate at your 24.0% rate — not tax advice; consult a CPA.
Schools (NCES district)
- District
- Stillwater Central School District
- NCES district ID
- 3628110
- Math proficiency
- 56% ▼ -13.00%
- Reading proficiency
- 60% ▲ 2.00%
- Median HH income
- $72,025
- Composite
- 51.51/100
- National rank
- #1721
- State rank
- #238 of 590 in NY
Livability — Stillwater
- Score
- 69/100
- State rank
- #509
- US rank
- #8993
Category grades
Schools grade is shown separately in the Schools card above.
Census & demographics
- Census place
- Stillwater, NY
- Population (ZIP)
- 5,225
Population outlook (Saratoga County) Hauer SSP2
- Today (2025)
- 238,889 people
- By 2030
- 243,681 · +2.0%
- By 2040
- 249,118 · +4.3%
- By 2050
- 248,638 · +4.1%
- By 2075
- 241,675 · +1.2%
- By 2100
- 213,150 · -10.8%
Race, ethnicity, and origin ACS 2023
- Neighborhood character
- Predominantly White (88%)
- Race & ethnicity
- White 88% Hispanic / Latino 9% Two or more races 6% Black 1%
- Hispanic origin (detail)
- Mexican 3% Puerto Rican 3% Dominican 2%
- Common ancestry
- Romanian 7% Lithuanian 6% Iranian 2%
- Foreign-born
- 3% · Canada
- Languages at home
- 97% English-only · Spanish 2%
Political lean MEDSL · Saratoga
- 2024 margin
- Toss-up / Even · D 50.9% · R 49.1%
- 2008→2024 swing
- -1.6pp toward R · 2008: 3.4pp · 2024: 1.8pp
- All cycles
- 2024: D+1.8 2020: D+5.4 2016: R+4.4 2012: D+2.1 2008: D+3.4
Not yet ingested
- Civics
- —
Market trends
- HPI YoY
- ▲ 25.13%
- Current HPI
- 363.0428
- Rent YoY
- —
- Metro
- —
- State GDP YoY
- ▲ 2.60%
- F500 in state
- 92
Industry mix (Fortune 500 HQ in NY)
| Industry | F500 HQs | Revenue |
|---|---|---|
| Financial Services | 10 | $950B |
|
||
| Consumer Goods | 9 | $162B |
|
||
| Insurance | 4 | $225B |
|
||
| Telecommunications | 2 | $144B |
|
||
| Pharmaceuticals | 2 | $112B |
|
||
| Media / Entertainment | 2 | $69B |
|
||
Price history
+83.3% since first listed9 events — show timeline
- 2026-05-12 Pending — Global MLS
- 2026-04-24 Listed $275,000 Global MLS
- 2026-01-27 Pending — Global MLS
- 2026-01-27 Listing Removed — Global MLS
- 2026-01-09 Listed $275,000 Global MLS
- 2025-12-09 Listing Removed — Global MLS
- 2025-09-02 Listed $299,898 Global MLS
- 2010-06-04 Sold (Public Records) $178,000 Public Records
- 2006-01-25 Sold (Public Records) $150,000 Public Records
Property tax history
+3.7%/yrLatest (2025): $3,534 · +1.5% YoY. Source: county tax records.
Cash-flow waterfall
monthlySold comps — $/sqft
last 12 mo · ≤1 miLoading sold comps…