 🏗️ New Construction
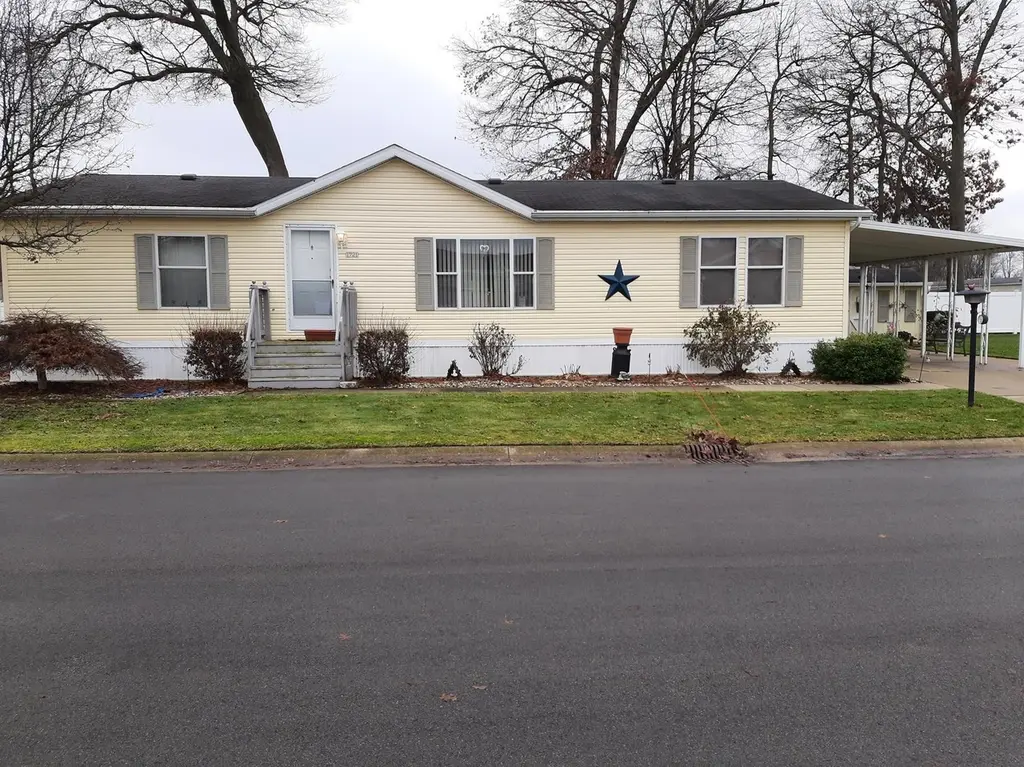
HPK 99 Boardwalk Plan · Elkhart, IN
Flood risk No data
- FEMA flood zone
- —
- Chance of flooding over 30 yrs
- —
- Est. flood insurance / yr
- —
Fire risk No data
- Est. fire insurance / yr
- —
Heat risk No data
- Hot days now (above threshold)
- —
- Hot days in 30 yrs
- —
Wind risk No data
- Chance of severe wind over 30 yrs
- —
Air-quality risk No data
- Unhealthy air days now
- —
- Unhealthy air days in 30 yrs
- —
Risk factors via First Street. Map © Google.
Why this score? — see what drove the C- grade
The composite is a weighted blend of 9 inputs, each scored 0–100. Each bar is that input's sub-score; the figure is the points it added to the 100-point composite (weight × sub-score).
- Cash flow +20.2/30.0
- ARV discount +7.5/15.0
- DSCR +6.4/10.0
- 1% rule +5.3/10.0
- Rent growth +4.3/5.0
- Condition / age +3.8/5.0
- Livability +3.4/5.0
- Schools +1.8/10.0
- Appreciation +0.0/10.0
$90,400
🖨 Deal sheet 📄 Offer letter ✓ Due diligence
Listing remarks MLS
Don't miss this beautifully maintained home featuring 3 spacious bedrooms and 2 full bathrooms, including a brand-new walk-in shower. Enjoy the convenience of a mud room, mewer HVAC for yer-round comfort, and a covered carport. Additional storge is available in the included shed. This move-in ready property combines modern updates with functional features. Schedule your showing today!
Key facts
- Covered carport
- Included shed
- Walk-in shower
Tags
Neighborhood map
What this means for you Summary
Snapshot
- This is a 3-bed/2.0-bath manufactured listed at $90k. Condition is rated good.
Deal economics
- At list price, monthly cash flow is $190 ($2k/yr) — positive.
- The deal already cash-flows at list — no discount required.
- Meets the 1% rule at list price ($2k rent vs $90k).
- Recommended offer: $80k (12.0% below list) — sets the bar for market timing.
- Cap rate 7.8% vs local median 4.0% in Elkhart — top-decile yield for the area; either an underpriced asset or a hidden risk that comps aren't pricing in. Stress-test before assuming the spread holds.
Location & tenants
- Location reads 68/100 on livability (#224 in IN) — a middle-class / working-renter tenant base. Strengths: cost of living A+, housing A+, health & safety A+; Watch: amenities C-, schools F, crime F.
- Elkhart Community Schools (urban): math 18% / reading 25% proficiency, ranked #271 of 301 in IN (top 90%) — low school quality limits family demand, transient renter base, plan for 1-2y turnover.
- Market conditions: Rents rising fast (+7.0%/yr); 269 active listings in the ZIP; 4 comparable units currently listed for rent nearby; rentals lingering (median 44d on market — plan ~5-8 weeks vacancy on turnover, expect pricing pressure); 50% of comp listings sitting > 30 days — soft ceiling on asking rent; 484 units permitted in Elkhart County in 2024 (136 in 5+ unit buildings).
Forward outlook
- Local home prices are declining (-3.0%/yr); year-one equity from $1k of loan paydown is wiped out by about $5k of value loss. Plan a longer hold.
- Elkhart County population projected at +7% by 2050 — modest demand growth; plan on rents tracking national, not racing it.
- At projected returns (-3.0% appreciation + 7.0% rent growth), your $42k cash investment doubles in ~10 years — after that, you're playing with house money.
Negotiation context
- It's been on market 139 days — a 12% lower offer ($80k) is reasonable based on typical stale-listing flexibility.
Risks & watch-outs
- Watch-outs: property tax is 2.5% of price.
Questions for the listing agent
- It's been on market 139 days. Have you received any prior offers? Is the seller open to a 12% concession, seller financing, or rate buy-down credit?
- Property tax is high relative to price — has the assessment been appealed recently, and will the sale trigger a re-assessment?
- Why hasn't it sold? Are there any deal-killer items the seller is aware of (foundation, flood, title, zoning, code violations)?
- Is there a deadline driving the sale (1031 exchange, divorce, estate, relocation)? That informs how much negotiation room exists.
- Schools are F-rated, which usually means shorter tenancies and higher turnover. Who's the typical renter profile here, and what's been the actual vacancy rate?
- Crime grade is F in this area — have there been break-ins, vandalism, or insurance claims at this property in the last 3 years? What carrier currently insures it and at what premium?
- What's the average days-on-market for RENTAL listings here right now (not sales)? A rising rental-DOM trend means longer vacancies and softer asking-rent achievability than the comps imply.
- What's the recent tenant-quality profile in this submarket — average credit score on applications, eviction rate, late-payment / NSF rate, and stable-employment percentage? A property-management company in the area should have these aggregated.
- How much new for-sale + rental construction is in the pipeline within 1–3 miles? Heavy new supply typically softens prices + rents 12–24 months out; constrained supply supports both.
Investment metrics
- 1% rule
- 1.03% ✓
- Cap rate
- 7.80%
- Cash-on-cash
- 5.37%
- DSCR
- 1.24
- GRM
- 8.1
CMA / ARV
- ARV (median comp)
- $151,449
- List price
- $90,400
- Delta
- -40.31%
- Verdict
- UNDERPRICED
- Comps
- 3 within 1.0 mi
Show comp detail 3 sales within ~0.75 mi
| Address | Dist | Beds/Ba | Sqft | Sold | Price | $/sf | Match |
|---|---|---|---|---|---|---|---|
| 25025 Dunny St | 0.60mi | 3/2.0 | 1,568 (0%) | 7mo | $192,500 | $123 | 66 |
| 54085 Independence St | 0.33mi | 3/1.0 | 1,652 (+5%) | 8mo | $150,000 | $91 | 65 |
| 1909 Grover St | 0.39mi | 3/2.0 | 1,349 (-14%) | 10mo | $137,000 | $102 | 50 |
Match score weights: distance 35% · size 25% · config 20% · recency 20%. Top-matched comps best support the ARV.
Projected returns pro-forma
-3.0% appreciation · 7.03% rent growth · sell at horizon
- IRR
- -3.5%
- Equity multiple
- 0.86×
- Total profit
- $-5,819
- Equity at exit
- $22,582
- IRR
- 10.3%
- Equity multiple
- 1.94×
- Total profit
- $40,052
- Equity at exit
- $13,095
Cash invested: $42,406 (down + closing). Projections, not guarantees.
Landlord ↔ Tenant lean methodology
- Overall (STATE)
- 90 Strongly Landlord-Friendly
- State Indiana
- 90 Strongly Landlord-Friendly · R+11
- County
- — inherits STATE
- City
- — inherits STATE
ZIP-level market 46514
- Rents YoY
- 7.0%
- Active inventory
- 269
- Price-to-rent
- 4.8×
Monthly cashflow live
- Estimated rent
- $1,565 medium interval (Pro) →
- Mortgage (P&I)
- −$794
- Tax est. 1.5%
- −$189 /mo · $2,272/yr
- Insurance
- −$63
- HOA
- −$0
- Vacancy / Maint / Mgmt
- −$329
- Net cashflow
- $190
Break-even live
UW: 25.0% down · 7.5% · 30yr · 1.5% tax · 5.0% vac · 8.0% maint · 8.0% mgmt
Financing live
Cash to close
- Down payment
- $37,862
- Closing costs
- $4,543
- Reserves months
- —
- Total cash needed
- —
Loan-product check · same deal, 3 products live
Conventional
25% down · 7.5% · 30yr
- Down + closing
- —
- Monthly P&I
- —
- Monthly cashflow
- —
- DSCR
- —
- Eligible?
- —
Personal DTI + credit; lowest rate.
DSCR
20% down · 8.5% · 30yr
- Down + closing
- —
- Monthly P&I
- —
- Monthly cashflow
- —
- DSCR
- —
- Eligible?
- —
No personal income docs; deal must DSCR.
Hard money
10% down · 12.0% · 12mo
- Down + closing
- —
- Monthly P&I
- —
- Monthly cashflow
- —
- DSCR
- —
- Eligible?
- —
Short-term bridge; refi at stabilization.
Rent comps 4 comps
| Address | Beds | Baths | Sqft | Rent | $/sqft | DOM | Units | Dist |
|---|---|---|---|---|---|---|---|---|
| 1875 Osolo Rd Elkhart, IN | 1.0–3.0 | 1.0–2.0 | 948 | $1,000 | $1.05 | 20d | 1 | 0.18mi |
| 1626 Osolo Rd Elkhart, IN | 4.0 | 2.0 | 2190 | $2,595 | $1.18 | 20d | 1 | 0.46mi |
| 2304 Grant St Elkhart, IN | 4.0 | 2.0 | 1450 | $1,800 | $1.24 | 43d | 1 | 0.89mi |
| 1023 Cone St Elkhart, IN | 2.0 | 1.0 | 1112 | $1,200 | $1.08 | 44d | 1 | 1.48mi |
Listing history 18 events
-
2026-06-19days on market $90,400 Active 139 DOM
-
2026-06-18days on market $90,400 Active 138 DOM
-
2026-06-17days on market $90,400 Active 137 DOM
-
2026-06-16days on market $90,400 Active 136 DOM
-
2026-06-15days on market $90,400 Active 135 DOM
-
2026-06-14days on market $90,400 Active 133 DOM
-
2026-06-13days on market $90,400 Active 132 DOM
-
2026-06-10days on market $90,400 Active 130 DOM
-
2026-06-09days on market $90,400 Active 129 DOM
-
2026-06-08days on market $90,400 Active 128 DOM
-
2026-06-07days on market $90,400 Active 127 DOM
-
2026-06-05days on market $90,400 Active 124 DOM
-
2026-06-03days on market $90,400 Active 123 DOM
-
2026-06-02days on market $90,400 Active 122 DOM
-
2026-06-01days on market $90,400 Active 121 DOM
-
2026-05-31days on market $90,400 Active 120 DOM
-
2026-05-30days on market $90,400 Active 119 DOM
-
2026-01-31$90,400 Active 387-char remark
Show marketing remark (387 chars)
Don't miss this beautifully maintained home featuring 3 spacious bedrooms and 2 full bathrooms, including a brand-new walk-in shower. Enjoy the convenience of a mud room, mewer HVAC for yer-round comfort, and a covered carport. Additional storge is available in the included shed. This move-in ready property combines modern updates with functional features. Schedule your showing today!
ⓘ Source: listings_history table (triggers on properties + properties_extension) + one-shot
backfill from property_details.listing_events for pre-trigger history.
Nearby sold comps map
Loading sold comps map…
Walkable amenities ~0.75 mi
Loading nearby amenities…
Taxation est. · year 1
- Rental income
- $18,783
- − Mortgage interest
- −$8,483
- − Property taxes
- −$2,272
- − Insurance
- −$757
- − Repairs & maintenance
- −$1,503
- − Management
- −$1,503
- − Depreciation
- −$4,406
- Taxable loss
- −$141
- Est. tax savings @ 24.0%
- +$34
- After-tax cash flow
- $2,313/yr
For passive investors: Depreciation is non-cash, so a rental often shows a tax loss while cash-flowing — sheltering income. Rental losses are passive: they offset passive income freely, and up to $25,000/yr can offset ordinary (W-2) income if you actively participate and your MAGI is under $100k (phasing out to $0 by $150k); unused losses carry forward. On sale, claimed depreciation is recaptured at up to 25%, and gains may owe capital-gains tax (a 1031 exchange can defer both). Figures are a year-1 estimate at your 24.0% rate — not tax advice; consult a CPA.
Condition & rehab AI · 1 photo
This move-in ready manufactured home features modern updates and functional features, with good exterior and interior conditions.
Value-add opportunities
- Both Painting exterior — Enhances curb appeal and value
- Both Landscaping — Improves curb appeal and value
- Both HVAC maintenance — Ensures year-round comfort and energy efficiency
Renovation cost estimate screening
Value-add ROI direction
- Both Painting exterior — Enhances curb appeal and value ↑
- Both Landscaping — Improves curb appeal and value ↑
- Both HVAC maintenance — Ensures year-round comfort and energy efficiency ↑
ⓘ Cost ranges are severity-bucket heuristics (US national rule-of-thumb). Get contractor quotes + a written scope before underwriting a rehab budget.
Schools (NCES district)
- District
- Elkhart Community Schools
- NCES district ID
- 1803270
- Math proficiency
- 18% ▼ -12.00%
- Reading proficiency
- 25% ▼ -9.00%
- Median HH income
- $42,881
- Composite
- 18.45/100
- National rank
- #8928
- State rank
- #271 of 301 in IN
Livability — Elkhart
- Score
- 68/100
- State rank
- #224
- US rank
- #9852
Category grades
Schools grade is shown separately in the Schools card above.
Census & demographics
- Census place
- Elkhart, IN
- County
- Elkhart County · 107,928 people
- City population
- 74,260
- Metro
- Elkhart-Goshen, IN
- Population (ZIP)
- 42,389
- Household income
- $65,833
- Rent vs Own
- Severe rent burden
- 1061.0
Population outlook (Elkhart County) Hauer SSP2
- Today (2025)
- 213,761 people
- By 2030
- 218,103 · +2.0%
- By 2040
- 225,381 · +5.4%
- By 2050
- 229,447 · +7.3%
- By 2075
- 232,856 · +8.9%
- By 2100
- 214,088 · +0.2%
Race, ethnicity, and origin ACS 2023
- Neighborhood character
- Predominantly White (74%)
- Race & ethnicity
- White 74% Hispanic / Latino 14% Two or more races 6% Black 5% Asian 1%
- Hispanic origin (detail)
- Mexican 10%
- Common ancestry
- Lithuanian 2% Romanian 2% Italian 2%
- Foreign-born
- 8% · Canada
- Languages at home
- 89% English-only · Spanish 10%
Political lean MEDSL · Elkhart
- 2024 margin
- Solid R (+32.4) · D 33.1% · R 65.5% · Other 1.4%
- 2008→2024 swing
- -21.2pp toward R · 2008: -11.2pp · 2024: -32.4pp
- All cycles
- 2024: R+32.4 2020: R+28.1 2016: R+32.4 2012: R+26.5 2008: R+11.2
Not yet ingested
- Civics
- —
Market trends
- HPI YoY
- ▼ -246.78%
- Current HPI
- 225.6
- Rent YoY
- ▲ 7.03%
- Metro
- Elkhart-Goshen, IN
- State GDP YoY
- ▲ 2.90%
- F500 in state
- 18
Industry mix (Fortune 500 HQ in IN)
| Industry | F500 HQs | Revenue |
|---|---|---|
| Industrial Machinery | 2 | $37B |
|
||
| Healthcare | 1 | $177B |
|
||
| Pharmaceuticals | 1 | $45B |
|
||
| Metals / Steel | 1 | $18B |
|
||
| Agriculture | 1 | $17B |
|
||
| Packaging | 1 | $12B |
|
||
Price history
1 event — show timeline
- 2026-01-31 Listed $90,400 Zillow
Cash-flow waterfall
monthlySold comps — $/sqft
last 12 mo · ≤1 miLoading sold comps…